
Abstract
BACKGROUND AND PURPOSE: Response on imaging is widely used to evaluate treatment efficacy in clinical trials of pediatric gliomas. While conventional criteria rely on 2D measurements, volumetric analysis may provide a more comprehensive response assessment. There is sparse research on the role of volumetrics in pediatric gliomas. Our purpose was to compare 2D and volumetric analysis with the assessment of neuroradiologists using the Brain Tumor Reporting and Data System (BT-RADS) in BRAF V600E-mutant pediatric gliomas.
MATERIALS AND METHODS: Manual volumetric segmentations of whole and solid tumors were compared with 2D measurements in 31 participants (292 follow-up studies) in the Pacific Pediatric Neuro-Oncology Consortium 002 trial (NCT01748149). Two neuroradiologists evaluated responses using BT-RADS. Receiver operating characteristic analysis compared classification performance of 2D and volumetrics for partial response. Agreement between volumetric and 2D mathematically modeled longitudinal trajectories for 25 participants was determined using the model-estimated time to best response.
RESULTS: Of 31 participants, 20 had partial responses according to BT-RADS criteria. Receiver operating characteristic curves for the classification of partial responders at the time of first detection (median = 2 months) yielded an area under the curve of 0.84 (95% CI, 0.69–0.99) for 2D area, 0.91 (95% CI, 0.80–1.00) for whole-volume, and 0.92 (95% CI, 0.82–1.00) for solid volume change. There was no significant difference in the area under the curve between 2D and solid (P = .34) or whole volume (P = .39). There was no significant correlation in model-estimated time to best response (ρ = 0.39, P >.05) between 2D and whole-volume trajectories. Eight of the 25 participants had a difference of ≥90 days in transition from partial response to stable disease between their 2D and whole-volume modeled trajectories.
CONCLUSIONS: Although there was no overall difference between volumetrics and 2D in classifying partial response assessment using BT-RADS, further prospective studies will be critical to elucidate how the observed differences in tumor 2D and volumetric trajectories affect clinical decision-making and outcomes in some individuals.
ABBREVIATIONS:
- AUC
- area under the curve
- BT-RADS
- Brain Tumor Reporting and Data System
- MinR
- minor response
- nRMSE
- normalized root mean squared error
- PD
- progressive disease
- PNOC
- Pacific Pediatric Neuro-Oncology Consortium
- PR
- partial response
- RAPNO
- Response Assessment in Pediatric Neuro-Oncology
- ROC
- receiver operating characteristic
- SD
- stable disease
Gliomas make up 53% of all primary brain and CNS tumors in children. While the most common glioma subtype is pilocytic astrocytoma, malignant gliomas have a higher incidence in children with increasing age. Pediatric gliomas make up a heterogeneous class of tumors with prognosis depending on tumor location, histology/grade, and age at diagnosis. The 10-year progression-free survival of patients with low-grade gliomas is 96%, while those with glioblastomas have a progression-free survival below 20%.1 While surgery, chemotherapy, and radiation therapy are currently the standard treatments for pediatric glioma, therapies targeted to specific genetic mutations can also be used to prevent disease progression.2 Although the BRAF V600E mutation confers a poor prognosis in pediatric gliomas, studies have shown that treatment with a BRAF inhibitor, such as vemurafenib or dabrafenib, can lead to disease stabilization or response. Despite these promising results, disease re-progression has been observed after discontinuation of the BRAF inhibitor, and pediatric high-grade gliomas do not have a response that is as sustainable as low-grade gliomas.3 Pediatric glioma response assessment is largely based on imaging changes. However, the complex appearance of these tumors on imaging makes it challenging to accurately assess treatment response or failure.4
The Response Assessment in Pediatric Neuro-Oncology (RAPNO) criteria were developed to address the unique challenges of assessing pediatric gliomas on imaging, including their diffuse nature, cystic components, irregular borders, and variable enhancement pattern. RAPNO criteria are based on 2D measurements of tumor on either T1 contrast-enhancing or T2/FLAIR sequences chosen on the basis of tumor grade and location.5 Given the challenge of applying 2D criteria to heterogeneous tumors like pediatric gliomas,4 volumetrics (ie, an assessment of the 3D tumor volume) may better characterize a response.6 While the RAPNO criteria provide some recommendations on volumetric assessment, they are not considered standard practice.5 Moreover, the volume-extrapolated RAPNO thresholds used in volumetric assessment are derived from the mathematic extrapolation of 2D thresholds to a perfect sphere, assuming uniform tumor growth.7 Given the heterogeneous and irregular growth pattern of pediatric gliomas, further research is needed to validate the volumetric RAPNO criteria in practice.4 However, previous research has largely focused on the role of volumetrics in adult brain tumors.8⇓⇓-11 Additionally, elucidation of the dynamics of tumor response is critical for accurate clinical management and evaluation of novel therapeutics.
We performed a retrospective analysis of images from the Pacific Pediatric Neuro-Oncology Consortium (PNOC) 002 clinical trial (NCT01748149) of vemurafenib in BRAF V600E-mutant pediatric gliomas.12 The primary purpose of our study was to compare volumetric and 2D-based response assessment with a reference standard, the Brain Tumor Reporting and Data System (BT-RADS), which is a structured and standardized framework for neuroradiologists’ visual assessment of response based on several factors, including tumor enhancement, nonenhancing tumor components, and tumor mass effect.13 We hypothesized that volumetric assessment would correlate more closely with BT-RADS than 2D measurements. Because clinical decision-making is often based on trends observed across time rather than single timepoints, we also used mathematic modeling to understand the differences in volumetric and 2D longitudinal posttreatment trajectories.
MATERIALS AND METHODS
Trial Data and Measurements
We conducted a retrospective analysis of 31 participants (292 total follow-up scans) enrolled in the PNOC-002 trial, a phase I/II study of vemurafenib in BRAF V600E-mutant pediatric gliomas (Table 1).12 Before trial enrollment, all participants had recurrence of tumor after surgery and at least one other therapy (chemo- or radiation therapy) and were not on any other treatment other than vemurafenib during the trial period. A board-certified neuroradiologist (M.S.A.) unblinded to follow-up scans performed 2D measurements on the pretreatment sequence (T2/FLAIR, T1 contrast-enhancing, or T1 pre-contrast) in a plane that best captured solid tumor, with cystic components included only if inseparable from solid components. The same sequence and plane were used to perform 2D measurements in all subsequent follow-up images to ensure consistency. T2/FLAIR sequences were used for most participants. However, in cases in which 2D measurements could not reliably and consistently capture tumor burden (eg, tumors with irregular or diffuse borders on T2/FLAIR) or the solid tumor portion was difficult to clearly visualize on T2/FLAIR, alternative sequences (ie, T1 or T1 contrast-enhancing) were used according to the neuroradiologist’s clinical judgment. The T1 contrast-enhancing sequence was only chosen in cases in which there was consistent tumor enhancement without transient or variable patterns of change. The Online Supplemental Data show the 2D measurements performed for each participant on the pretreatment image. According to RAPNO guidelines,5 the minimal bidimensional length of a lesion was 10 mm. Lesions that did not meet these criteria were not included in 2D or volumetric measurements.
Participant demographics
3D segmentations of whole tumor (ie, including solid and cystic components) on FLAIR and cystic tumor on T2 were performed by a fourth-year medical student (D.R.) and corrected by the same board-certified neuroradiologist who performed the 2D measurements (M.S.A.). Segmentations were performed on a PACS-integrated annotation platform whereby a volumetric tool automatically extrapolated manual segmentations performed at the outermost tumor borders.14 These extrapolated segmentations were then manually adjusted slice by slice. Solid tumor volume was calculated by subtracting the cystic volume on T2 from the whole volume on FLAIR.
Comparison of 2D and Volumetrics with the Visual Assessment of Neuroradiologists
We compared 2D and volumetric RAPNO assessments with a reference standard, which we defined as the consensus score between 2 neuroradiologists’ visual assessments of the tumor response using the BT-RADS criteria.13 This comparison was performed for all participants at the end of treatment or last available on-treatment scan (for participants still on therapy at the time of analysis). BT-RADS is used in several clinical neuroradiology practices and represents the clinical interpretation of imaging findings with scores corresponding to definitive recommendations in clinical monitoring frequency and management.13 Standard and volume-extrapolated RAPNO criteria (Table 2) were applied to percentage change from pretreatment in the 2D area (sum of the product of maximal bidimensional diameters of all lesions) and whole volume, respectively. We used the pretreatment scan, which was also postsurgical, as the baseline.5 BT-RADS scores from a pretreatment baseline were assigned to each follow-up scan on the basis of mutual consensus between 2 board-certified neuroradiologists (M.S.A. and F.M.). We classified a BT-RADS score of 1a as partial response (PR), 1b to 3b as stable disease (SD), and 3c to 4 as progressive disease (PD) (Table 2). Paired log-rank tests were used to compare the time to the first response (confirmed on a consecutive scan at least 4 weeks later) between BT-RADS and each of the following criteria: 2D area change using the RAPNO minor response (MinR) threshold and whole and solid volume change using the volume-extrapolated RAPNO MinR threshold.
Response-assessment criteria
Empirical receiver operating characteristic (ROC) curves were plotted to compare the performance of 2D, solid-volume, and whole-volume change in classifying participants as having BT-RADS PR at 2 time points: 1) the end of treatment or last available on-treatment follow-up scan, and 2) the time of the BT-RADS first-confirmed response or first follow-up scan if no response. The DeLong test from the pROC15 package in R (https://www.rdocumentation.org/packages/pROC/versions/1.18.5) was used to compare whether the area under the curve (AUC) values were statistically different between measurement methods at both time points. A 95% confidence interval for the AUC was computed using 2000 stratified bootstrap replicates. All statistical analyses were performed in R studio, Version 2022.12.0 + 353 (http://rstudio.org/download/desktop).
Modeling 2D and Volumetric Longitudinal Treatment Response
We describe tumor growth mechanistically as the action and counteraction between treatment response and the onset of therapy resistance to parameterize the obtained tumor growth curves.16,17 This model uses 3 patient-specific parameters characterizing the tumor growth rate (λ), treatment-induced tumor shrinkage (γ0), and therapy resistance (∈). The tumor volume V is approximated as an exponential function in time at rate λ. In contrast, systemic therapy with vemurafenib is modeled to lead to an exponential reduction in tumor volume at rate γ:
 1)
1)
Given the onset of therapy resistance, we, in turn, describe the treatment efficacy as time-dependent with an exponential decay at rate ϵ:
 2)
2)
The analytical solution to this system of ordinary differential equations is
 3)where γ0 indicates the initial condition at therapy initiation at time t0. V0 is the tumor volume (or 2D area) assessed at the first scan. Patient data in either 2D or whole-volume tumor growth curves were fitted to Equation 3 using the python lmfit library (https://lmfit.github.io/lmfit-py/) in a bootstrap approach in which each data point was resampled n = 500 times from a normal distribution around the observed value (mean) with a 10% standard deviation as an estimate of random error stemming from contouring uncertainty. Given the choice of 3 patient-specific model parameters, only growth trajectories comprising at least 3 data points (ie, 2 follow-up scans) were included in this analysis.
Assessing Agreement between 2D and Volumetric Response Curves
From the model-obtained parametrizations, the estimated time to best response, ie, the minimal tumor volume (tVmin), was used for further analysis as a notion of the overall trend in the data:
 4)
4)
We assigned data points preceding Vmin (including a 10% uncertainty window) as PR, those around (within a 10% uncertainty window) Vmin as SD, and those beyond Vmin as PD. We quantified the correlation between tVmin obtained from 2D and volumetric fits using the Spearman rank correlation coefficient ρ. The time to transition between response categories (ie, PR to SD or SD to PD) was also compared for all patients in whom such transitions were observed. RAPNO criteria require confirmation of response assessment on 2 consecutive scans,5 and the median time interval between 2 consecutive scans in this data set was 90 days. Therefore, we defined “transition agreement” as a difference in the time to transition between response categories of <90 days. We used the Wilcoxon rank-sum test to compare the following quantitative features between participants with agreement and disagreement in 2D-versus-whole-tumor trends: FLAIR sequence slice thickness, spacing, pretreatment whole and cystic volume, and the relative model fit performance of 2D-versus-whole-tumor curves quantified by normalized root mean squared error (nRMSE). The latter was interpreted as a proxy for uncertainty in measurement/segmentation. All statistical tests were performed using the scipy stats module in python (https://docs.scipy.org/doc/scipy/tutorial/stats.html).
RESULTS
Comparing 2D and Volumetrics Using RAPNO and BT-RADS Criteria
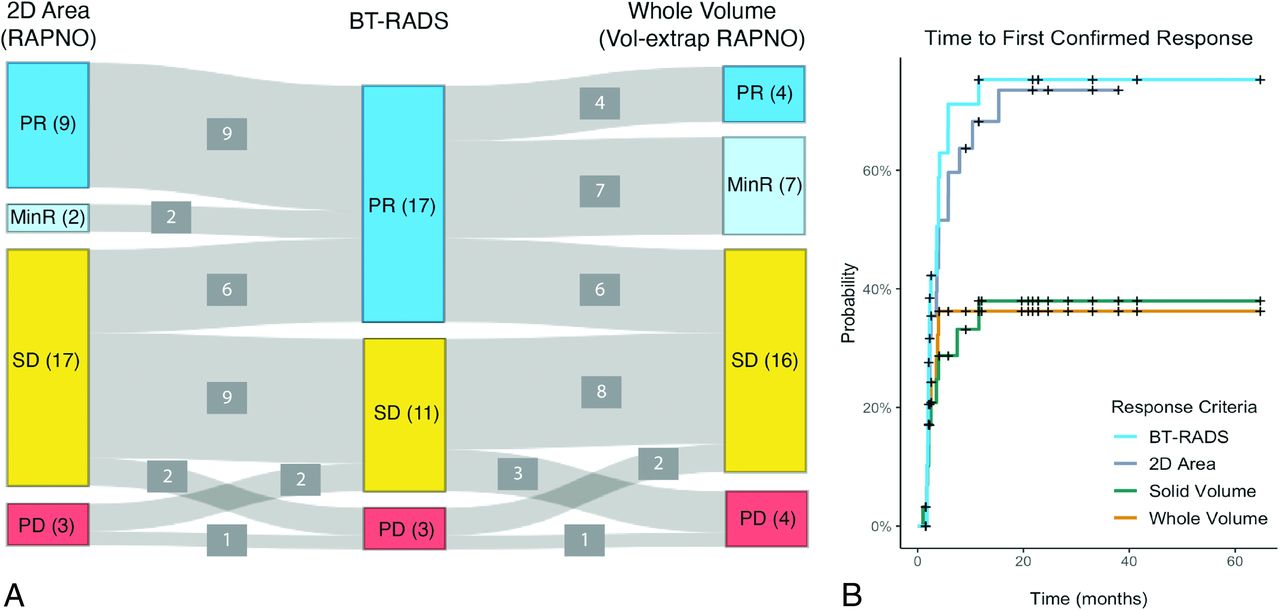
Of 31 participants, 26 completed treatment while 5 were still on treatment at the time of analysis. The end of treatment (n = 26) and last available on-treatment scans (n = 5) had a median follow-up time from the pretreatment baseline scan of 21 months (range, 2–69 months). BT-RADS criteria classified 17 participants as having PR, 11 as SD, and 3 as PD. Of the 17 participants with BT-RADS PR, 11 (65%) were classified as having either PR or MinR by both 2D area and whole volume using standard and volume-extrapolated RAPNO thresholds, respectively. The remaining 6 of 17 BT-RADS PR participants were classified as having SD by both methods. While most participants were classified as having PR by BT-RADS (n = 17), most were classified as having SD by both 2D area (n = 17) and whole volume (n = 16) (Fig 1A).

Comparison of response criteria. A, Sankey plot comparing the response classification for 31 participants at the end of treatment or last available follow-up scan based on 2D area percentage change with RAPNO thresholds, BT-RADS, and whole-volume percentage change with volume-extrapolated RAPNO thresholds. B, Time-to-response curves for 31 participants using BT-RADS, 2D area percentage change with the RAPNO MinR threshold, and solid/whole-volume percentage change with a volume-extrapolated RAPNO MinR threshold. Response had to be confirmed on a consecutive scan at least 4 weeks later.
Time-to-response curves were plotted using different response criteria (Fig 1B). Of 31 participants, 20 (65%) had a response (median time to response = 3.6 months) with BT-RADS criteria, 19 (61%) (median time to response = 4.0 months) with 2D area using the MinR RAPNO threshold, and 10 (32%) with both whole and solid volume using the volume-extrapolated MinR RAPNO threshold. Paired log-rank tests revealed a significant difference in response time between BT-RADS and solid (P = .02) and whole (P = .04) volume. However, there was no significant difference between BT-RADS and 2D area (P = .40).
BT-RADS Classification Performance of 2D versus Volumetric Change
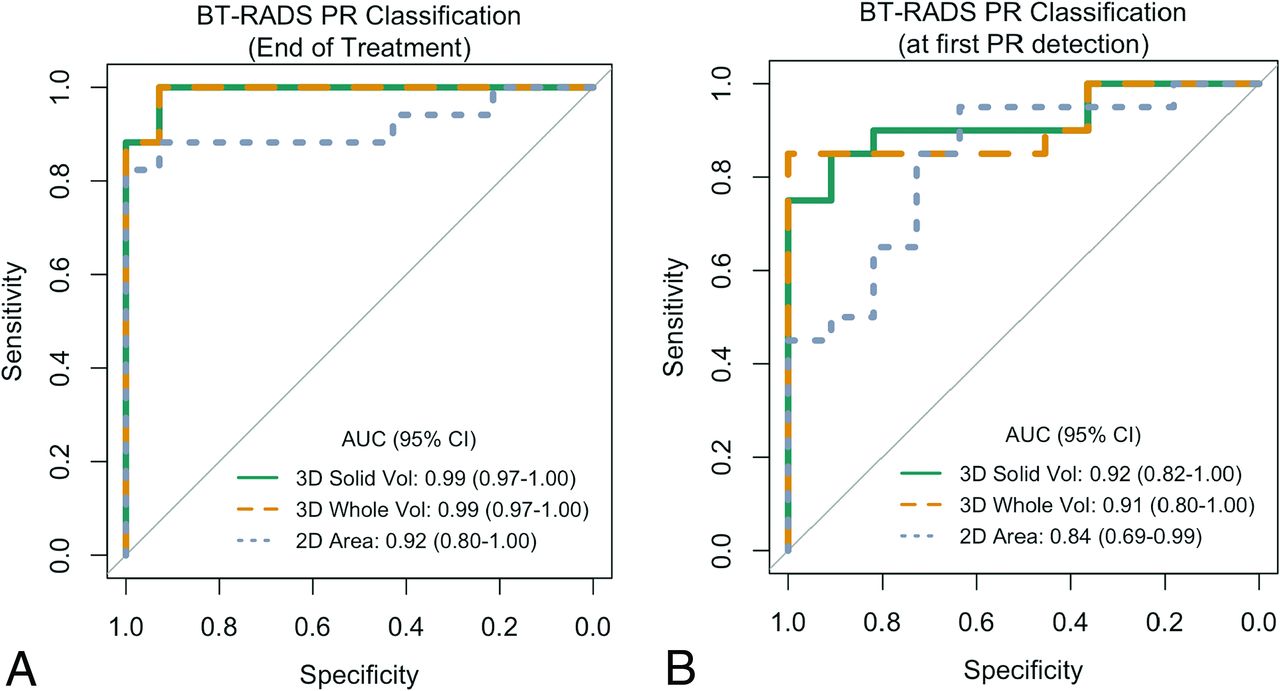
The ROC curve for classification of BT-RADS PR versus non-PR (SD/PD) at the end of treatment (n = 26) or last available on-treatment scans (n = 5) had an AUC of 0.92 (95% CI, 0.80-1.00) for 2D area change and 0.99 (95% CI, 0.97–1.00) for both whole- and solid-volume change (Fig 2A). DeLong tests revealed no significant difference in the AUC between 2D area and solid (P = .17) or whole (P = .17) volume. Of 31 participants, 20 experienced a confirmed BT-RADS PR during treatment, while the remaining 11 did not have confirmed BT-RADS PR. The ROC curve for differentiation of BT-RADS PR and non-PR at the time of first confirmed BT-RADS PR or first available follow-up (median follow-up time of scans = 2 months) yielded an AUC of 0.84 (95% CI, 0.69–0.99) for 2D area, 0.91 (95% CI, 0.80–1.00) for whole volume, and 0.92 (95% CI, 0.82–1.00) for solid volume (Fig 2B). DeLong tests again revealed no statistically significant difference in the AUC between the 2D area and solid (P = .34) or whole volume (P = .39) (Fig 2B).

ROC curves comparing the performance of 2D area and whole- and solid-volume percentage change in classifying BT-RADS PR versus non-PR (SD/PD) for 31 participants at the end of treatment or last available scan (A) and time of BT-RADS first-confirmed response or first follow-up scan if no response (B). Vol indicates volume.
Longitudinal Response Assessment of 2D and Volumetric Change
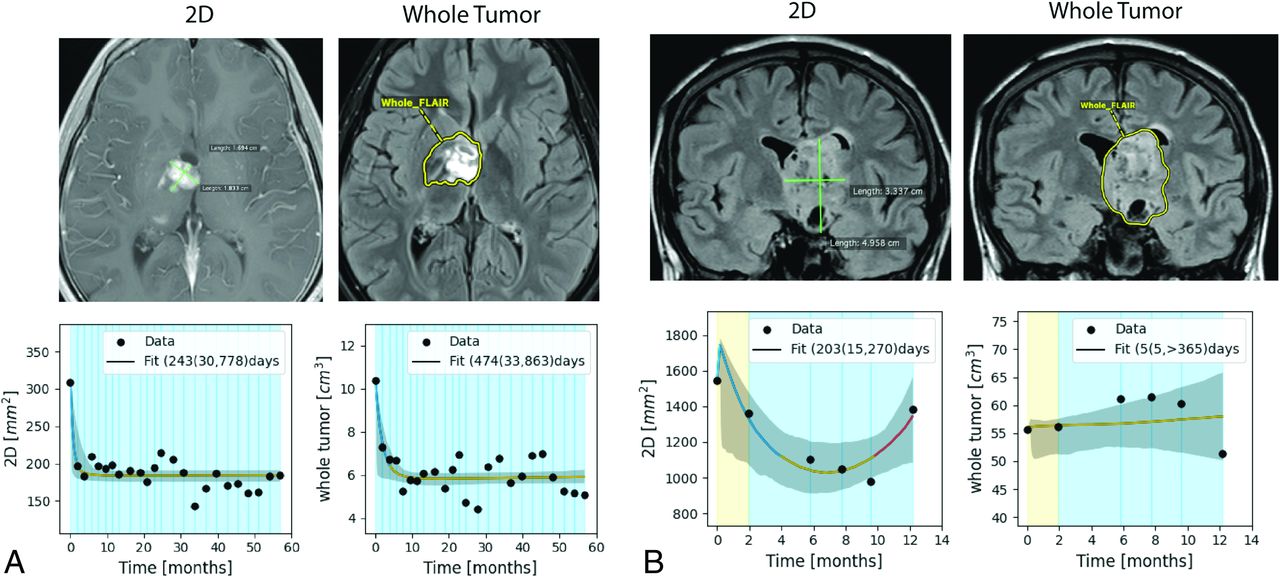
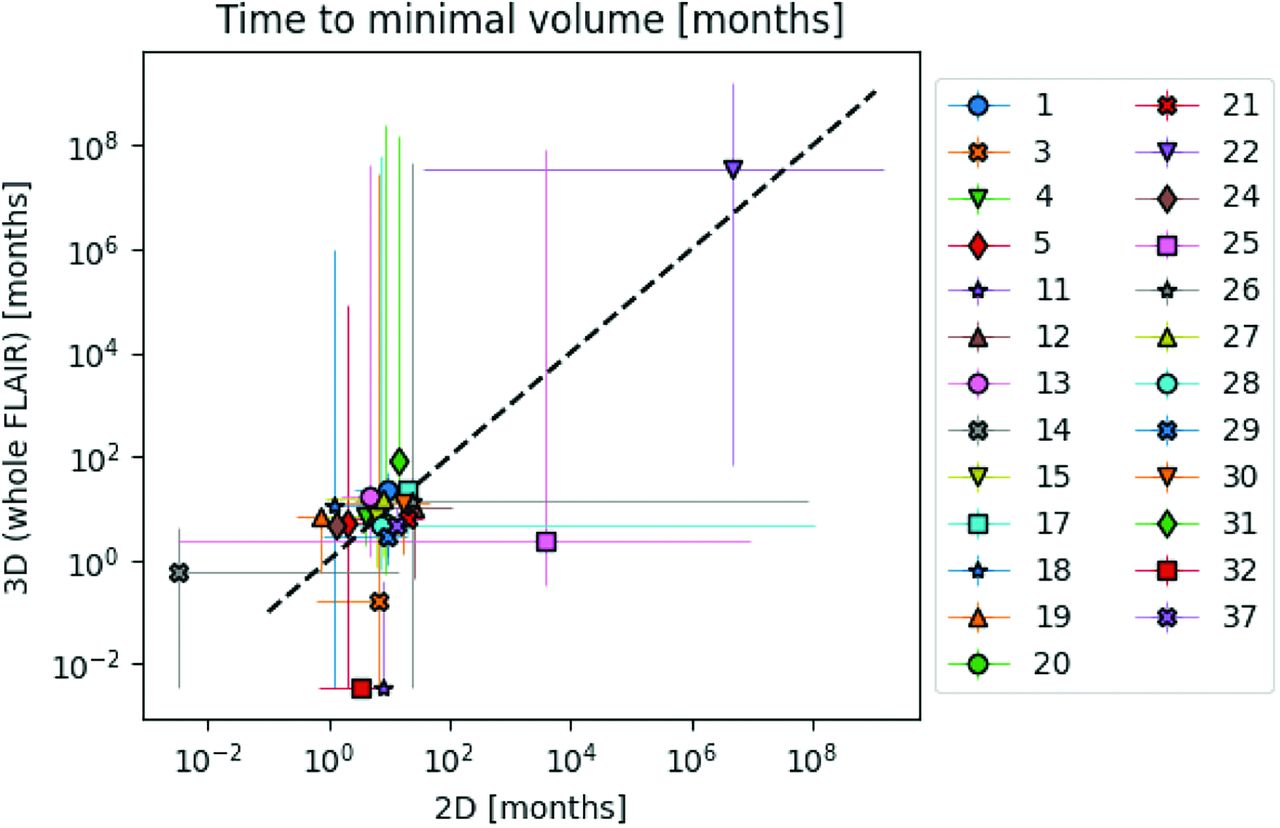
Longitudinal model fits were performed for 25 of the 31 participants. Model fits could not be performed for the remaining 6 participants because 5 of them had only 2 timepoints and 1 (participant 16) had a tumor growth pattern that did not comply with model-intended dynamics (Online Supplemental Data). Figure 3 shows 2D-versus-whole-volume growth trajectories from 2 participants with relevant model fits, fit confidence intervals, and model-based label assignments (line color). Plots for all other participants are provided in the Online Supplemental Data. Figure 4 summarizes the model-estimated time to best response for 2D-versus-whole volume. There was no significant correlation between the values of 2D and whole-volume time to best response (ρ= 0.39, P = .054), with notable deviations in these trajectories indicated by deviation from the diagonal line in Fig 4. Given the many partially responding participants in this cohort and the associated limitations in fitting tumor regrowth, there were large uncertainties in the assessment of time to best response from model fits, demonstrated by the wide confidence intervals in Fig 4.

Examples of agreement (A) and disagreement (B) in 2D and whole-tumor volume trajectories of 2 participants based on model-determined time to best response. 2D measurements and segmentations on 1 representative slice of the whole tumor are shown. Line colors indicate the model-based assignment to either PR (blue), SD (yellow), or PD (red), and background colors reflect BT-RADS labels relative to the pretreatment scan at each follow-up. Model fits are shown with 95% confidence intervals, and the obtained distribution for minimal tumor volume, as medians with 95% confidence intervals are given in the legend.

Correlation in model-determined median time to best response with 95% confidence intervals between 2D and whole-tumor volume trajectories for 25 participants. We observed a nonsignificant correlation of the estimated time to best response between 2D and whole-tumor assessments (Spearman rank correlation coefficient = 0.39, P value = .054).
The Online Supplemental Data summarize model agreement and imaging protocol parameters for all participants with model fits. The difference in model-assigned time to transition from PR to SD between 2D and whole-volume trajectories was ≥ 90 days in 8 of 25 participants. Of the 8 participants, 2D showed a later PR-to-SD transition in 4 participants and an earlier transition in 1 participant. Three participants showed tumor remission on 2D but a stable trajectory in whole-tumor volume. Sixteen of 25 participants showed signs of tumor regrowth in either 2D or volumetric trajectories and were considered for scoring the agreement in the SD-PD transition. Eight of these participants did not agree in the transition from SD to PD based on a time to transition of ≥90 days in 2D or whole-tumor trajectories. Of these, 2D showed a transition from SD to PD, while the whole volume did not show a transition in 5 participants. Two participants showed a later SD-to-PD transition in 2D.
Given Bonferroni multiple testing correction (number of tests = 7) and the comparably small sample size, the Wilcoxon rank-sum test showed no statistically significant difference in any of the assessed imaging or goodness-of-fit features. The lowest P value was observed for the ratio of the 2D and whole-volume nRMSE between participants with agreement (median 2D/whole-volume nRMSE = 4.2; full range, 1.1–12.6) and disagreement (median 2D/whole-volume nRMSE = 7.4; full range, 4.7–12.4) in the PR-to-SD transition (P = .01). Participants with disagreement in 2D and whole-volume trajectories had a larger observed error in 2D compared with whole-tumor model fits. The best-performing imaging feature was the mean slice thickness (P = .04 for PR-SD agreement), indicating a trend in which a larger slice thickness may lead to disagreeing trends (median FLAIR slice thickness in agreement group = 4.0 with full range, 1.0–5.0; median in disagreement group = 4.3 with full range, 4.0–4.9).
DISCUSSION
The main findings of this study are the following: 1) a moderate congruence between BT-RADS and both 2D and whole-volume assessments using standard and volume-extrapolated RAPNO thresholds, respectively; 2) a significant difference in the time to response between BT-RADS and volumetrics using volume-extrapolated RAPNO thresholds; 3) no significant difference in the AUC between 2D and volumetric ROC curves for BT-RADS PR classification; and 4) a strong variation in model-based estimation of the time to best response between 2D and whole-volume trajectories. Among a subset of 25 participants, 32% had a difference in time to transition from PR to SD of ≥90 days between 2D and whole-volume trajectories and 50% had a difference of ≥90 days in the time to transition from SD to PD.
The results contrast with our hypothesis in that volumetrics did not perform significantly better than 2D in the classification of response based on BT-RADS, our predefined reference standard in this study. One reason may be insufficient statistical power to detect a significant difference, given our limited sample size. Another reason may be that 2D measurements were performed on the sequence/plane that best represented tumor burden after a multiplanar assessment of tumor response. Subtle changes in growth dynamics on multiple planes may be better represented in a carefully chosen 2D plane, whereas the nature of 3D might introduce volume averaging of subtle findings that diminish sensitivity. On the other hand, selecting a 2D plane that represents subtle changes well relies on the precision of the radiologist. Moreover, the heterogeneity of tumors in the participant cohort, which included both low- and high-grade gliomas, may have contributed to the lack of a significant difference seen among volumetrics and 2D in detecting a partial response. Further investigation into the role of volumetrics based on tumor imaging characteristics, location, and subtype may reveal differences among response methods. Volumetric segmentation accuracy may have been affected by thicker image slices because isotropic 1- mm slice imaging protocols for several participants were unavailable. Given the low number of participants who had PD according to BT-RADS criteria, we could not assess the relative performance of 2D versus volumetrics in classifying PD.
Longitudinal modeling showed different trajectories in 2D and whole volume in several participants based on the model-estimated time to best response. While visualization provides a qualitative motivation for this observation, we quantified this agreement in terms of the agreement to transition in labels, either PR to SD (32% disagreement) or SD to PD (50% disagreement). Four participants had a stable whole-volume trajectory throughout treatment, while 2D showed changes in response labels in these same 4 participants. Three other participants showed tumor response followed by SD in both whole and 2D trajectories. However, these same 3 participants showed tumor regrowth following SD in 2D but not whole-volume trajectories. These findings are consistent with those from Ellingson et al11 showing that volumetrics had more stable growth rates than 2D measurements in adult low-grade gliomas. Furthermore, we found that participants with disagreement in 2D-versus-whole-volume trajectories had a higher error in 2D than in the volumetric model fit, which was taken as a proxy for measurement uncertainty.
Taken together, our findings suggest that variability and uncertainty in 2D measurements may contribute to more fluctuations in 2D trajectories compared with volumetrics. This finding may lead to unwarranted changes in clinical management, making it essential to confirm 2D changes with volumetric ones. On the basis of preliminary observations from our study data, we hypothesize that fluctuations observed in 2D but not volumetric trajectories may be due to the following reasons: 1) Nonuniform tumor changes may not be fully captured by 2D measurements, leading to falsely classifying a tumor as having a response or progression based on a single plane; 2) variation in slice thickness between follow-up images may lead to inconsistency in the location of 2D measurement planes; and 3) in tumors with diffuse borders, 2D measurements may be more prone to measurement fluctuations than volumetrics. Thus, we recommend the use of volumetrics, particularly in pediatric gliomas with diffuse borders or nonuniform changes occurring on multiple planes.
Our study has several strengths. While previous studies on volumetric assessment of gliomas6,11 have compared 2D and volumetrics using existing literature thresholds, our study compared 2D and volumetric change with the visual assessment of the response of neuroradiologists based on the structured BT-RADS criteria, which are closely correlated with clinical management. We found that most participants had a partial response when assessed by BT-RADS but SD based on 2D and volumetric RAPNO criteria. Furthermore, while there have been other studies that tracked 2D-versus-volumetric longitudinal treatment response in adult and pediatric low-grade gliomas,11,18 our study used a mathematic model that accounts for both treatment response and resistance16 when tracking 2D and volumetric changes. We also investigated how imaging protocols and measurement uncertainty are related to agreement between 2D and volumetric trajectories. The choice of 2D or volumetrics in clinical practice may depend on tumor characteristics such as heterogeneity and shape, which can affect the reliability of 2D and volumetric trajectories, and both trajectories should be considered in decision-making.
Our study also had limitations. The main ones were the small participant sample size and inherent interrater variability associated with manual volumetric segmentation,19 for which we tried to account by assuming a 10% contouring uncertainty in our longitudinal models. Interrater differences in 2D measurements, particularly for more irregularly shaped and multifocal tumors, may also affect the comparison of 2D and volumetrics. A second limitation was the unavailability of functional treatment outcomes to correlate with radiographic response assessment. Instead, we used the best reference standard we had available (ie, neuroradiologist assessment based on BT-RADS) to compare 2D and volumetric methods, though this falls short of the criterion standard of clinical outcomes. BT-RADS criteria are holistic and structured, with scores corresponding to recommendations for clinical monitoring and management, which can be more useful than RAPNO criteria in the clinical setting.
Finally, we assigned a BT-RADS score at each timepoint compared with the pretreatment image. A future avenue of research would be to correlate longitudinal 2D and volumetric trends to trends in BT-RADS scores, which are assigned at each timepoint compared with the most recent prior scans instead of the pretreatment image alone. Future research could also aim to quantify interrater variability in volumetric measurements, which can be incorporated into longitudinal volumetric trajectories. With the advent of pediatric glioma-segmentation algorithms, volumetrics may be more efficiently incorporated into clinical practice and research.20 Finally, prospective research in larger pediatric glioma cohorts is necessary to determine whether volumetrics or 2D better predicts clinical outcomes.
CONCLUSIONS
Our study compared the 2D and volumetric response assessment with the reference standard of neuroradiologists’ visual assessments using BT-RADS in BRAF V600E-mutant pediatric gliomas from the PNOC-002 trial. While our study did not detect a significant difference between 2D and whole-volume change in classifying the BT-RADS partial response either at the end of treatment or at the first timepoint of BT-RADS partial response detection, we found a significant difference in the time to first response between BT-RADS and volumetrics using volume-extrapolated RAPNO criteria. Moreover, we did not find a significant correlation in the time to best response between longitudinal models of 2D and volumetric trajectories, suggesting that trends in individual participant responses may greatly differ between 2D and volumetrics. Because several participants had large differences in the time to transition between response classifications based on 2D and volumetric trajectories, we suggest that volumetrics be incorporated into clinical practice because the additional information provided may influence treatment monitoring and management.
Acknowledgments
We would like to thank all Pacific Pediatric Neuro-Oncology Consortium investigators/staff, Schuyler Stoller and Aubrie Drechsler, for help in image transfer, and all trial participants and their families.
Footnotes
D.R. was supported by the RSNA Research & Education Foundation’s Research Medical Student Grant and the Gershon, Gardner, Hirsch, Weiss Yale One-Year Sponsored Fellowship award. S.C.B. was supported by the Botnar Research Center for Child Health Postdoctoral Excellence Program (#PEP-2021-1008). M.v.R. received funding from the German Academic Scholarship Foundation. M.S.A. received funding from the American Society of Neuroradiology Fellow Award 2018.
This publication was made possible by KL2 TR001862 (M.S.A.) from the National Center for Advancing Translational Science, components of the National Institutes of Health, and National Institutes of Health Roadmap for Medical Research.
Its contents are solely the responsibility of the authors and do not necessarily represent the official view of the National Institutes of Health.
D. Ramakrishnan and S.C. Brüningk are co-first authors.
The Pacific Pediatric Neuro-Oncology Consortium (PNOC) PNOC-002 was supported by funds from Genentech/Roche, the PNOC Foundation, and the Pediatric Brain Tumor Foundation.
Disclosure forms provided by the authors are available with the full text and PDF of this article at www.ajnr.org.
References
- Received September 25, 2023.
- Accepted after revision December 3, 2023.
- © 2024 by American Journal of Neuroradiology


Jump to section
Related Articles
Cited By...
- No citing articles found.