
Abstract
PURPOSE: The purpose of this study was to examine the relationship between contrast transfer coefficient [Ktrans] and grade in gliomas.
MATERIAL AND METHODS: Median values of Ktrans, CBVT1, and of the 95th percentile (95%) of the distribution (Ktrans [95%] and CBVT1 [95%]) were calculated in 39 patients with glioma. Group comparisons and post hoc pairwise comparisons were performed. The relationship between variables and grade used Spearman rho and canonical discriminant analysis. The separation of high- from low-grade tumors was separately assessed by using Mann-Whitney U tests and logistic regression. Receiver operator curve analysis was performed for high- and low-grade tumors and grade III and grade IV tumors.
RESULTS: There were significant differences between grades for all variables (P < .001). Pairwise comparisons demonstrated significant differences between grades II and III and II and IV for all variables except Ktrans, which did not show significance in the grade II and III comparison, and between III and IV for CBVT1 and CBVT1 (95%; P < .01). All variables correlated with grade (P < .01). Discriminant analysis showed independent relation between both CBVT1 and Ktrans (95%) and grade, and the canonical function produced a total correct classification of 74.4% of cases. Logistic regression analysis for low- versus high-grade tumors showed Ktrans (95%) and CBVT1 to be independent factors (P < .01 and P < .05).
CONCLUSION: There are strong independent relationships between both CBV and Ktrans and histologic grade in gliomas. Both measurements show good discriminative power in distinguishing between low- and high-grade tumors with diagnostic sensitivity and specificity >90%.
Histologic grading of glial cell tumors makes an important contribution to determining optimal therapeutic strategy and estimating prognosis. Unfortunately, these tumors, and particularly those of higher grade are histologically heterogeneous and surgical biopsy can lead to acquisition of unrepresentative samples. This has led to widespread use of image-guided biopsy in an attempt to avoid inappropriate classification (1–7). Targeting of enhancing areas within tumors ensures that biopsy material will represent viable tumor; however, areas of most marked enhancement do not appear to correspond specifically to areas of dedifferentiation and several techniques have been developed in an attempt to allow identification of the most dedifferentiated areas within a tumor as biopsy targets. The identification of correlations between imaging-based parameters and tumor grade has led many groups to examine the feasibility of noninvasive imaging-based tumor grading (2, 3, 6–12). The most promising methods for noninvasive grading to date are based on MR spectroscopy (4, 13) and dynamic contrast-enhanced MR imaging (DCE-MR imaging) (3). Dynamic acquisition of images during contrast enhancement allows calculation of specific descriptive parameters related to local microvasculature characteristics including cerebral blood volume (CBV). The production of parametric maps of CBV is straightforward, and many groups have demonstrated a relationship between CBV and tumor grade (1, 8, 12, 14–18). Furthermore, regional increases in CBV in high-grade glial tumors appear to correlate to areas of histologic dedifferentiation. Despite this, estimation of CBV does not allow accurate classification of tumor grade, though some authors have quoted diagnostic specificities as high as 79% (1–3, 5, 7, 8, 19, 20). The relationship between CBV and grade is intuitive, because pathologic studies demonstrate clear increases in the proportion of blood vessels in higher-grade tumors.
More recently, many groups have described pharmacokinetic analysis techniques to extract other descriptive parameters from DCE-MR imaging data (21–25) that include blood flow (F) and microvascular endothelial permeability surface area product (PS). Evidence from modalities such as xenon-enhanced CT shows a clear relationship between tumor grade and blood flow (26, 27). There is also a theoretical basis for a relationship between endothelial permeability and tumor grade, because high-grade tumors classically express increased levels of the vasoactive cytokine vascular endothelial growth factor (VEGF), which promotes endothelial proliferation and directly increases endothelial permeability. Consequently, high-grade tumors are characterized by a high proportion of immature and hyperpermeable vessels (28–30). In practice, the separate estimation of F and PS is difficult and most techniques attempt to measure the volume transfer coefficient, Ktrans, for passage of contrast agent between the blood and the extravascular extracellular space (EES) (21). The transfer coefficient will be affected by both flow and permeability surface area product, however, because both of these values are expected to increase with increasing tumor grade their effects on measured Ktrans can be confidently predicted to be cumulative. Consequently, measurements of Ktrans might be expected to be related to tumor grade and could potentially provide additional information to measurements of CBV. This has led several authors to examine the relationship between the transfer coefficient and tumor grade (2, 10, 11, 31). The results from these studies are, however, conflicting, with some showing far weaker relationships between Ktrans and tumor grade than for CBV and others showing Ktrans to be strongly related to grade. The reasons for this variability in the results of apparently similar studies have to date been unclear, though there is wide methodologic variation between them. This study represents an attempt to clarify the potential value of CBV and Ktrans measurements for classification of cerebral gliomas by using a well-validated pharmacokinetic modeling technique and an attempt to explain the apparent contradictions in the literature to date.
Materials and Methods
Subjects
Thirty-nine patients with clinically suspected gliomas of varying grades were recruited for this study (mean age, 52.9 years; range, 31–77 years; 29 men and 10 women). All diagnoses were histologically confirmed. All patients gave informed consent. The Central Manchester Healthcare NHS Trust and Salford Royal Hospitals NHS Trust medical ethical committees and the ethical committee of Erasme Hospital approved the study. All patients with high-grade tumors (grades III and IV) were treated with steroids before scanning, but none were receiving any other treatment. The histologic grading and demographic data are shown in Table 1. Following MR imaging, patients underwent surgery either for tumor resection or biopsy. Histologic examination and determination of the grade of tumor biopsy was performed according to criteria set out by the World Health Organization (32).
Patient demographics
MR Imaging
Imaging was performed on 2 identical 1.5T MR systems (Philips Medical Systems, Best, the Netherlands) by using birdcage head coils. Routine pre- and postcontrast clinical imaging was performed according to local protocol. Three precontrast datasets were acquired for baseline T1 calculation by using a 3D T1 fast field echo sequence (TR/TE, 4.2/1.2 ms; field of view, 230 × 230 mm; imaging matrix, 128 × 128; section thickness, 6 mm interpolated to 3 mm; 25 sections) with flip angles of 2°, 10°, and 35°. This was followed by a DCE-MR series at a flip angle of 35°, consisting of 20 volume acquisitions with a temporal spacing of approximately 5 seconds. Gadolinium-based contrast agent (Gd-DTPA-BMA; Omniscan, Amersham Health, Oslo, Norway) was injected as a bolus for 4 seconds at a dose of 0.1 mmol/kg of body weight following acquisition of the ninth image volume.
Image Analysis
All imaging data were transferred from the scanners to an independent workstation (Sun Microsystems, Palo Alto, CA) for analysis. Pixel-by-pixel values of Ktrans and CBV were calculated by using the theoretical approach described by Li et al (33). Analysis was carried out with software written in-house by using IDL (Interactive Data Language; Research Systems, Boulder, CO). A vascular input function was measured from the vertical part of the superior sagittal sinus on the middle section of the scanned volume for every patient dataset. Regions of interest were defined by an experienced radiologist (T.F.P. and S.J.M.) on one of the postcontrast datasets. The regions were drawn on 3 consecutive sections through the middle of the tumor volume. Tumor regions of interest were defined to contain all visually enhancing components of the tumors and specifically excluded coherent large nonenhancing areas.
Statistical Analysis
The analysis generates maps of Ktrans and CBV. These parameters do not exhibit normal distributions, and hence, for statistical analysis, median values were taken. In addition, previous studies have demonstrated potential benefit of measurements that reflect the higher values in the distribution of some variables. We have therefore examined the significance of the value of the 95th percentile (95%) of the distribution for both Ktrans and CBV (Ktrans [95%] and CBV [95%]).
Comparison between grades for each of the 4 parametric variables was performed by using a one-way analysis of variance and intergroup comparisons were performed by using a post hoc test assuming unequal variance between the groups (Tamahane) (34). The correlation between histologic grade and median values for each parametric variable was assessed by using Spearman correlation coefficient. In addition, the correlation between each of the parametric variables was measured by using Pearson correlation coefficient. The ability of the parametric variables to distinguish between the tumor grades was assessed by using a discriminate analysis by using a forward stepwise model. A leave-one-out cross-validation analysis was also performed to estimate the expected efficiency of diagnostic classification in a larger group.
Separate statistical analysis was performed to examine the difference between high- (grade III and grade IV) and low-grade (grade II) tumors. The difference between median values for each of the 4 parametric variables was assessed by using a Mann-Whitney U test, and the ability of each of the variables to distinguish between high- and low-grade tumors was assessed by using a logistic regression analysis. Finally, receiver operator curve (ROC) analysis was performed to quantify the ability of each of the parametric variables and of the optimized canonical discriminate function to distinguish between high- and low-grade tumors and grade III and grade IV tumors.
Results
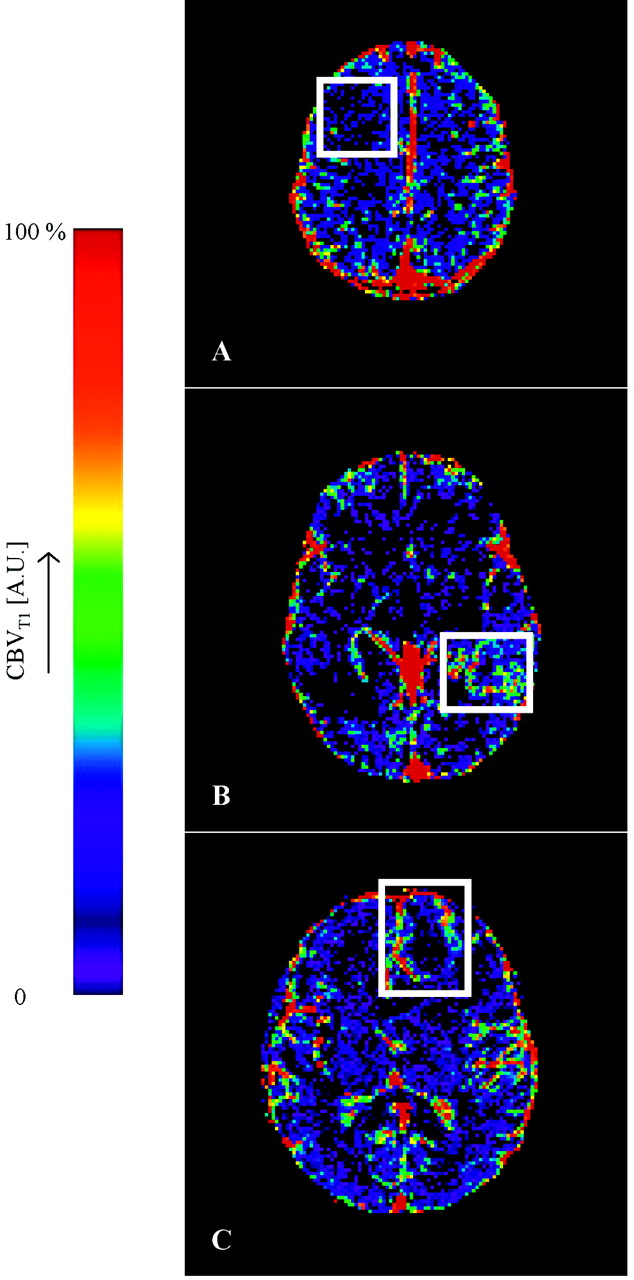
Figures 1 and 2 show a representative selection of parametric brain images showing cross-sections through gliomas of varying histologic grade (II [A], III [B], and IV [C]). Ktrans maps are shown in Fig 1, and corresponding CBV maps are shown in Fig 2. The Ktrans maps show the clear difference between low (II) and high (III and IV) grades and heterogeneity within high grade tumor tissue. Ktrans values within normal brain are 0 or consistent with noise. CBV values in grade II tumor tissue are very similar to normal tissue and are clearly higher and heterogeneous in high-grade tumor tissue. Vasculature in normal brain is evident on the CBV maps, especially the superior sagittal sinus and cerebral arteries. The mean value and SD of the distribution of median values from individual tumors for each of the 4 parametric variables are shown in Tables 2A and -B. There was close correlation between measured values of CBV and Ktrans (r=0.688; P < .001). There were significant group differences between tumor grades for all 4 parametric variables (Ktrans, Ktrans [95%], CBV, and CBV [95%]; P < .001). Pairwise comparisons demonstrated significant differences between grades II and III and between grades II and IV for all variables except Ktrans, which did not show significance in the grade II and III comparison and between grades III and IV for CBV and CBV (95%) (Table 3). There was a significant correlation between grade and the median values of each of the parametric variables (Fig 3, P < .01). The correlation was greatest for Ktrans (95%) (r=0.740; Table 4). Discriminant analysis identified a single significant predictive function (C1):  Median values of Ktrans and CBV (95%) had no independent predictive value. Figure 4 shows the relationship between values of median CBV and Ktrans (95%) for all individual cases. The discriminant variables accounted for 99.7% of the variance in the model (P < .001), and the effective classification accuracy is shown in Table 5 with a total correct classification of 74.4% of cases. The results of cross-validation analysis showed the expected decrease in discriminative accuracy (Table 6).

Representative Ktrans maps from (A) a grade II fibrillary astrocytoma, (B) a grade III anaplastic astrocytoma, and (C) a grade IV glioblastoma multiforme. The white boxes enclose the tumor area in each image. Note that vasculature does not appear in these maps, and Ktrans values in normal brain are insignificant and consistent with noise. The Ktrans values in the grade II tumor (A) are insignificant corresponding to the lack of enhancement with contrast. The high-grade-defining necrotic core is clearly evident in the middle of the tumor in panel C. The heterogeneity of Ktrans is clearly evident in the enhancing tumor portion in panels B and C.

Representative CBV maps from (A) a grade II fibrillary astrocytoma, (B) a grade III anaplastic astrocytoma, and (C) a grade IV glioblastoma multiforme. The white boxes enclose the tumor area in each image. The normal cerebral vasculature is clearly seen on these maps, particularly the superior sagittal sinus and other major vessels. The grade II tumor in panel A homogeneously shows very low blood volume, which is below the measurement accuracy of the technique. The necrotic core is clearly evident in the middle of the tumor in panel C. The heterogeneity of CBV is clearly evident in the enhancing tumor portion in panels B and C and shows very different distributions to those in Fig 1 (A and B).

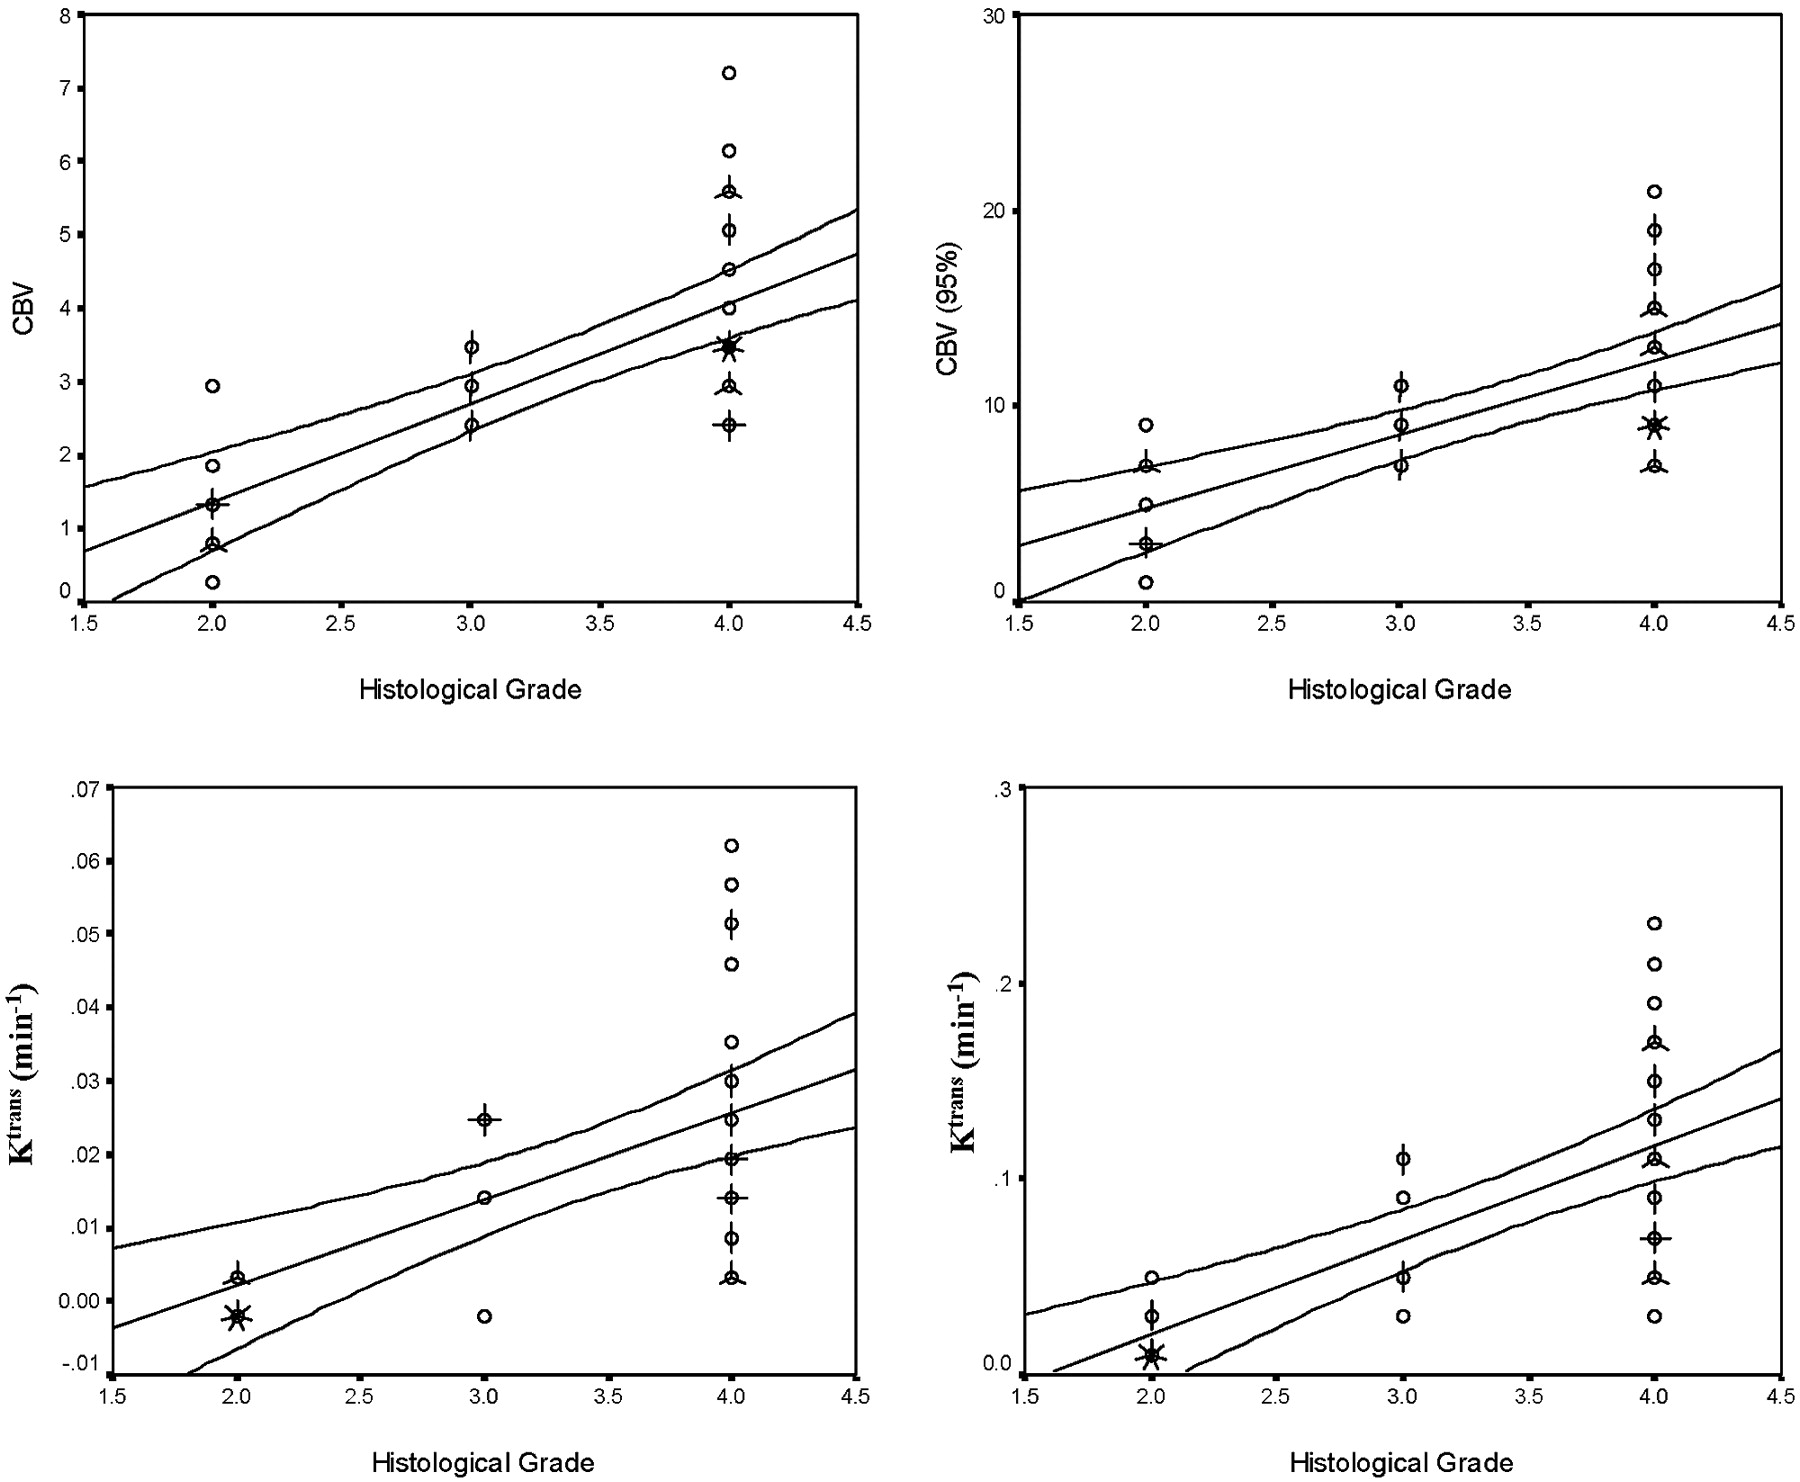
Scattergrams showing the relationships between histologic grade and median values of Ktrans, Ktrans (95%), CBV, and CBV (95%). Individual cases are indicated by circles, multiple cases are represented by the addition of “petals” to the glyph with the number of petals representing the number of cases. Lines indicate the optimal linear regression fit for the data and the 95th percentile confidence limits for the regression fit for the entire dataset. The correlation between grade and the median values of each of the parametric variables is significant (Ktrans, Ktrans [95%], CBV, and CBV [95%]; P < .01).

Scattergram showing the relationship between values of median CBV and Ktrans (95%) for all individual cases. The grade II tumors show lower values of both CBV and Ktrans (95%). Higher values are seen in grade III and IV tumors, but there is a considerable overlap in these distributions.
Means and standard deviations of volume transfer coefficient (Ktrans) and cerebral blood volume (CBV) measurements in gliomas grouped by World Health Organization grade
Post hoc pairwise comparisons between grades (Tamahane test)
Correlation values (Spearman rho) and significance of the correlation between each of the four parameteric variables and grade
Classification results using the canonical discriminate variable
Classification results using canonical discriminate functions derived using a leave-one-out (jackknife) cross-validation analysis
Comparison of High- and Low-Grade Tumors
There were significant differences between high- and low-grade tumors for all 4 parametric variables (Ktrans, Ktrans [95%], CBV, and CBV [95%]; P < .001). Logistic regression analysis showed Ktrans (95%) and CBV to be independently and significantly related to grade (P < .01 and P < .05, respectively).
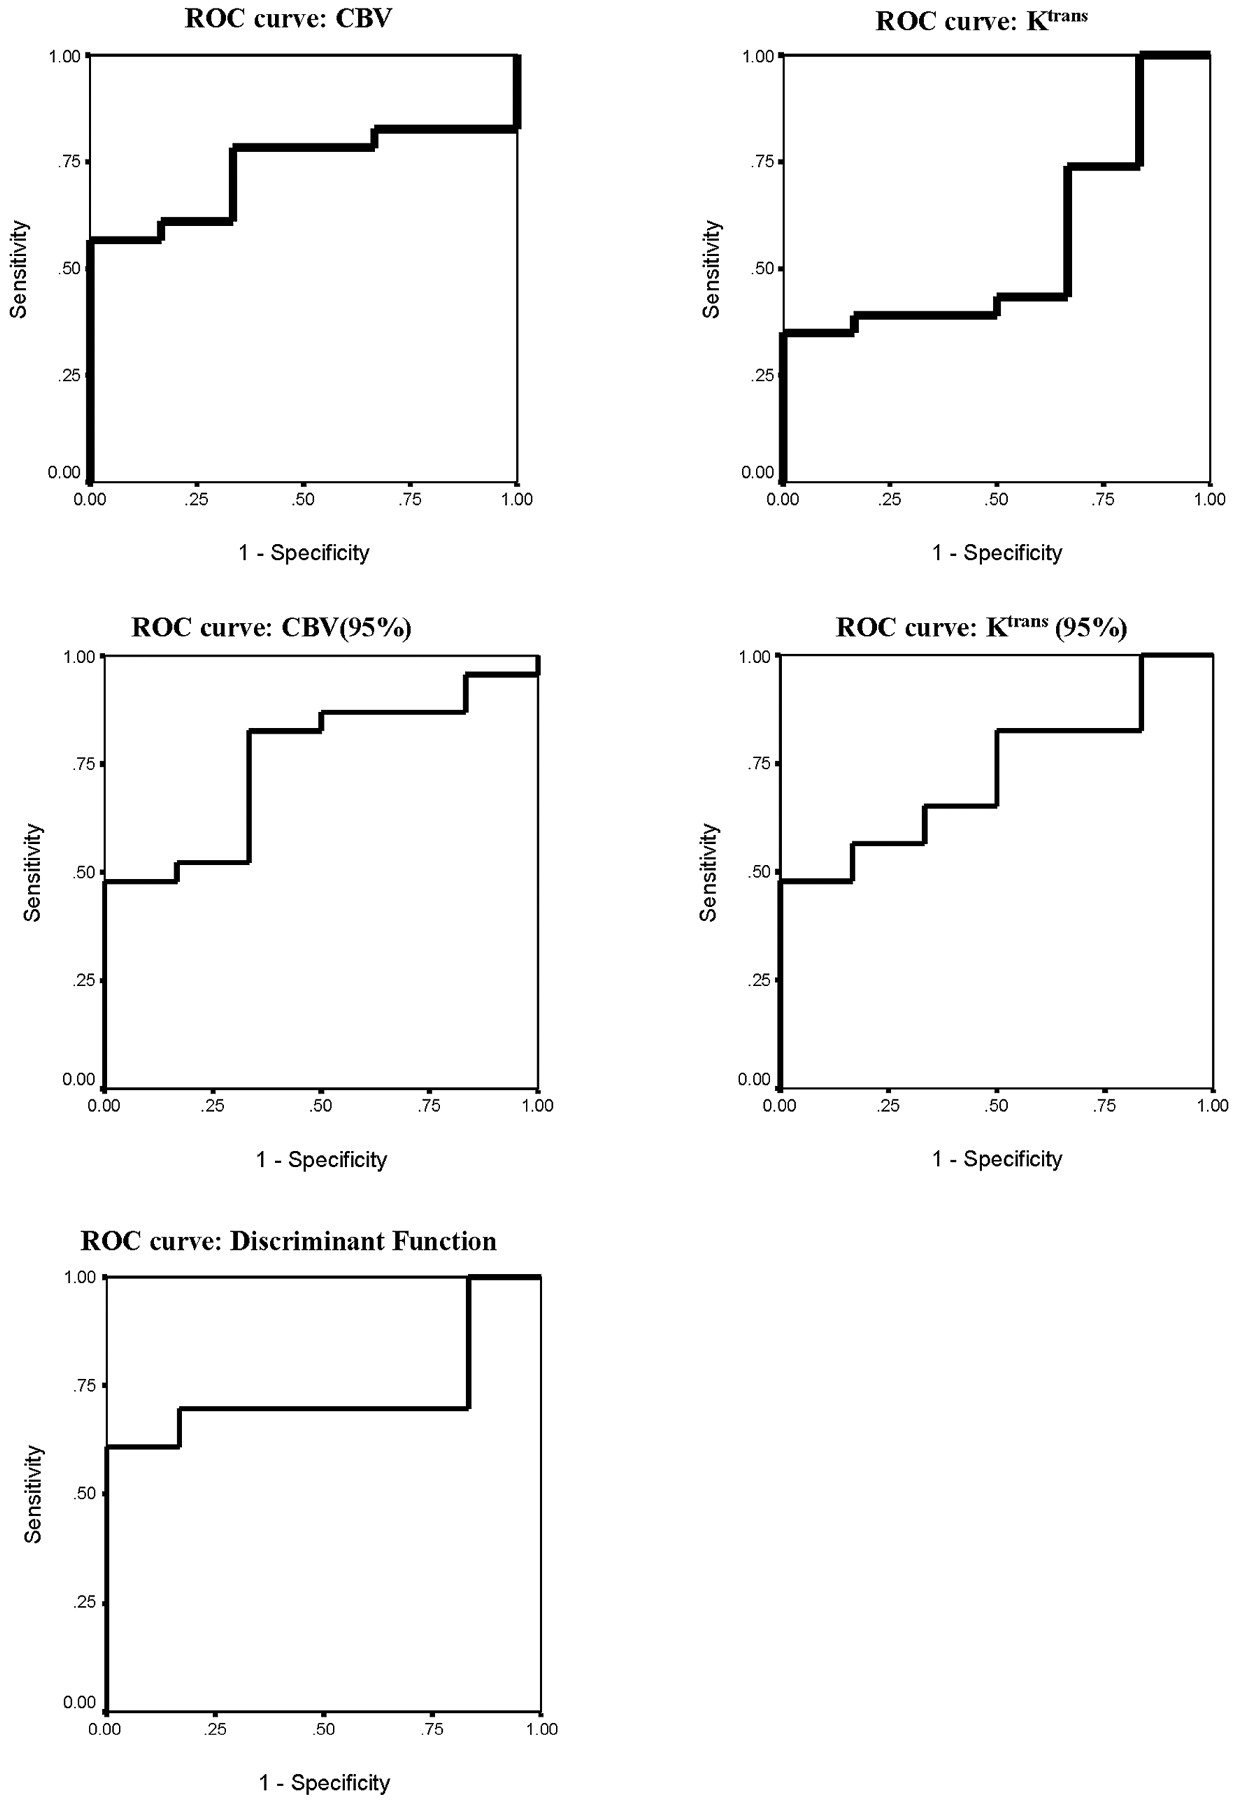
Table 7 and Figs 5 and 6 show the results of ROC analysis. Figure 5 shows the effect of using each individual variable or the discriminant function (C1) in differentiating between high- and low-grade tumors, and Fig 6 shows the effect in differentiating between grade III and IV tumors. The area under the ROC curve for high versus low grade was greatest for the discriminant function (0.993). Within the independent parametric variables the area was highest for Ktrans (95%) (0.986), though similarly high values were seen for Ktrans and CBV (0.979 and 0.966, respectively).

ROC analysis showing effect of using each individual variable or the discriminant function (C1) in differentiating between high- and low-grade tumors. The area under the ROC curve for high- versus low-grade is greatest for the discriminant function (0.993). Within the independent parametric variables the area was highest for Ktrans (95%) (0.986), though similarly high values were seen for Ktrans and CBV (0.979 and 0.966, respectively). (Areas under the ROC curves are shown in Table 7.)

ROC analysis for separation of grade III and IV tumors. Areas under the ROC curves are shown in Table 7.
Results of the receiver operator curve analysis for each variable and for the discriminate function C1 in differentiating between low-grade tumors and grades III IV high-grade tumors
Discussion
Several groups have studied the relationship between contrast transfer coefficient and tumor grade in gliomas by using MR imaging (2, 10, 11, 31). The results of these studies appear contradictory, and careful review demonstrates a wide variation in image acquisition protocols, image analysis techniques, and statistical analysis approaches. It is important to attempt to clarify the causes of these discrepancies, because the potential role, if any, for transfer coefficient measurements in clinical practice remains unclear.
In the current study, we have used a pharmacokinetic model based on the first passage of the contrast bolus described by Li et al (22, 33). The model is based on temporal changes in calculated contrast concentration derived from T1-weighted data and uses a decomposition of the measured data to identify relative contributions from intravascular and extravascular contrast in each pixel. The decomposition step—together with the reduction in the number of fitting variables employed in curve-fitting stages—makes the model highly reproducible and stable to wide variations in signal intensity–to-noise ratio. The reproducibility of the model is further improved by scaling of the observed arterial input function peak to provide a first order correction for variations of signal intensity induced by local flow artifacts. A major significant drawback is the inherent assumption that no backflow of contrast will occur from the EES into the plasma during the first passage of the contrast bolus. This is untrue in tissues with very high endothelial permeability (>0.2 minutes−1), and an underestimation of transfer coefficient values occurs above this approximate threshold (35). In the current study, values of this magnitude were not observed in any individual case, and, therefore, we can reasonably expect the measured values of transfer coefficient and CBV to be representative of true tissue values. The output of the analysis is matched quantitative parametric maps of Ktrans and CBV.
We have chosen to examine all tissues within the enhancing component of the tumor for this study and to examine both the median value of the parametric variables extracted from the tumor and their 95th percentile values. The use of 95th percentile values recognizes the fact that many distributions show a significant skew with a tail to the right side of the distribution (ie, an excess of high values), which presumably represents increases in measured parameters in a small sub-population of pixels. The use of the 95th percentile value helps to identify distributions in which the median value is not significantly changed, but the presence of small numbers of pixels with increased values gives rise to a large skew in the distribution (36).
In this study, we demonstrated close correlation between measurements of CBV and Ktrans. This correlation can be predicted because Ktrans is directly affected not only by endothelial permeability surface area product, but also by blood flow. All parametric variables discriminated between high- and low-grade tumors and logistic regression analysis showed that Ktrans (95%) and CBV were independently related to grade. Optimal differentiation between high- and low-grade tumors was obtained by using a discriminant function, which correctly classified 94.9% of cases. Comparison of values across all tumor grades showed that only CBV and CBV(95%) were significantly different between grades III and IV. Discriminant analysis again showed both Ktrans (95%) and CBV to be significant independent predictors of grade, but classification accuracy was poor.
One potential problem with the current study is that all patients with high-grade tumors were imaged following commencement of steroid therapy, which is intended to stabilize the endothelium and consequently is expected to reduce measured values of Ktrans. In practice, this is impossible to avoid and has also been a potential weakness in other studies because steroid therapy is commonly commenced at diagnosis. The effects of steroid therapy, however, would be predicted to reduce the measured Ktrans and reduce or abolish the strength of the relationship between Ktrans and grade that we have described.
Many studies have demonstrated a relationship between CBV and tumor grade by using susceptibility contrast-enhanced (T2*-weighted) techniques, and, despite variations in methodology, these publications are largely in agreement (3, 5, 7, 8, 12, 19, 20, 23, 31, 36, 37). Previous publications examining the relationship between grade and transfer coefficient have described widely varying findings. The first such study, published in 2000, used a low-temporal-resolution (26 seconds) T1-weighted acquisition (11). The analyses of dynamic data were based on signal intensity changes, and no attempt was made to correct for baseline T1 values or to calculate contrast concentration changes during the study. The regions of interest studied included all of the enhancing tissue within the tumor and found significant differences in permeability between all pairs of grades and a high correlation between grade and permeability (r = 0.76). This study showed no statistical difference of fractional blood volume between grades, though there was a weak correlation (r=0.39). There are 2 significant potential methodologic problems with this analysis technique (11). First, the use of signal intensity variations rather than calculation of contrast concentration changes and, second, the use of very low temporal resolution. The relationship between contrast agent concentration and signal intensity on T1-weighted images is nonlinear (38). This is particularly problematic in areas of very high concentration where the signal intensity will be significantly lower than would be expected with a linear relationship. The form of arterial input function used may have been flawed, because high concentrations are typically seen in large vessels so that the use of signal intensity changes to provide an arterial input function are likely to systematically overestimate the contrast changes taking place in the vascular tree. In addition, contrast agent was administered as a short-lived bolus with a duration shorter than the sampling time of the acquisition sequence. This makes accurate measurement of the peak arterial contrast value impossible and can lead to considerable variation in measured arterial input functions (39). The combination of these effects can be predicted to produce considerable variability, which would seriously affect CBV estimations in an unpredictable manner dependent on the temporal relationship between the first-pass peak of contrast concentration and the sampling interval. This represents a source of large random measurement errors in the estimates of CBV and could explain the lack of correlation between CBV and tumor grade. The expected errors in estimations of transfer coefficient due to this reason would be far smaller so that one would expect that any underlying relationship with grade would be detected. The failure of the study to demonstrate relationships between CBV and tumor grade contradicts a large body of previous work based principally on susceptibility-based techniques that have repeatedly demonstrated such a relationship to exist. It is possible that any genuine contribution from CBV was factored into the transfer coefficient estimate due to the low temporal resolution data acquisition.
The second group to specifically address the relationship between endothelial permeability and grade used a high temporal resolution (1 second) T1-weighted acquisition and analyzed the data by applying a multicompartment pharmacokinetic model to the calculated contrast agent concentration data (2, 40). The analysis included all the tumor tissue, including nonenhancing components, and produced parametric images of the variables. The analysis was based on histogram distribution in individual pixels within the tumor and specific measured values of individual parameters were not presented; however, the authors stated that there was a strong discriminative relationship between estimates of CBV and grade that could be used to classify individual tumors by using arbitrary thresholds. In this study of 24 gliomas, defining any tumor with >5% of voxels with values >5% CBV as grade III and any tumor with >7% of voxels with values >8% CBV as grade IV resulted in 83% of cases being classified correctly. There was, however, no relationship between permeability-related parameters and grade. This may be due to the fact that the model applied to the data was nonstandard and that the form of arterial input function used was flawed, with no evidence of a first-pass peak.
In 2002, Provenzale et al (10) studied 22 patients with glioma by using a T2-weighted dynamic imaging spin-echo sequence with a temporal resolution of 1.5 seconds. The data were analyzed by using a model previously described by Weisskoff (25) to produce parametric maps of transfer coefficient. The data were analyzed by sampling the tumor with multiple regions of interest to find a mean and the highest measurable transfer coefficient value. These authors demonstrated significant differences in transfer coefficient between low- and high-grade tumors with the greatest difference being seen in maximum values (P=.018). This provided a positive predictive value of 90% and a negative predictive value of 75% for a transfer coefficient value of 0.03. The authors did not measure nor comment on blood volume effects. Unfortunately, the accuracy of decomposition of intra- and extravascular contrast agent contributions from T2*-weighted dynamic dataset are related to the extraction rate of contrast agent into the tumor tissue. In the presence of large extraction fractions, the original authors expect the model to be less appropriate (25). The presence of significant T1 contributions to signal intensity represents the worst case scenario where parts of the tumor with highly permeable capillary beds show significant T1-related enhancement during the first passage of the contrast bolus (41). Weisskoff et al suggested that in such cases the use of techniques to minimize T1-related enhancement would be required to more aggressively correct the contrast agent leakage (25). In fact the original description of the technique employed pre-enhancement techniques to reduce T1-related effects and the authors suggested that higher dose pre-enhancement might be needed where contrast extraction fraction was high. In the study by Provenzale et al, no pre-enhancement was used so that T1 effects should be expected and will be proportionately greater in higher-grade tumors where leakage is likely to be higher (41). This would have the effect of reducing apparent values of CBV while increasing measures of Ktrans in high-grade, enhancing, tumors.
The latest study to examine the relationship between microvascular parameters and tumor grade in gliomas was published in 2004 (31). This large study of 73 patients with primary gliomas used a high-temporal-resolution (1 second) T2*-weighted acquisition sequence. CBV estimates were calculated by using standard techniques for T2*-weighted images, which have previously been shown to produce strong correlations between CBV and grade. Estimates of transfer coefficient (Ktrans) were produced by using a standard 2-compartment model applied to the same data. Measurements were extracted from parametric images by using multiple regions of interest targeted at areas of significant enhancement and the highest of 4 measurements was selected. The authors demonstrated significant differences in CBV between all pairs of grades, but differences between Ktrans were found only between grades II and III and grades II and IV. There was a significant correlation between CBV and grade (r=0.817) and a much weaker relationship between Ktrans and grade (r = 0.266). Logistic regression to identify predictors of high- versus low-grade tumors showed only CBV to be significantly predictive. Once again, there are potential methodologic problems associated with the approach taken in this study. The use of T2*-weighted imaging again raises the problem of competing T1-weighted effects in enhancing tissue as were discussed above (41). Once again, no attempt was made to reduce these effects by pre-enhancement or by use of sequences insensitive to T1. Second, the elevation of apparent contrast concentration following the passage of the bolus is attributed entirely to contrast agent leakage and takes no account of the possibility of residual intravascular contrast. In practice, the authors acknowledge that blood flow can be extremely variable and heterogeneous in any given region of a tumor and that Ktrans may be underestimated if extremely slow flow is present such as might be seen in areas of low perfusion pressure or tortuous vessels. We have previously examined the relationship between tumor grade and the early contrast recirculation phase on T2*-weighted images by using a measurement of the integral of contrast concentration in the early recirculation phase to the regional blood volume (36, 41). This relative recirculation parameter shows clear relationship to tumor grade in gliomas with increased skewness of the distribution at higher grade, and we attributed this relationship to retention of contrast within tortuous poorly perfused vessels that are typically seen in high-grade tumors. This raises the possibility that some of the early recirculation phase changes on T2*-weighted acquisitions not only reflect permeability, but also retain intravascular contrast.
Although it is clear that DCE-MR imaging techniques offer considerable promise in clinical practice, there are considerable problems associated with their implementation and interpretation. Estimation of CBV from T2*-weighted images represents an example of a technique that is relatively robust to image acquisition protocol and analysis technique with a large body of published work generally showing good agreement. More complex analysis strategies inevitably involve a series of assumptions relating to the cause of observed signal intensity changes and the underlying physiologic mechanisms that control contrast distribution and signal intensity formation. The studies described here show quite disparate results almost undoubtedly as a result of variations in methodology. There seems little doubt that there is a strong relationship between CBV and tumor grade in gliomas, because there is a large published body of work derived from both T2*- and T1-weighted data (5–8, 19, 42–44). These studies use direct measurement of CBV by integrating the contrast concentration time course curve, and this same method was used with similar results in the study of Law et al described above (31). The current study and the work of Ludeman et al (2, 40) used pharmacokinetic modeling of T1-weighted data and were also able to demonstrate this relationship. The relationship between Ktrans and grade remains less clear. The studies of Ludemann et al (2, 40) failed to demonstrate any relationship between Ktrans and grade, and the study of Law et al (31) showed only a weak relationship; however, both the current study and the study described Provenzale et al (10) identified Ktrans as a significant discriminator between high- and low-grade gliomas. Each of the imaging and analysis techniques employed in these previous studies is associated with specific potential disadvantages. This is also true of the technique we have used, which is known to underestimate Ktrans where the contrast extraction fraction is high. The method has, however, been tested extensively both by establishment of reproducibility coefficients and by Monte Carlo modeling to identify the magnitude of errors induced by the use of low signal intensity–to-noise data and by the assumptions in the modeling itself (22, 33, 35). The studies suggest that within the measured range of Ktrans identified in the current study the model can be expected to be accurate and reproducible. The technique also offers significant advantages because data acquisition can be performed in less than a minute and can be used in conjunction with a breath-hold technique (45).
In conclusion, we have demonstrated strong relationships between both CBV and Ktrans and histologic grade in gliomas. Either measurement, or a combination of the 2, show good discriminative power in distinguishing between low- and high-grade tumors with diagnostic sensitivity and specificity >90%. The identification of grade III and grade IV tumors is relatively poor, with diagnostic sensitivity of only 68% and specificity of 62%. We have also clarified the causes of apparent discrepancies between previous studies by a careful review of their experimental approaches. This study indicates that Ktrans provides important and independent information concerning tumor biology and microvascular structure that supports the continued development and use of these more complex analysis protocols.
Footnotes
Portions of this article were presented at the 89th annual meeting of the Radiological Society of North America, November 30–December 5, 2003, Chicago.
References
- Received December 19, 2004.
- Accepted after revision May 9, 2005.
- Copyright © American Society of Neuroradiology
In this issue


Jump to section
Related Articles
Cited By...
- Automated Processing of Dynamic Contrast-Enhanced MRI: Correlation of Advanced Pharmacokinetic Metrics with Tumor Grade in Pediatric Brain Tumors
- Mitotic Activity in Glioblastoma Correlates with Estimated Extravascular Extracellular Space Derived from Dynamic Contrast-Enhanced MR Imaging
- Dynamic Contrast-Enhanced MR Imaging in Head and Neck Cancer: Techniques and Clinical Applications
- Comparison of the Diagnostic Accuracy of DSC- and Dynamic Contrast-Enhanced MRI in the Preoperative Grading of Astrocytomas
- Pixel-by-Pixel Comparison of Volume Transfer Constant and Estimates of Cerebral Blood Volume from Dynamic Contrast-Enhanced and Dynamic Susceptibility Contrast-Enhanced MR Imaging in High-Grade Gliomas
- Glioma: Application of Histogram Analysis of Pharmacokinetic Parameters from T1-Weighted Dynamic Contrast-Enhanced MR Imaging to Tumor Grading
- Diagnostic Accuracy of Dynamic Contrast-Enhanced MR Imaging Using a Phase-Derived Vascular Input Function in the Preoperative Grading of Gliomas
- Imaging biomarkers of angiogenesis and the microvascular environment in cerebral tumours
- Biology, genetics and imaging of glial cell tumours
- Multimodality Assessment of Brain Tumors and Tumor Recurrence
- Enhancing Fraction in Glioma and Its Relationship to the Tumoral Vascular Microenvironment: A Dynamic Contrast-Enhanced MR Imaging Study
- Enhancing Fraction Predicts Clinical Outcome following First-Line Chemotherapy in Patients with Epithelial Ovarian Carcinoma
- Imaging Tumor Vascular Heterogeneity and Angiogenesis using Dynamic Contrast-Enhanced Magnetic Resonance Imaging