
Abstract
BACKGROUND AND PURPOSE: Because of their invasive nature, high-grade glial tumors are uniformly fatal. The purpose of this study was to quantify MR imaging-occult, glial tumor infiltration beyond its radiologic margin through its consequent neuronal cell damage, assessed by the global concentration decline of the neuronal marker N-acetylaspartate (NAA).
METHODS: Seventeen patients (10 men; median age, 39 years; age range, 23–79 years) with radiologically suspected (later pathologically confirmed) supratentorial glial neoplasms, and 17 age- and sex-matched controls were studied. Their whole-brain NAA (WBNAA) amounts were obtained with proton MR spectroscopy: for patients on the day of surgery (n = 17), 1 day postsurgery (n = 15), and once for each control. To convert into concentrations, suitable for intersubject comparison, patients’ global NAA amounts were divided by their brain volumes segmented from MR imaging. Least squares regression was used to analyze the data.
RESULTS: Pre- and postoperative WBNAA (mean ± SD) of 9.2 ± 2.1 and 9.7 ± 1.8 mmol/L, respectively, in patients were indistinguishable (P = .369) but significantly lower than in controls (12.5 ± 1.4 mmol/L). Mean resected tumor size (n = 15) was ∼3% of total brain volume.
CONCLUSION: The average 26% WBNAA deficit in the patients, which persisted following surgical resection, cannot be explained merely by depletion within the ∼3% MR imaging-visible tumor volume or an age-dependent effect. Although there could be several possible causes of such widespread decline—perineuronal satellitosis, neuronal deafferentation, Wallerian and retrograde degeneration, vasogenic edema, functional diaschisis, secondary vascular changes—most are a direct or indirect reflection of extensive, MR imaging-occult, microscopic tumor cell infiltration, diffusely throughout the otherwise “normal-appearing” brain.
High-grade glial tumors (WHO grades III and IV) are uniformly fatal malignancies affecting approximately 10,000 new patients in the United States annually (1, 2). Advances in diagnosis (eg, CT, positron-emission tomograph, MR imaging) and therapy (eg, stereotaxis, radiation therapy, and chemotherapy) during the past 30 years have only marginally improved these patients’ dire prognosis of <2 years’ mean life expectancy from diagnosis. The physical morbidity and emotional challenge caused by the tumors, as well as the high cost of treatment—>$500,000 per patient—underscore the importance of treatment effectiveness and individual outcome prediction (1).
A likely reason for treatment failure is the invasive nature of these neoplasms, which leads ultimately to recurrence despite optimal surgical and adjuvant therapy (3–6). Unfortunately, assessing the degree of this infiltration, which could potentially guide management of the disease, is difficult with current diagnostic tools (7), including thallium single-photon emission tomography (SPECT), perfusion MR imaging, and localized proton MR spectroscopy (1H-MR spectroscopy; 8–17). The present study tests the hypothesis that tumor invasion can be assessed through the neuronal cell damage in its path, as demonstrated in Fig 1, by measuring the global decline of the neuronal marker N-acetylaspartate (NAA; 18, 19), obtained with whole-brain 1H-MR spectroscopy (20–22), in newly diagnosed, untreated glial tumor patients relative to their age- and sex-matched controls.

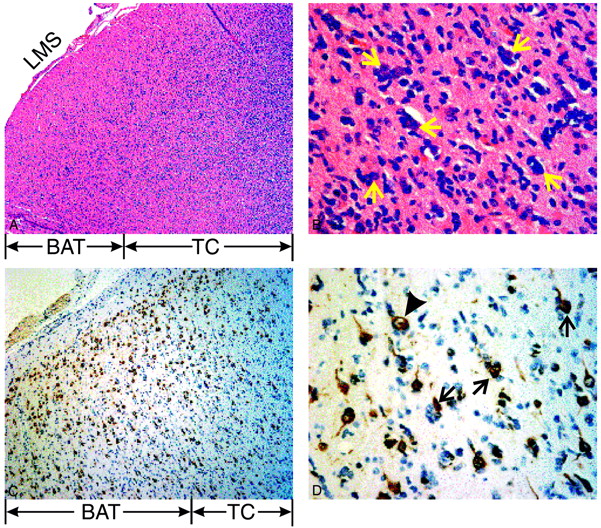
Histopathology of the invasive edge of the glioblastoma multiforme from patient 12 in the Table.
Top left, A, Low power, ×50, hematoxylin and eosin stain depicting tumor core (TC) and brain adjacent to tumor (BAT). Note the high cellularity of the core in the white matter, with invading cells spreading as far as the leptomeningeal space (LMS).
Top right, B, High power, ×400, of the BAT emphasizing perineuronal satellitosis—glioma cells around neuronal cell bodies (arrows).
Bottom left, C, Medium power, ×100, with a monoclonal antibody (NeuN) staining neurons.
Bottom right, D, High power, ×400, view of C highlighting immunoreactive neurons (arrows) surrounded by infiltrating tumor cells. These vacuolated neurons appear unhealthy, and therefore, are likely to contain less NAA. A healthy neuron is indicated for comparison (arrowhead).
Methods
Human Subjects
Seventeen consecutive patients (10 male) of median age 39 years (range, 23–79 years) with radiologically suspected, untreated, supratentorial glial tumors and 17 age- and sex-matched controls (median age, 39 years; range, 25–76 years) were recruited. Patients underwent preoperative MR imaging as part of their stereotactic surgical planning and another MR imaging within 24 hours of surgery. Controls were scanned once. Tumors were resected in 15 cases and biopsied in the other 2 for histologic confirmation of the suspected diagnosis. Age, sex, and tumor grade for each patient are compiled in the Table. All subjects gave institutional review board–approved written consent.
Details of study participants
MR Imaging: Brain Volume, VB, Segmentation
Each subject’s brain volume, VB, was obtained from his or her T1-weighted sagittal magnetization-preparation rapid gradient echo (TE/TR/TI, 7.0/14.7/300 ms; 128 sections, each 1.5 mm thick; 256 × 256 matrix; 210 × 210 mm2 field of view) images by using the MIDAS package (23). Specifically, a “seed” region was placed in the periventricular white matter. Following selection of all pixels at or above the gray matter signal intensity, a brain mask was constructed in 3 steps: (1) morphologic erosion; (2) recursive region growth, which retains pixels connected to the “seed” region; and (3) morphologic inflation to reverse the effect of erosion. Next, the brain masks were truncated at the foramen magnum to incorporate the brain stem and cerebellum but not the cord. Finally, tumor beds, including pixels below gray matter signal intensity, were incorporated in the presurgical masks while resection cavities were excluded from the postsurgical masks. VB was calculated from the mask by multiplying the number of pixels therein by their volume. Examples of CSF/parenchyma segmentation performance are shown in Figs 2A and -B.

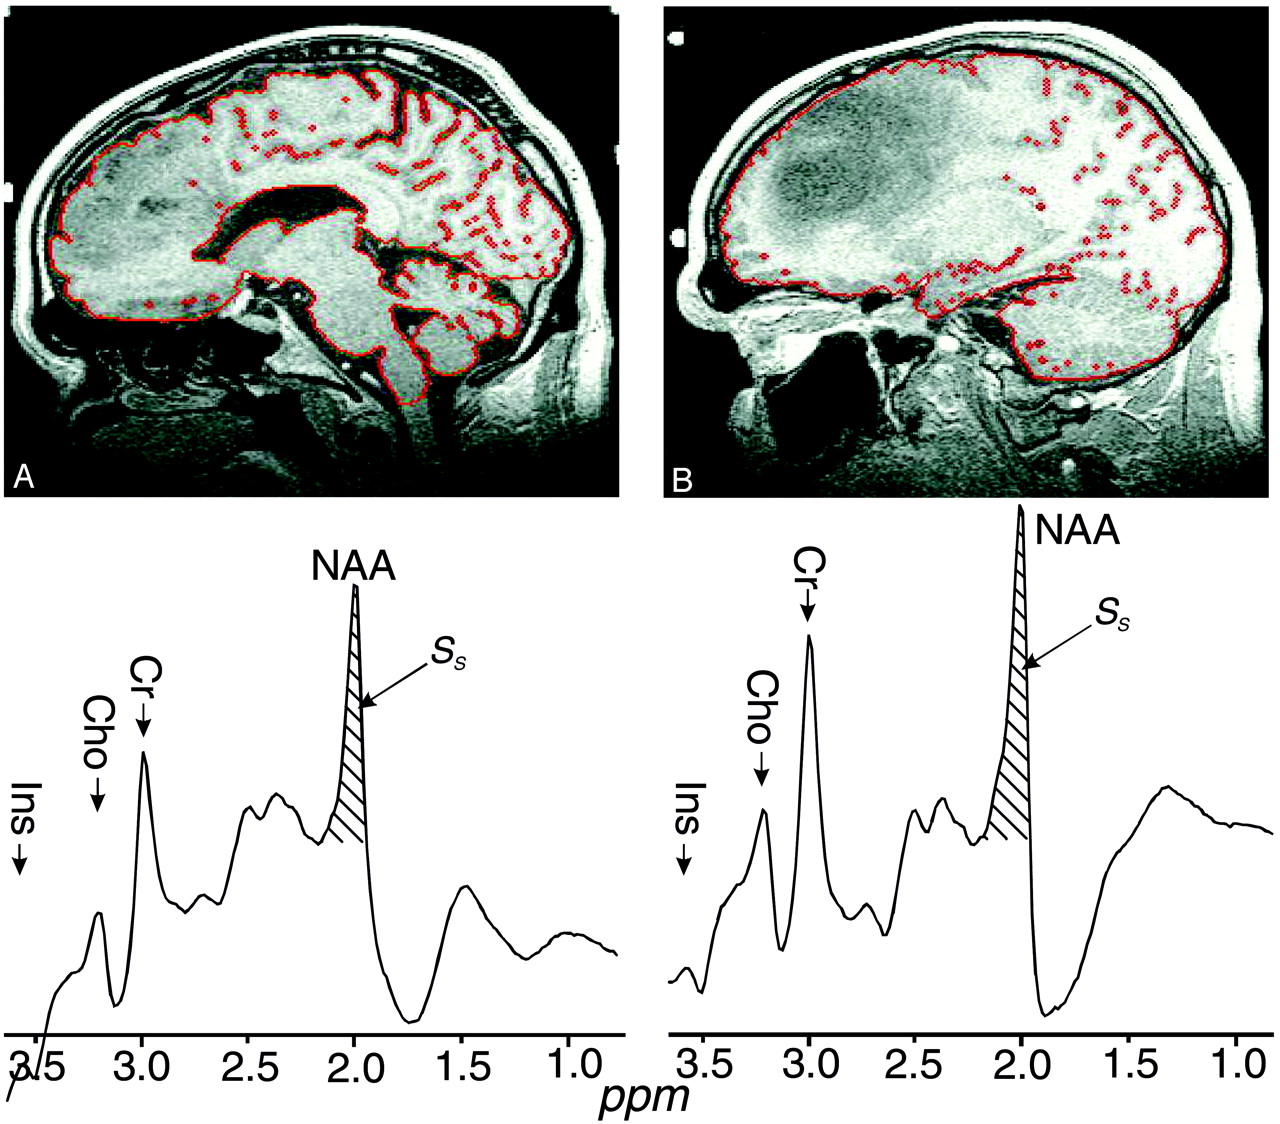
Top, A and B, Segmented preoperative T1-weighted sagittal section for 2 patients, 15 and 5 in the Table, respectively. The red sulci and ventricle outline is the output of the tissue/CSF segmentation process. Patient A had a 41-cm3 grade III tumor, 3.0% of his brain volume, and 37% WBNAA deficit. Patient B had a 93-cm3 grade II tumor, 6.2% of his brain volume, but only half the WBNAA decline (∼20%).
Bottom, A′ and B′, Corresponding whole-head 1H-MR spectroscopy. The hatched regions indicate the peak-areas used to obtain QNAA of Equation (1). Note the overall similarity, indicating cross-sectional reproducibility, and good lipid suppression. Also note that, because localization relies on knowledge that NAA is found only in neuronal cells, it cannot quantify the brain’s contribution to metabolites also present in other tissue types (eg, choline, creatine, and so forth).
MR Spectroscopy: Whole-Brain NAA (WBNAA) Quantification
The amount of WBNAA, QNAA, was measured in a 1.5T clinical imager. Shimming, yielding consistent 15 ± 4 Hz whole-head water line width, was followed by nonlocalizing (ie, whole-head) TE/TI/TR = 0/940/10,000 ms 1H-MR spectroscopy (20). Quantification was done against a reference 3-L sphere of 1.5 × 10⁻² mol NAA in water. Subject and reference NAA peaks, SS and SR, were integrated, as shown in Figs 2A′ and -B′, and QNAA obtained as (24),  1 VR180° and VS180° are the transmitter voltages into 50 ohm for nonselective 1 ms 180° inversion pulses on the reference and subject, respectively, reflecting relative coil loading. Whereas the sequence yields a complete, nonlocalized, whole-head 1H spectrum (cf. Figs 2A′ and -B′), whole-brain localization relies on the fact that NAA is exclusive to neuronal cells and thus the brain (18, 19). On the other hand, the brain’s specific contribution to signals of other metabolites—eg, choline and creatine—cannot be discerned because they are found in other tissues (eg, fat, muscle).
Finally, to account for natural variations in human head sizes, the specific concentration,  2 which is independent of brain size (ie, suitable for cross-sectional comparison), was used. Intra- and intersubject variability of WBNAA measurement was shown to be better than ±6% (20).
Statistical Analyses
Least squares regression was performed to compare the WBNAA of the controls with pre- and postoperative WBNAA of patients and to compare presurgical WBNAA in patients with low (I–II) and high (III–IV) grade tumors. Mixed model least squares regression was used to compare the pre- and postsurgical WBNAA. For each analysis, the dependent variable comprised the WBNAA measures being compared and the model included the nature of the measures (eg, from control subject versus presurgical patient) as a fixed classification factor. The model also included subject age and sex as covariates; the type 1 and type 3 P values associated with the nature of the WBNAA measures were used to make the WBNAA comparisons without and with adjustment for the effects of the covariates, respectively. For the mixed model analysis, the covariance structure was modeled by assuming observations to be correlated or independent when derived for the same subject or different subjects, respectively. All statistical computations were carried out by using SAS System for Windows software, version 9.0 (SAS Institute, Cary, NC), and results were declared statistically significant at the 2-sided 5% comparison-wise significance level (ie, P < .05).
Results
Individual controls’ and patients’ pre- and postsurgical WBNAA are compiled in the Table. WBNAA in controls (n = 17) was 12.5 ± 1.4 mmol/L (mean ± SD), compared with 9.2 ± 2.1 mmol/L presurgery (n = 17) and 9.7 ± 1.8 mmol/L postsurgery (n = 14) in patients, as shown in Fig 3. Average resected tumor size (n = 15), calculated from the MR imaging as the difference between pre- and postsurgical brain volumes, was 40.9 cm3 (±20 cm3), or ∼3.2% (±1.5%) of mean presurgical brain volume. Histologically, 9 of the 17 tumors were low-grade (one grade I, 8 Grade II) and 8 were high-grade (4 each grades III and IV). Three patients (one each for grades II, III, and IV) were not included in the postsurgical analysis because either imaging was not clinically indicated following biopsy (n = 2) or the signal intensity quality was too poor for analysis because of excessive motion (n = 1).

First, 2nd (median), and 3rd quartiles (box) and ±95% (whiskers) of WBNAA in the 17 controls, patients day of surgery (n = 17) and 1 day postsurgery (n = 14). Note that pre- and postsurgical WBNAA are significantly different from the controls, but not each other.
Adjusted for differences attributable to age and sex, the WBNAA of controls was significantly higher than that of patients both pre- and postsurgery (P < .0005). For patients, pre- and postsurgical WBNAA were statistically indistinguishable (P = .369) with a 95% confidence interval (CI) for mean change ranging from −0.4 to +1.1 mmol/L, as shown in Fig 3.
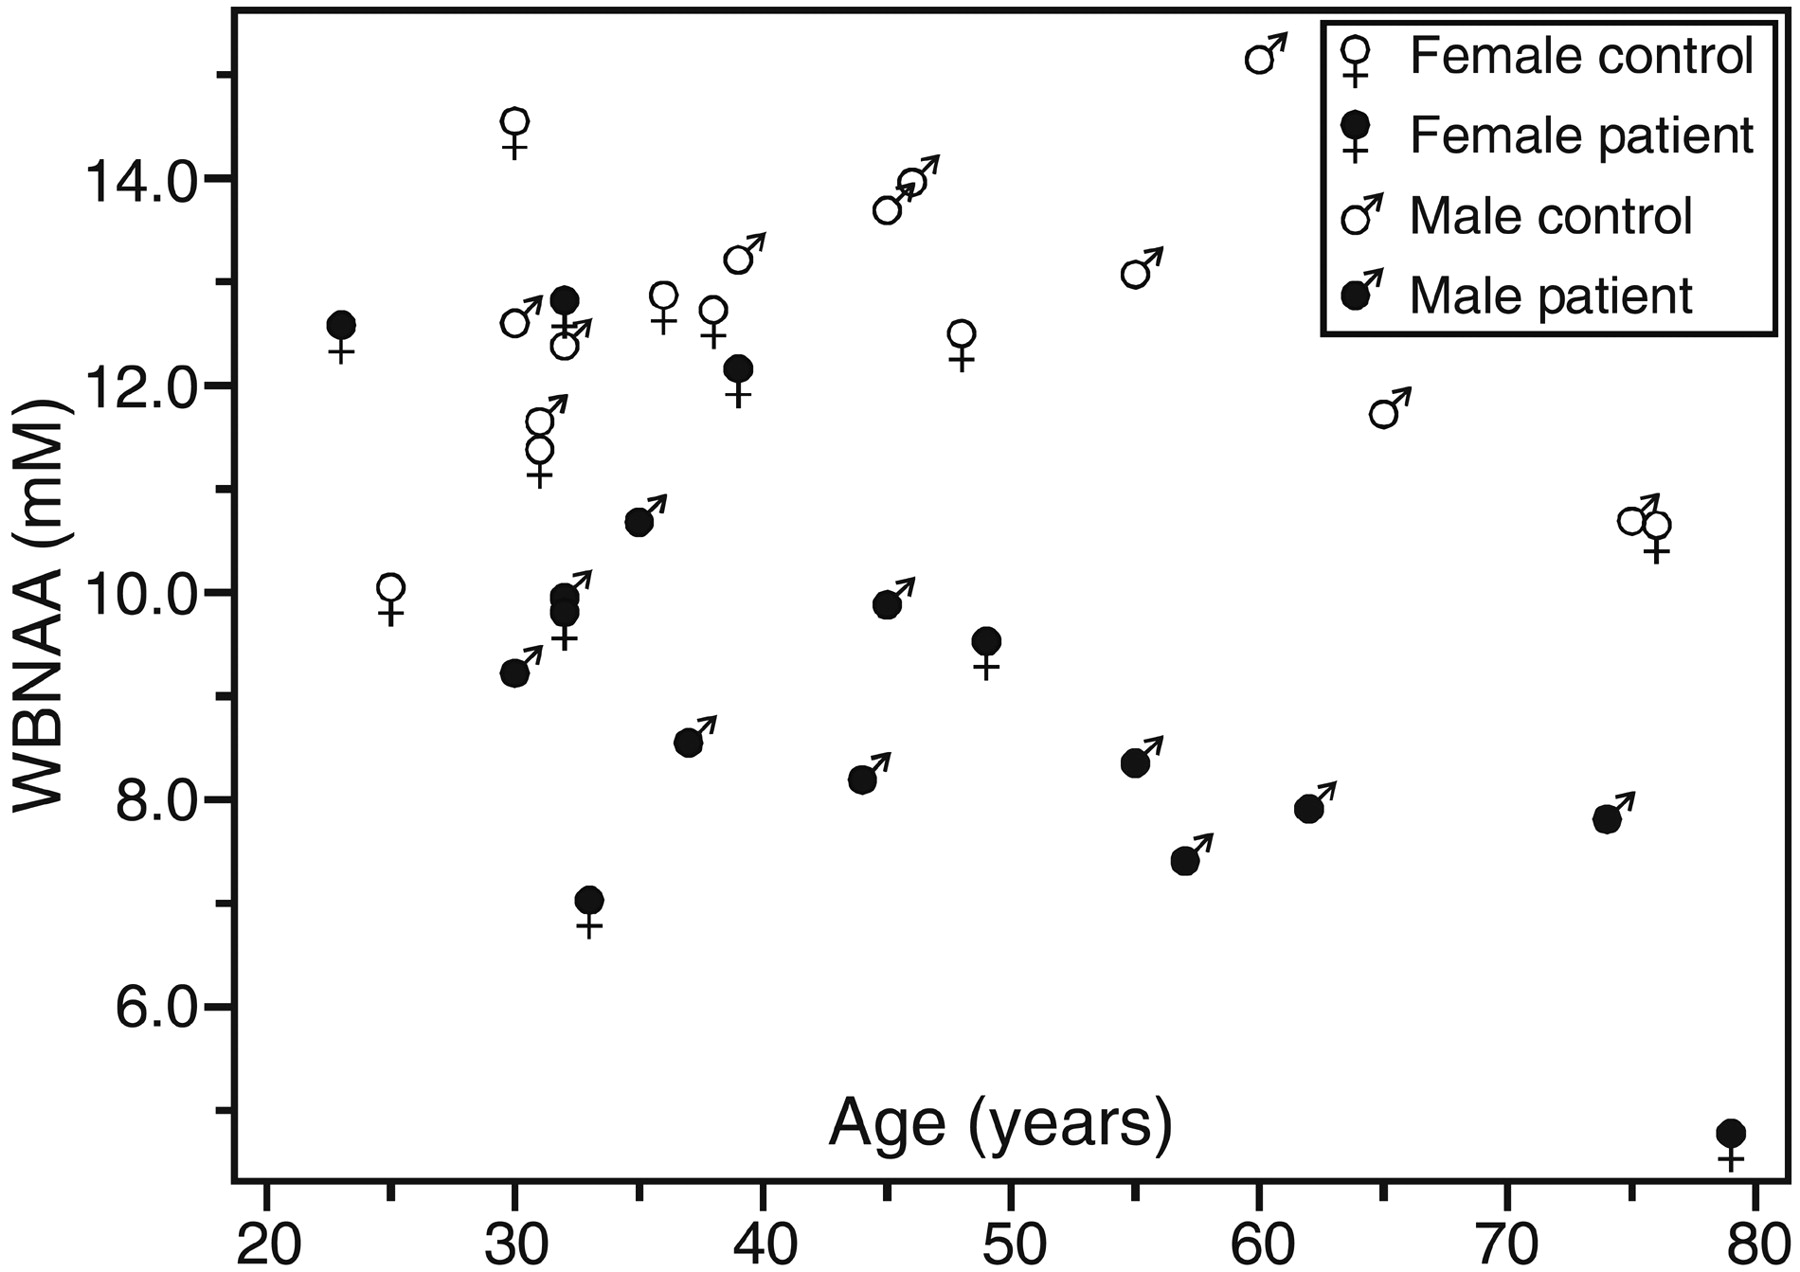
Presurgical WBNAA analysis revealed a significant interaction with age in the patients, as shown in Fig 4. Specifically, WBNAA in the 9 patients <40 years of age, 10.3 ± 2.0 mmol/L, was significantly lower than their control group (12.4 ± 1.3 mmol/L; P = .017). This deficit was even greater in the 8 patients >40 years of age, 8.0 ± 1.5 mmol/L versus 12.7 ± 1.6 mmol/L in their controls (P < .0005).

Scatter plot of WBNAA versus age for the patients before surgery and their age- and sex-matched controls. Note that the patients’ WBNAA deficit is significant (P < .0005), even after taking into account age (P = .007) and sex effects (P > .05).
Preoperative WBNAA was lower in patients with high-grade (8.3 ± 1.8 mmol/L) than in those with low-grade (10.0 ± 2.1 mmol/L) tumors, as demonstrated in Fig 5. The trend of this difference toward significance (P = .086; 95% CI of mean difference ranging from −0.3 to +3.8 mmol/L) disappeared when the results were adjusted for the effect of age.

First, 2nd (median), and 3rd quartiles (box) and ±95% (whiskers) of preoperative WBNAA in the 9 patients with low-grade tumors compared with their matched controls (left) and 8 patients with high-grade tumors compared with their matched controls (right). Note preoperative WBNAA was lower in patients with high-grade (8.3 ± 1.8 mmol/L) than in those with low-grade (10.0 ± 2.1 mmol/L) tumors.
Discussion
High-grade glial tumors appear as contrast enhanced regions on conventional MR imaging, reflecting a compromised blood-brain barrier (BBB), surrounded by T1 and T2 abnormalities representing edema and infiltrated viable brain. Because the solid tumor itself is devoid of viable brain, its surgical resection typically causes no major neurologic deficits (25–28). This consideration usually precludes removal of the enveloping regions of signal intensity abnormality (25, 29). Consequently, despite adjuvant chemotherapy with or without conformal radiation, the disease always recurs either (1) at the surgical margin, because of incomplete resection (4–6), or (2) remotely, presumably from cells that have migrated to distal regions of intact BBB (ie, appear normal on conventional imaging) and are immune to chemotherapy as a result (3–6, 30). Indeed, one postmortem study has found cells from a pontine glioma as far away as the conus medullaris (31).
The central cause of poor prognosis in these patients, therefore, is diffuse infiltration. Current state of the art techniques, such as thallium SPECT (8–10), perfusion MR imaging (11–15), and localized 1H-MR spectroscopy (16, 17), are limited in their ability to detect infiltration into “normal-appearing” brain distal to the primary tumor due to intact BBBs, limited neovascularization, and insufficient metabolically active tumor volumes (20). This obstacle, however, can potentially be overcome through a metabolic assessment of the collective damage infiltrating tumor cells impart on the neurons in their path. This injury occurs through perineuronal satellitosis, shown in Fig 1, release of neurotoxic cytokines and excitotoxic neurotransmitters, ischemia resulting from invaded vasculature, and infiltration along white matter tracts (32–35). Because these processes are diffuse and widespread beyond the tumor mass, extensive (ideally, complete) CNS coverage, provided by the WBNAA technique, is needed to quantify their true extent. Such an assessment could potentially facilitate the formulation of clinical decisions by further elucidating the benefits and risks/costs of aggressive management.
Before surgery, our patients already exhibited an average of 26% lower WBNAA than their controls. Although the degree of NAA loss may seem relatively large in light of the mild to moderate neurologic deficits that typically precede diagnosis, similar declines have been reported in multiple sclerosis without major changes in clinical status (36). Because (1) these patients suffered no other known neurologic insult and (2) the average tumor was small, on average only ∼3% of brain volume, the mechanism that led to such profound NAA decline must have predominantly occurred outside the MR imaging-visible lesion. Because NAA is found only in neurons and their processes, this extent of the WBNAA deficit, therefore, indicates widespread damage. This damage may arise from various processes—eg, perineuronal satellitosis (compare Fig 1), neuronal deafferentation, Wallerian and retrograde degeneration, vasogenic edema, functional diaschisis, secondary vascular changes, and so forth. Most of these processes, however, reflect either direct or indirect consequences of the widespread, diffuse infiltration of malignant cells into normal-appearing tissue (3–6, 30, 31, 37).
Additional indications that the occult diffuse infiltration caused the WBNAA decline and not only, for example, tissue destruction in the lesion, are provided by the postsurgical analysis. First, the significant 22% mean WBNAA loss that persisted following resection indicates that the loss originated mostly outside the resected lesions (which averaged only ∼3% of total brain volume). Second, because the NAA in the tumor is nearly depleted (16, 17), excision should increase the WBNAA because QNAA remains the same while VB decreases (Equation [2]). Accordingly, the cohort’s mean WBNAA was greater post- than presurgery by ∼4%, commensurate with the average excised volume, as shown in Fig 3.
If invasion was the primary mechanism leading to neuronal, and therefore WBNAA, loss, it stands to reason that less-invasive tumors would lead to the smallest WBNAA loss. Indeed, this assertion is supported by the histology of patient 1 in the Table. This 23-year-old woman had a pathologic diagnosis of dysembryoplastic neuroepithelial tumor, a known noninvasive neoplasm that is theoretically curable by surgery alone (38). Therefore, the fact that her WBNAA was indistinguishable from the controls (compare Fig 4) is consistent with this noninvasive behavior. Because her tumor size was only 32 cm3, <3% of brain volume, any NAA loss restricted to its visible boundaries would have been below the ±6% detection threshold of the technique (20).
The relationships of WBNAA with age, as shown in Fig 4, and tumor grade suggest that older patients with higher-grade tumors experience a larger loss of WBNAA than younger patients with lower-grade lesions. This is not surprising, because it is well known that advanced age is a predictor of poorer outcome and higher tumor grade (39, 40), consistent with our cohort, where all but one patient <45 years of age had (lower) grades I–II tumors, whereas those older had higher grades—III and IV. Thus, age and tumor grade are potentially confounding variables in any examination of our patients. Nevertheless, statistical analysis showed that, even with age as a covariate, WBNAA deficits were significant for the entire patient group. Additional evidence that the observed WBNAA losses in older patients are, at least in part, due to invasion and not just to an age effect is the decline suffered by the younger (<40 years) half of the cohort. They also exhibited significant deficits compared with their controls (compare Fig 4), even though their tumors were of lower (less-invasive) grades and their residual brain plasticity was presumably higher. Sex, on the other hand, appeared to play no role in WBNAA deficits.
The invasion argument above is corroborated further by comparing patient 5 with patient 15 in the Table. Patient 15’s grade III anaplastic oligodendroglioma (Fig 2A, -A′) was 41 cm3 (3.0% of brain volume) and led to a ∼37% WBNAA decline. In contrast, patient 5 (Fig 2B, -B′) suffered only half (∼20%) the WBNAA loss of patient 15 despite a grade II ganglioglioneurocytoma more than twice as large, 93 cm3 (6.2% of brain volume). If the loss was not due to diffuse infiltration, it would have been reasonable to expect the changes in WBNAA to be proportional to the tumor volume rather than its grade.
As demonstrated in Fig 5, the results of these 2 patients can be generalized with a group comparison of patients with low- and high-grade tumors. Patients with high-grade, and presumably more invasive, tumors exhibited a preoperative WBNAA deficit nearly twice that of patients with low-grade tumors. This difference, which trended toward significance, can also be attributed to an age effect described above as our cohort was evenly divided between young patients with grade I and II tumors and older patients with grades III and IV tumors.
Though infiltration is diffuse, one would expect that most tumor cells would be found in the peritumoral region and the resultant neuronal injury should progressively decrease as an inverse function of distance from the tumor. Indeed, this behavior has been observed and reported in several previous studies in gliomas when using 3D localized multivoxel 1H-MR spectroscopy (41–43). Their observations corroborate the conclusions drawn from the current WBNAA analysis. Although the WBNAA deficit found here may represent, at least in part, a reversible metabolic dysfunction, it is highly unlikely to be true for most of it, in light of the chronic, unrelenting nature of gliomas. Furthermore, note that the WBNAA deficit persisted following surgical resection of the bulk lesion with even a slight 4% recovery, consistent with removal of tissue relatively deplete of NAA, as described above. To attribute the loss to a reversible dysfunction, one would expect a more substantial WBNAA rebound following elimination of the prime insult.
The main limitation of the WBNAA assessment is its lack of spatial specificity—ie, where the losses occurred and what mechanism caused them (20, 21). Unfortunately, there is no definitive in vivo “gold standard” method to establish either. The preponderance of evidence, however, including the relationship of WBNAA with age and tumor grade, suggests that tumor infiltration is a likely culprit. This conclusion is supported by histopathologic examination of the infiltrated brain adjacent to tumor, the glioblastoma multiforme from patient 12 in the Table, which demonstrates significant quantifiable neuronal damage, as shown in Fig 1. Furthermore, though some NAA signal intensity dropout could also occur at the tumor margin, due, for example, to susceptibility effects from hemosiderin deposition, this effect on WBNAA, however, would be minimal because these tumors were small (∼3% of brain volume) and NAA loss was not proportional to tumor volume (compare Fig 2).
In summary, WBNAA could potentially provide valuable noninvasive information on the global amount of neuronal damage currently unavailable to the neurooncology team and would complement histopathologic findings, which sometimes does not accurately reflect true invasiveness, partially because of tumor heterogeneity and sampling error (44, 45). For instance, WBNAA could help guide management when planning surgery (ie, conservative vs aggressive) for a patient with a suspected low-grade lesion by suggesting its true infiltrative and malignant potential. Perhaps, aggressive surgical resection of highly infiltrative low-grade tumors would preclude early recurrence and, more important, malignant transformation. Because of the poor prognosis of high-grade gliomas and the morbidity of their treatments, such assessments could also aid in identifying patients who would most benefit from aggressive management versus those for whom palliation would be more appropriate. Consequently, the main utility of WBNAA could be in customizing treatment. WBNAA could also serve as an efficacy monitor of systemically delivered therapeutics—eg, angiogenesis inhibitors, immunotherapy and gene therapy (46)—for which localization of tumor infiltration is inconsequential.
Conclusion
In this study, a significant WBNAA deficit was found in patients with glial tumors that persisted following surgery and whose magnitude cannot be accounted for by depletion within the lesion alone. This deficit was greater in patients with higher-grade tumors, who, as per the epidemiology of this disease, were also the older individuals, both independent predictors of a poor prognosis. This opens the possibility of a noninvasive assessment of diffuse tumor infiltration. Further investigation is required to delineate potential roles of WBNAA in customizing treatment for individuals with glial tumors.
Footnotes
Supported by National Institutes of Health grants EB01015 and CA92547.
Presented in part at the 90th meeting of the Radiological Society of North America, Chicago, IL, November 28–December 3, 2004.
References
- Received January 20, 2005.
- Accepted after revision March 31, 2005.
- Copyright © American Society of Neuroradiology


