
Article Figures & Data
Figures
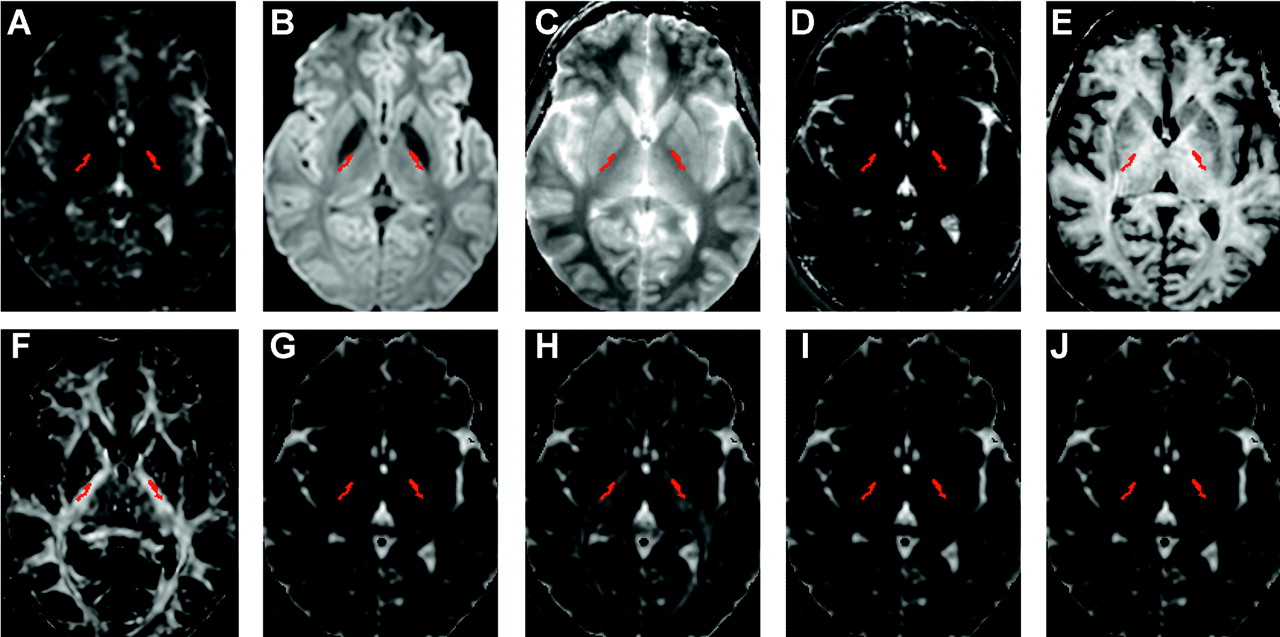
- Fig 1.
Corticospinal tracts of a 32-year-old healthy woman. In these axial sections at the level of the internal capsule, voxels containing the CSTs reconstructed by the whole-brain method are rendered in red. A, Minimally diffusion-weighted map. B, Mean diffusion-weighted map. C, Absolute T1. D, Absolute T2. E, MTR. F, FA. G, MD. H, λ1; I, λ2; J, λ3. The map of transverse diffusivity, λ⊥, is not shown.
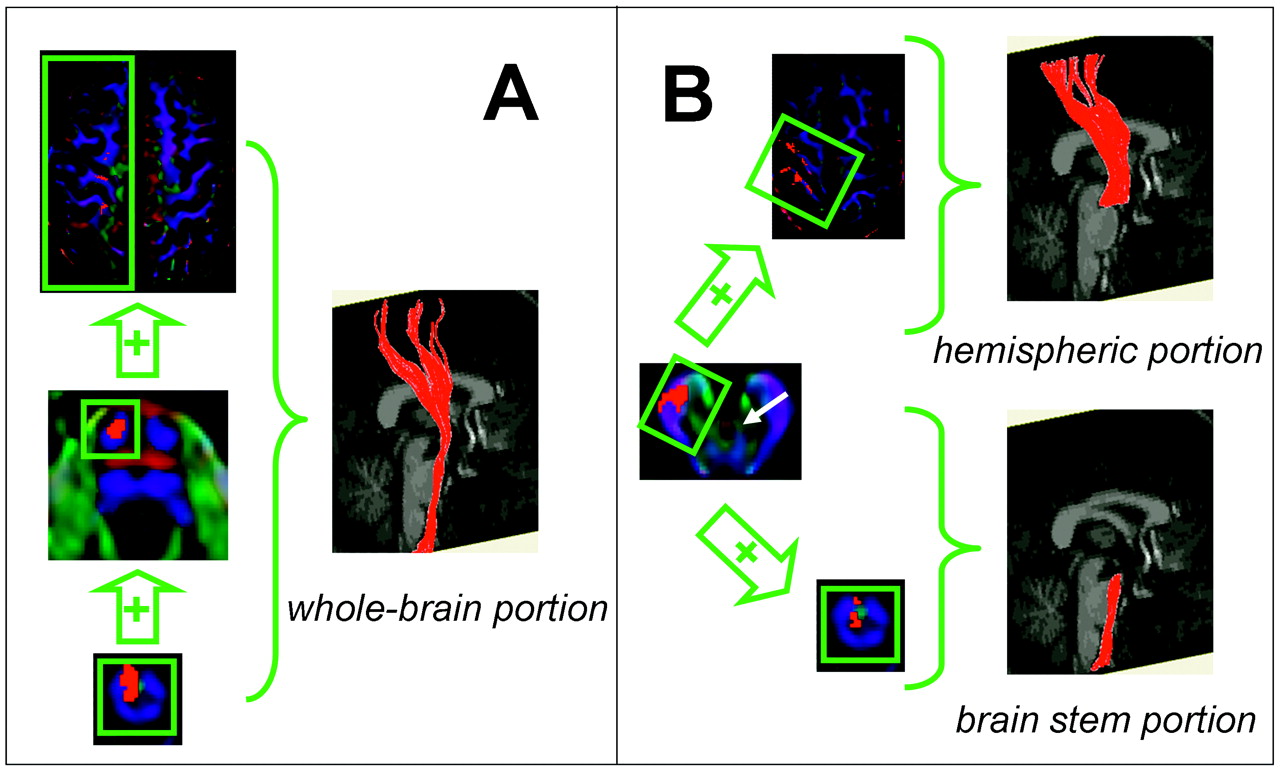
- Fig 2.
Right-sided corticospinal tracts, reconstructed from DTI data with ROIs chosen as described in “Methods.” Axial sections are portions of color-coded maps derived from FA and the principal eigenvector. In these maps, blue represents tracts running in the rostrocaudal axis; green, anteroposterior; and red, mediolateral; oblique angles are represented by a mixture of colors. The decussation of the superior cerebellar peduncle is denoted by the white arrow at the level of the midbrain in B. 3D representation of the CSTs are superimposed on coregistered magnetization-prepared rapid gradient-echo scans, which are heavily T1-weighted. A, Reconstruction of the right whole-brain CST, with ROIs depicted in green. B, Reconstruction of hemispheric and brain stem portions of the right CST.
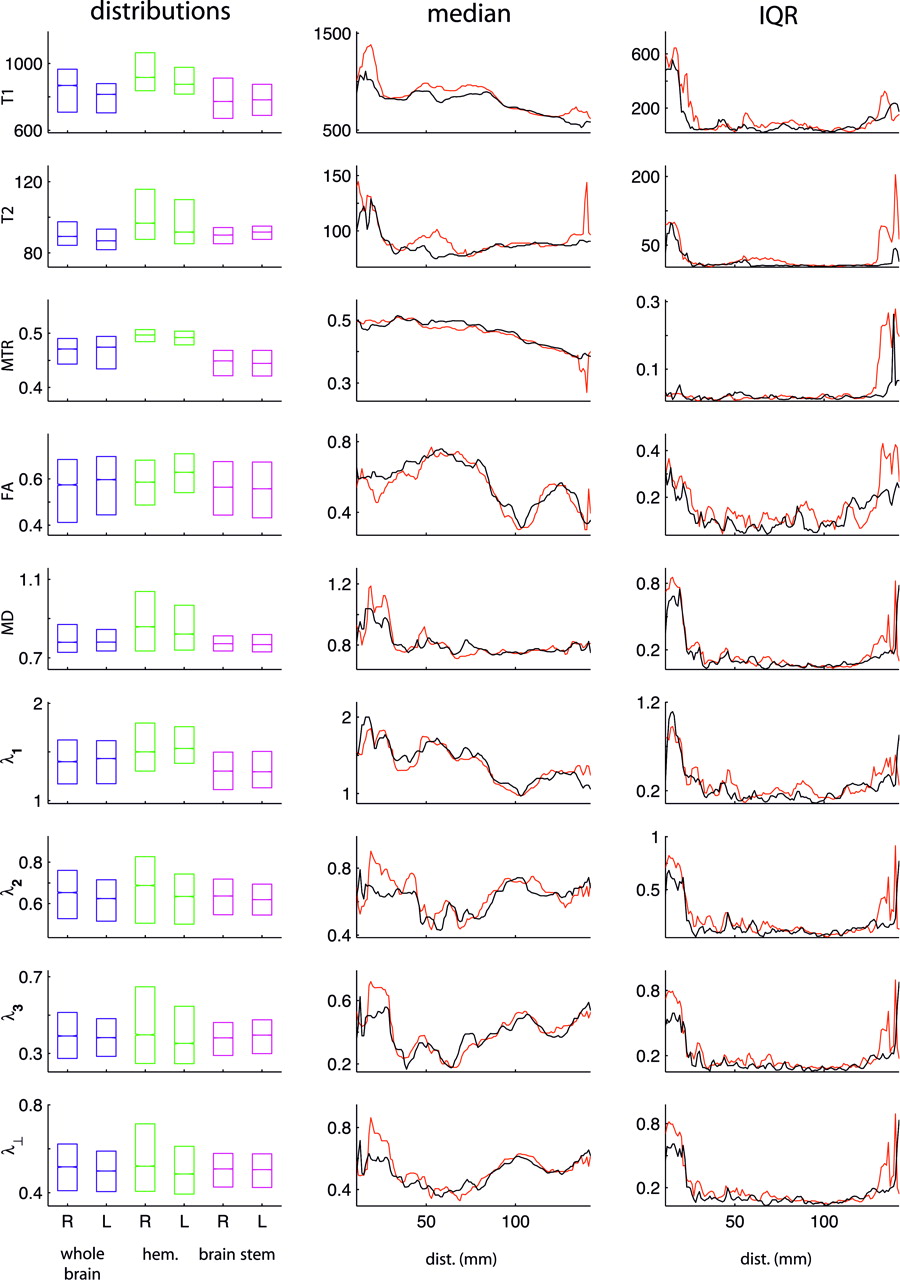
- Fig 3.
MR imaging parameters restricted to the corticospinal tracts of the subject shown in Figs 1 and 2. Left column shows parameter distributions restricted to the CSTs in the whole brain (blue), brain stem (green), and hemispheres (magenta). Each box shows the IQR across the entire reconstructed tract of the parameter labeled on the vertical axis, with the central line representing the median. Middle column shows median MR imaging parameters for the right (black) and left (red) CST, as a function of distance from the lowest section in the medulla. Data are taken from the whole-brain reconstructions. Right column shows IQR versus distance. For this individual, distances <20 mm correspond approximately to the medulla; 20–45 mm, to the pons; 45–60 mm, to the midbrain; 60–85 mm, to the internal capsule; 85–120 mm, to the corona radiata; and >120 mm to the subcortical white matter. For easier visualization, plots in the middle and right columns exclude highly variable data from the lowest and highest sections. Units: ms (T1, T2); 10−3 mm2/s (MD, λ1, λ2, λ3, λ⊥).
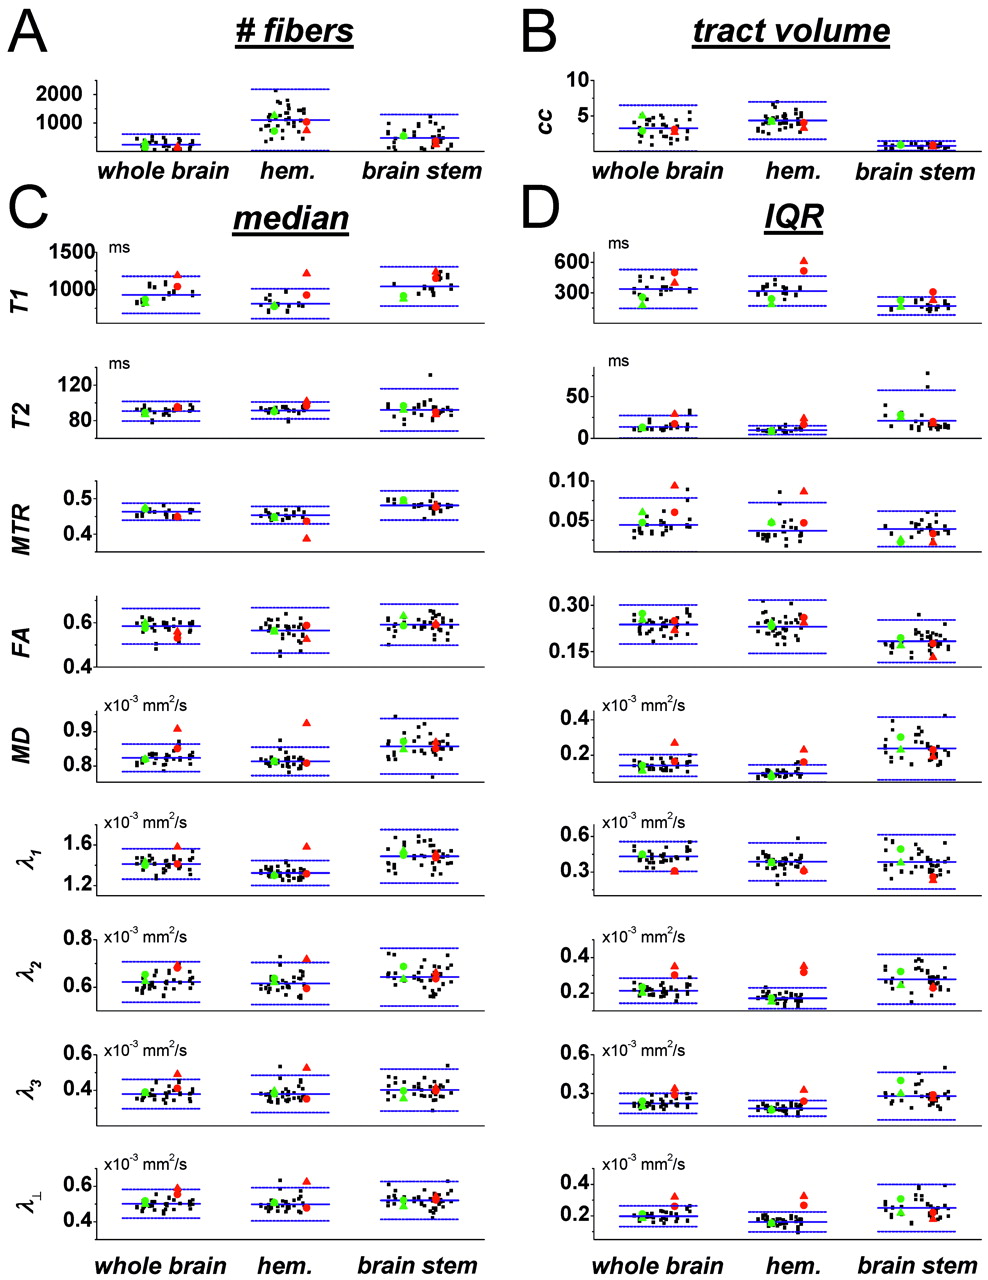
- Fig 4.
Properties of the reconstructed corticospinal tracts. A, Number of reconstructed fibers. B, Tract volume. C and D, Medians (C) and IQRs (D), of individual MR imaging parameters restricted to the CSTs. Black points denote healthy individuals; green, the particular healthy subject of Figs 1–3; and red, an individual with MS. For green and red points, circles denote the right CST, and triangles, the left CST; for black points, the right and left sides are not distinguished. Also shown are means (central horizontal lines) and 99% normal ranges (delimited by flanking horizontal lines) across the population of healthy individuals. Parameter type is given in the vertical axis label for each graph in C; the same labels apply to panel D. Data are randomly scattered along the horizontal axis within each category, for easier visualization. For individuals scanned more than once, cross-scan means are plotted.
- Fig 5.
Asymmetry indices derived from reconstructed corticospinal tracts. (See the legend to Fig 4 for details on the presentation.) Vertical axis labels in C denote the MR imaging parameters for which asymmetry indices are shown; the same labels apply to panel D.
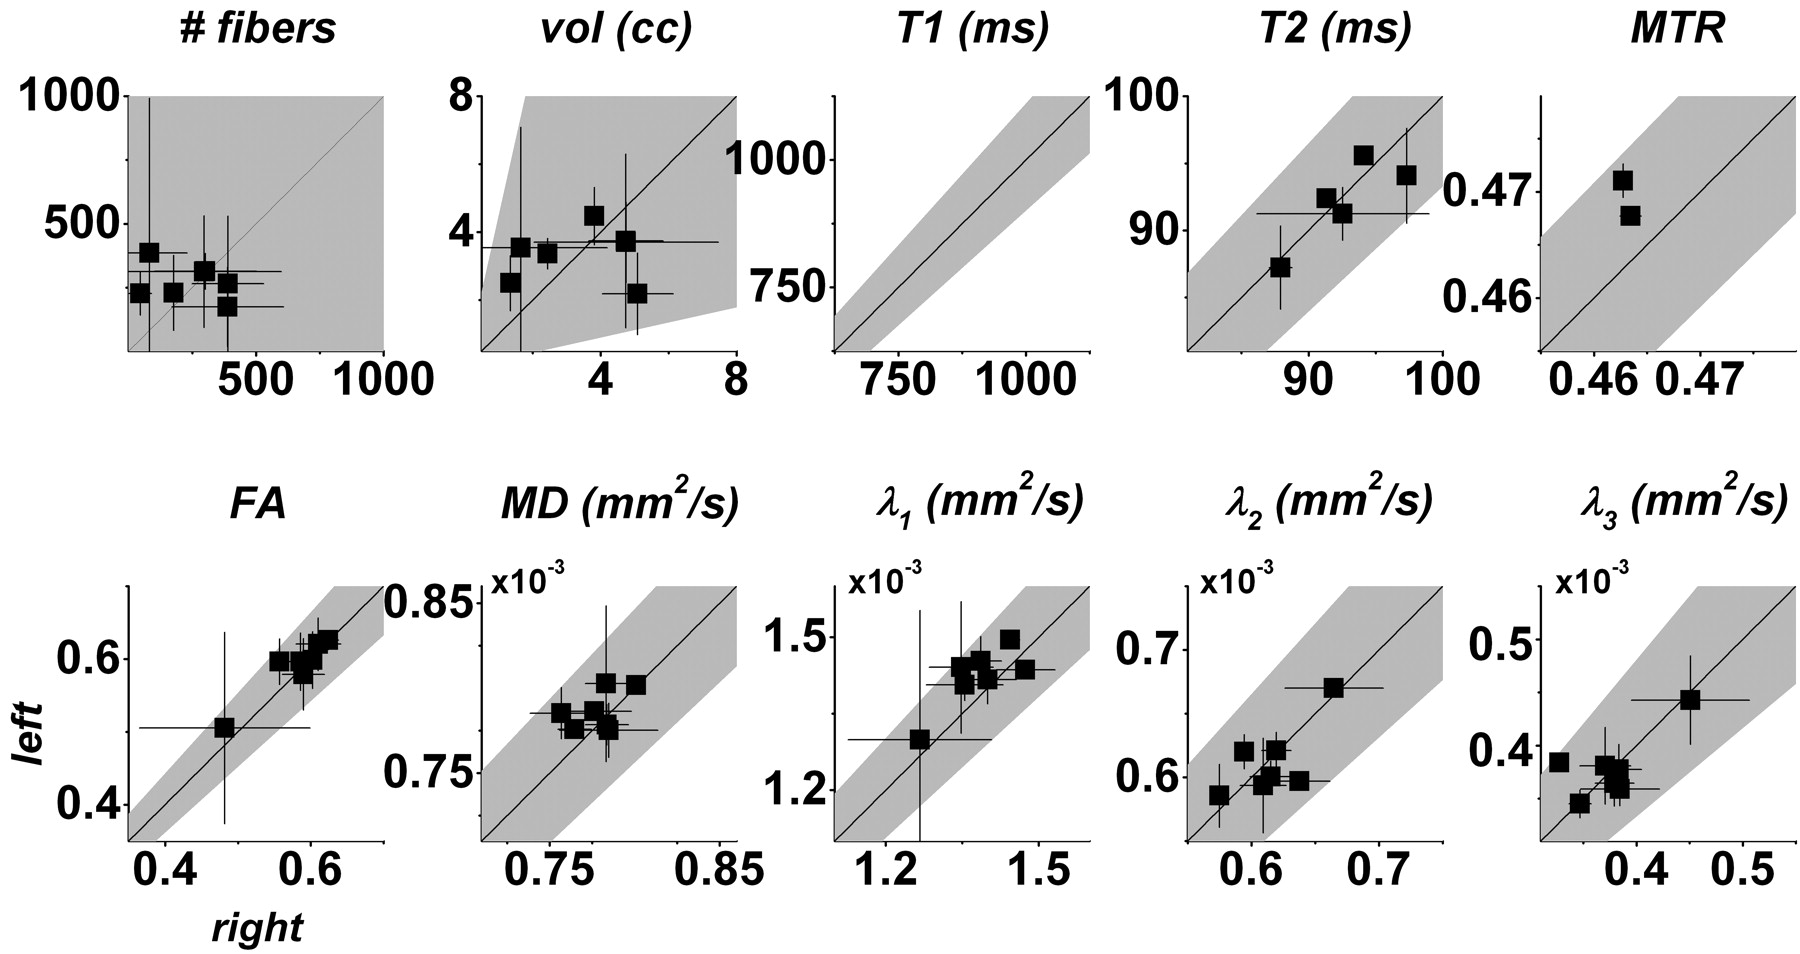
- Fig 6.
Scatterplots of fiber number, tract volume, and median MR imaging parameters across the whole-brain portions of the left versus right CSTs. Cross-scan means (squares) and 95% confidence intervals of the mean (error bars) are shown only for individuals who were scanned several times. In each plot, the 99% normal range derived from all healthy individuals (including those scanned only once) is shaded gray. Note that only the normal range is shown for T1 because we did not obtain absolute T1 data on multiple occasions from any individual.


Tables
- Table 1:
Population means and 99% normal ranges (in parentheses) of fiber number, tract volume, and MR parameter medians across our population of healthy individuals. Data obtained at 3T.
Reconstruction Type No. of fibers Vol. (cm2) T1 (ms) T2 (ms) MTR FA MD (×104 mm2/s) λ1 (×104 mm2/s) λ2 (×104 mm2/s) λ3 (×104 mm2/s) λ⊥ (×104 mm2/s) No. of individuals 20 20 11 17 15 20 20 20 20 20 20 Whole brain 240 (−120, 610) 3.3 (0.039, 6.5) 930 (680, 1180) 91 (80, 102) 0.46 (0.44, 0.49) 0.58 (0.51, 0.66) 7.9 (7.3, 8.5) 14 (13, 16) 6.2 (5.4, 7.1) 3.8 (3.0, 4.6) 5.0 (4.2, 5.8) Hemispheres 1100 (28, 2200) 4.4 (1.7, 7.0) 810 (610, 1000) 92 (82, 101) 0.45 (0.43, 0.48) 0.57 (0.46, 0.67) 7.7 (7.1, 8.3) 13 (12, 15) 6.2 (5.3, 7.0) 3.8 (2.7, 4.8) 5.0 (4.1, 5.9) Brain stem 470 (−350, 1300) 0.81 (0.14, 1.5) 1040 (780, 1300) 92 (68, 116) 0.48 (0.44, 0.52) 0.59 (0.50, 0.68) 8.4 (7.2, 9.6) 15 (12, 18) 6.4 (5.2, 7.6) 4.0 (2.8, 5.2) 5.2 (4.1, 6.3) Note:—MTR indicates magnetization transfer ratio; FA, fractional anisotropy; MD, mean diffusivity; λ⊥, transverse diffusivity (average of λ2 and λ3).
- Table 2:
Population means and 99% normal ranges (in parentheses) of MR parameter interquartile ranges across our population of healthy individuals. Data obtained at 3T.
Reconstruction Type T1 (ms) T2 (ms) MTR FA MD (×104 mm2/s) λ1 (×104 mm2/s) λ2 (×104 mm2/s) λ3 (×104 mm2/s) λ⊥ (×104 mm2/s) No. of individuals 11 17 15 20 20 20 20 20 20 Whole brain 340 (150, 530) 14 (0.20, 27) 0.044 (0.010, 0.078) 0.24 (0.17, 0.30) 1.4 (0.79, 2.0) 4.3 (3.1, 5.6) 2.1 (1.4, 2.8) 2.2 (1.5, 3.0) 2.0 (1.3, 2.6) Hemispheres 320 (170, 460) 9.8 (4.6, 15) 0.037 (0.0013, 0.072) 0.23 (0.14, 0.32) 0.96 (0.47, 1.4) 3.9 (2.3, 5.5) 1.7 (1.1, 2.3) 1.9 (1.2, 2.5) 1.6 (0.99, 2.3) Brain stem 170 (82, 260) 21 (−15, 57) 0.039 (0.017, 0.062) 0.18 (0.12, 0.25) 2.4 (0.60, 4.2) 3.9 (1.6, 6.2) 2.8 (1.4, 4.2) 2.8 (0.96, 4.6) 2.5 (1.0, 4.0) Note:—MTR indicates magnetization transfer ratio; FA, fractional anisotropy; MD, mean diffusivity; λ⊥, transverse diffusivity (average of λ2 and λ3).
- Table 3:
99% normal ranges of absolute asymmetry indices for fiber number, tract volume, and summary statistics of MR parameters across our population of healthy volunteers
Reconstruction Type No. of fibers Vol. T1 T2 MTR FA MD λ1 λ2 λ3 λ⊥ No. of individuals 20 20 11 17 15 20 20 20 20 20 20 Whole brain 1.0 0.64 0.053 (0.20) 0.035 (0.21) 0.012 (0.20) 0.051 (0.16) 0.028 (0.28) 0.041 (0.16) 0.052 (0.21) 0.092 (0.20) 0.064 (0.19) Hemispheres 0.56 0.31 0.047 (0.13) 0.026 (0.17) 0.015 (0.23) 0.068 (0.20) 0.023 (0.19) 0.033 (0.20) 0.059 (0.19) 0.098 (0.18) 0.071 (0.20) Brain stem 0.97 0.54 0.054 (0.31) 0.087 (0.34) 0.021 (0.29) 0.073 (0.15) 0.10 (0.31) 0.097 (0.28) 0.12 (0.20) 0.18 (0.26) 0.13 (0.22) Note:—MTR indicates magnetization transfer ratio; FA, fractional anisotropy; MD, mean diffusivity; λ⊥, transverse diffusivity (average of λ2 and λ3). For the MR parameters, cutoffs for medians and interquartile ranges (in parentheses) are given. Data obtained at 3T.
In this issue


Jump to section
Related Articles
Cited By...
- Coherent waves of myelin plasticity during motor-skill learning
- Test-Retest and Interreader Reproducibility of Semiautomated Atlas-Based Analysis of Diffusion Tensor Imaging Data in Acute Cervical Spine Trauma in Adult Patients
- Loss of corticospinal tract integrity in early MS disease stages
- Different Characteristics of the Corticospinal Tract According to the Cerebral Origin: DTI Study
- Spinal cord quantitative MRI discriminates between disability levels in multiple sclerosis
- Thalamocortical Connectivity in Healthy Children: Asymmetries and Robust Developmental Changes between Ages 8 and 17 Years
- Longitudinal changes in diffusion tensor-based quantitative MRI in multiple sclerosis