
Abstract
BACKGROUND AND PURPOSE: Preoperative prediction of tumor malignancy is clinically very important, because this information strongly influences the surgical plan. We evaluate the preoperative apparent diffusion coefficient (ADC) maps of benign and malignant salivary gland tumors.
MATERIALS AND METHODS: High-resolution MR imaging was performed on 31 patients with benign or malignant salivary gland tumors; ADC maps of the tumors were also obtained. Surface coils of 47 or 110 mm diameter were used to improve the image resolution. The ADCs were compared with histologic features of the excised tumors.
RESULTS: The ADC maps effectively depicted the histologic features of the salivary gland tumors, such as presence of cancer cells, myxomatous tissues, fibrosis, necrosis, cyst formation, and lymphoid tissues. The ADC maps showed that more frequent areas with high ADCs (≥1.8 × 10⁻³ mm2/s) were significantly greater in benign tumors than in malignant tumors. The sensitivity and specificity for high ADC occupying fewer than 5% of the area of a tumor was 89% and 100%, respectively, resulting in 97% accuracy, 100% positive predictive value, and 96% negative predictive value.
CONCLUSION: The ADC may provide preoperative tissue characterization of the salivary gland tumors.
Preoperative prediction of the malignancy or benignancy of a salivary gland tumor is clinically very important and strongly influences the surgical plan. MR imaging has been established as a method for evaluating solid lesions in the salivary glands. Although conventional T1- and T2-weighted MR imaging techniques with or without gadolinium enhancement have been used for the diagnosis of salivary gland tumors, many investigators have reported that differentiation of salivary gland tumors, especially between benign and low-grade malignant tumors, is often difficult.1–5
Functional MR imaging, such as dynamic contrast-enhanced MR imaging and diffusion-weighted MR imaging, has been applied to the diagnosis of benign and malignant salivary gland tumors.6–10 The efficacy of dynamic contrast-enhanced MR imaging in differentiating salivary gland tumors is controversial.6,7
Diffusion-weighted imaging is very sensitive to biophysical abnormalities associated with pathologic changes, even at very early stages of the disease.10 However, the apparent diffusion coefficient (ADC) is susceptible to perfusion and salivary flow in the salivary gland. In such cases, the b-factor setting is very critical, and it significantly influences the ADC values; the ADC values calculated from sequences using low b factors are significantly higher than those calculated from high b factors.9,10
Furthermore, the salivary gland tumors are composed of distinctive tissues, including proliferating tumor cells, myxomatous tissues, lymphoid tissues, necrosis, and cysts. Analyzing a large region of interest in a histologically heterogeneous tumor may therefore result in spurious results with regard to the tumor histology. To avoid this potential error, tissue characterization using high-resolution MR imaging techniques is mandatory.
We reasoned that the ADC measurement coupled with a high-resolution MR imaging technique might enable effective characterization of histologic features of the salivary gland tumors. We also expected that mapping of the ADC could differentiate benign from malignant tumors. Here, we report the efficacy of ADC criteria for the differentiation of benign and malignant salivary gland tumors.
Materials and Methods
Subjects
The study cohort comprised 31 patients with salivary gland tumors (18 women and 13 men; average age, 63 ± 11 years). The tumors were located in the parotid (n = 27), submandibular (n = 1), and sublingual (n = 3) glands and consisted of 22 benign and 9 malignant tumors. The histologic types of the tumors were as follows: pleomorphic adenomas (n = 11), Warthin tumors (n = 10), papillary cystadenoma (n = 1), adenoid cystic carcinomas (n = 2), mucoepidermoid carcinomas (n = 2), salivary duct carcinoma (n = 1), adenocarcinoma (n = 1), and carcinoma ex pleomorphic adenoma (n = 1). In 14 (6 women and 8 men; average age, 64 ± 18 years) of the 31 patients, we obtained MR images of the healthy parotid (n = 14), submandibular (n = 11), and sublingual (n = 8) glands.
MR Imaging
MR imaging was performed using a 1.5-T MR imager (Gyroscan Intera 1.5T Master; Philips Medical Systems, Best, the Netherlands) with a 47-mm microscopy coil or a 110-mm synergy flex S coil (Philips Medical Systems). To compensate for the image intensity inhomogeneity inherent to the use of small-sized surface coil, we used the constant level appearance postprocessing technique (Philips Medical Systems).
Diffusion-Weighted Imaging
Diffusion-weighted axial images (TR/TE/numbers of signal intensity acquisition = 2973 ms/121 ms/6 for microscopy coil; TR/TE/numbers of signal intensity acquisition = 3058 ms/93 ms/4 for S coil) were obtained using single-shot, spin-echo, echo-planar imaging. For the imaging with a microscopy coil, we used 70-mm FOV, 2-mm section thickness, 0.2-mm section gap, and 80 × 56 matrix size. For the imaging with an S coil, we used 200-mm FOV, 3-mm section thickness, 0.3-mm section gap, and 112 × 88 matrix size. For diffusion-weighted imaging using S coil, we used the parallel imaging (sensitivity encoding, SENSE; SENSE factor = 2).
In general, when one uses b factors greater than 300, the resultant ADC contains negligible amounts, if any, of perfusion factor. Therefore, we used 2 b factors (500 and 1000 s/mm2). This procedure requires additional time to be performed, but the combined use of SENSE technique can compensate it.
Conventional MR Imaging
We also obtained conventional T1-weighted (TR/TE/numbers of signal intensity acquisition = 500 ms/19 ms/4 for microscopy coil; TR/TE/number of signal intensity acquisition = 500 ms/15 ms/4 for S coil) and fat-suppressed (spectral presaturation with inversion recovery) T2-weighted (TR/TE/number of signal intensity acquisition = 3059 ms/90 ms/6 for microscopy coil; TR/TE/number of signal intensity acquisition = 4677 ms/80 ms/4 for S coil) axial images of the salivary gland tumors using a turbo spin-echo sequence. For T1- and T2-weighted imaging with a microscopy coil, we used 70-mm FOV, 2-mm section thickness, 0.2-mm section gap, and 160 × 128 matrix size. For T1- and T2-weighted imaging with an S coil, we used 200-mm FOV, 3-mm section thickness, 0.3-mm section gap, and 256 × 224 matrix size.
For T1-weighted and fat-suppressed T2-weighted MR imaging using S coil, we used parallel imaging (SENSE factor = 2). For gadolinium-enhanced studies with a microscopy coil, gadolinium (Magnevist; Schering, Berlin, Germany) was injected intravenously at a dose of 0.2 mL/kg body weight and at an injection rate of 1.5 mL/s.
Image Analysis
Gray-scale ADC map images from the tumors were saved in TIF format and then converted to color ADC map images after setting the window level of gray-scale ADC map images at 1300 and window width at 2600. As a result, tumor areas having high ADCs are displayed as color areas of shorter wavelengths (such as red) and tumor areas having low ADCs, as color areas of longer wavelengths such as blue. These procedures were performed on a personal computer using the OsiriX software (available at: http://homepage.mac.com/rossetantoine/osirix/Index2.html).
We determined the area having extremely low ADC (<0.6 × 10⁻³ mm2/s), low ADC (0.6 × 10⁻³ mm2/s ≤ ADC <1.2 × 10⁻³ mm2/s), intermediate ADC (1.2 × 10⁻³ mm2/s ≤ ADC < 1.8 × 10⁻³ mm2/s), or high ADC (≥ 1.8 × 10⁻³ mm2/s), relative to the total area of the maximum tumor area on ADC maps using Image J software (available at http://rsb.info.nih.gov/ij/download.html), and expressed these as percentage areas. The determination of the particular area having extremely low, low, intermediate, or high ADCs was performed by manually placing an irregular region of interest that outlined each of the areas on the ADC maps.
To access interobserver error, 3 observers (M.S., N.S., and T.N.) calculated the percentage areas of ADCs obtained from 5 patients. The intraobserver error was also determined after the 3 observers quantified 3 times, each interrupted by at least 1 day, the percentage areas of ADC on 3 patients different from those used in determination of the interobserver error. The errors were determined as the percentage coefficient of variance and expressed as averages of the 3 observers. We obtained 2.2% and 2.3% coefficient of variance for the interobserver and intraobserver errors, respectively.
Color ADC maps of the salivary gland tumors were compared with histologic features on hematoxylin-eosin–stained histopathologic specimens that were obtained from excised tumors.
We also obtained ADCs from the healthy parotid, submandibular, and sublingual glands of the patients with salivary gland tumors. These glands, therefore, were on the contralateral side of the gland with tumor or were different types of salivary glands at different section levels. Analyses of the gland regions that contained large vessels, such as the retromandibular vein in the parotid gland, were avoided.
Interpretation of MR Images and Assessment of Predictive Ability of MR Imaging Criteria
We assessed the predictive ability of the MR imaging criteria based on the ADC levels (extremely low, low, intermediate, or high) for the differentiation between benign and malignant tumors as follows: negative predictive values and positive predictive values were used to assess the performance of ADC maps in the differentiation of benign and malignant salivary gland tumors. The negative predictive value is the percentage of salivary gland tumors identified by ADC maps as negative for malignancy or a specific tumor pathology; these tumors were histopathologically proved to be nonmalignant or lacking the specific tumor pathology. The positive predictive value is the percentage of salivary gland tumors identified by ADC maps as positive for malignancy or for the specific tumor pathology; these tumors were histopathologically proved to be malignant or to have the specific tumor pathology. We also calculated the sensitivity (true-positive results/[true-positive results + false-negative results]) and specificity (true-negative results/[true-negative results + false-positive results]). The accuracy was calculated by the following formula: (true-positive results + true-negative results)/total number of salivary gland tumors.
Statistical Analysis
Significance in the ADCs between the different glands was determined by the Mann-Whitney U test using commercially available statistical software (StatView 4.51; Abacus Concepts, Berkeley, Calif).
Results
ADCs of Healthy Salivary Glands
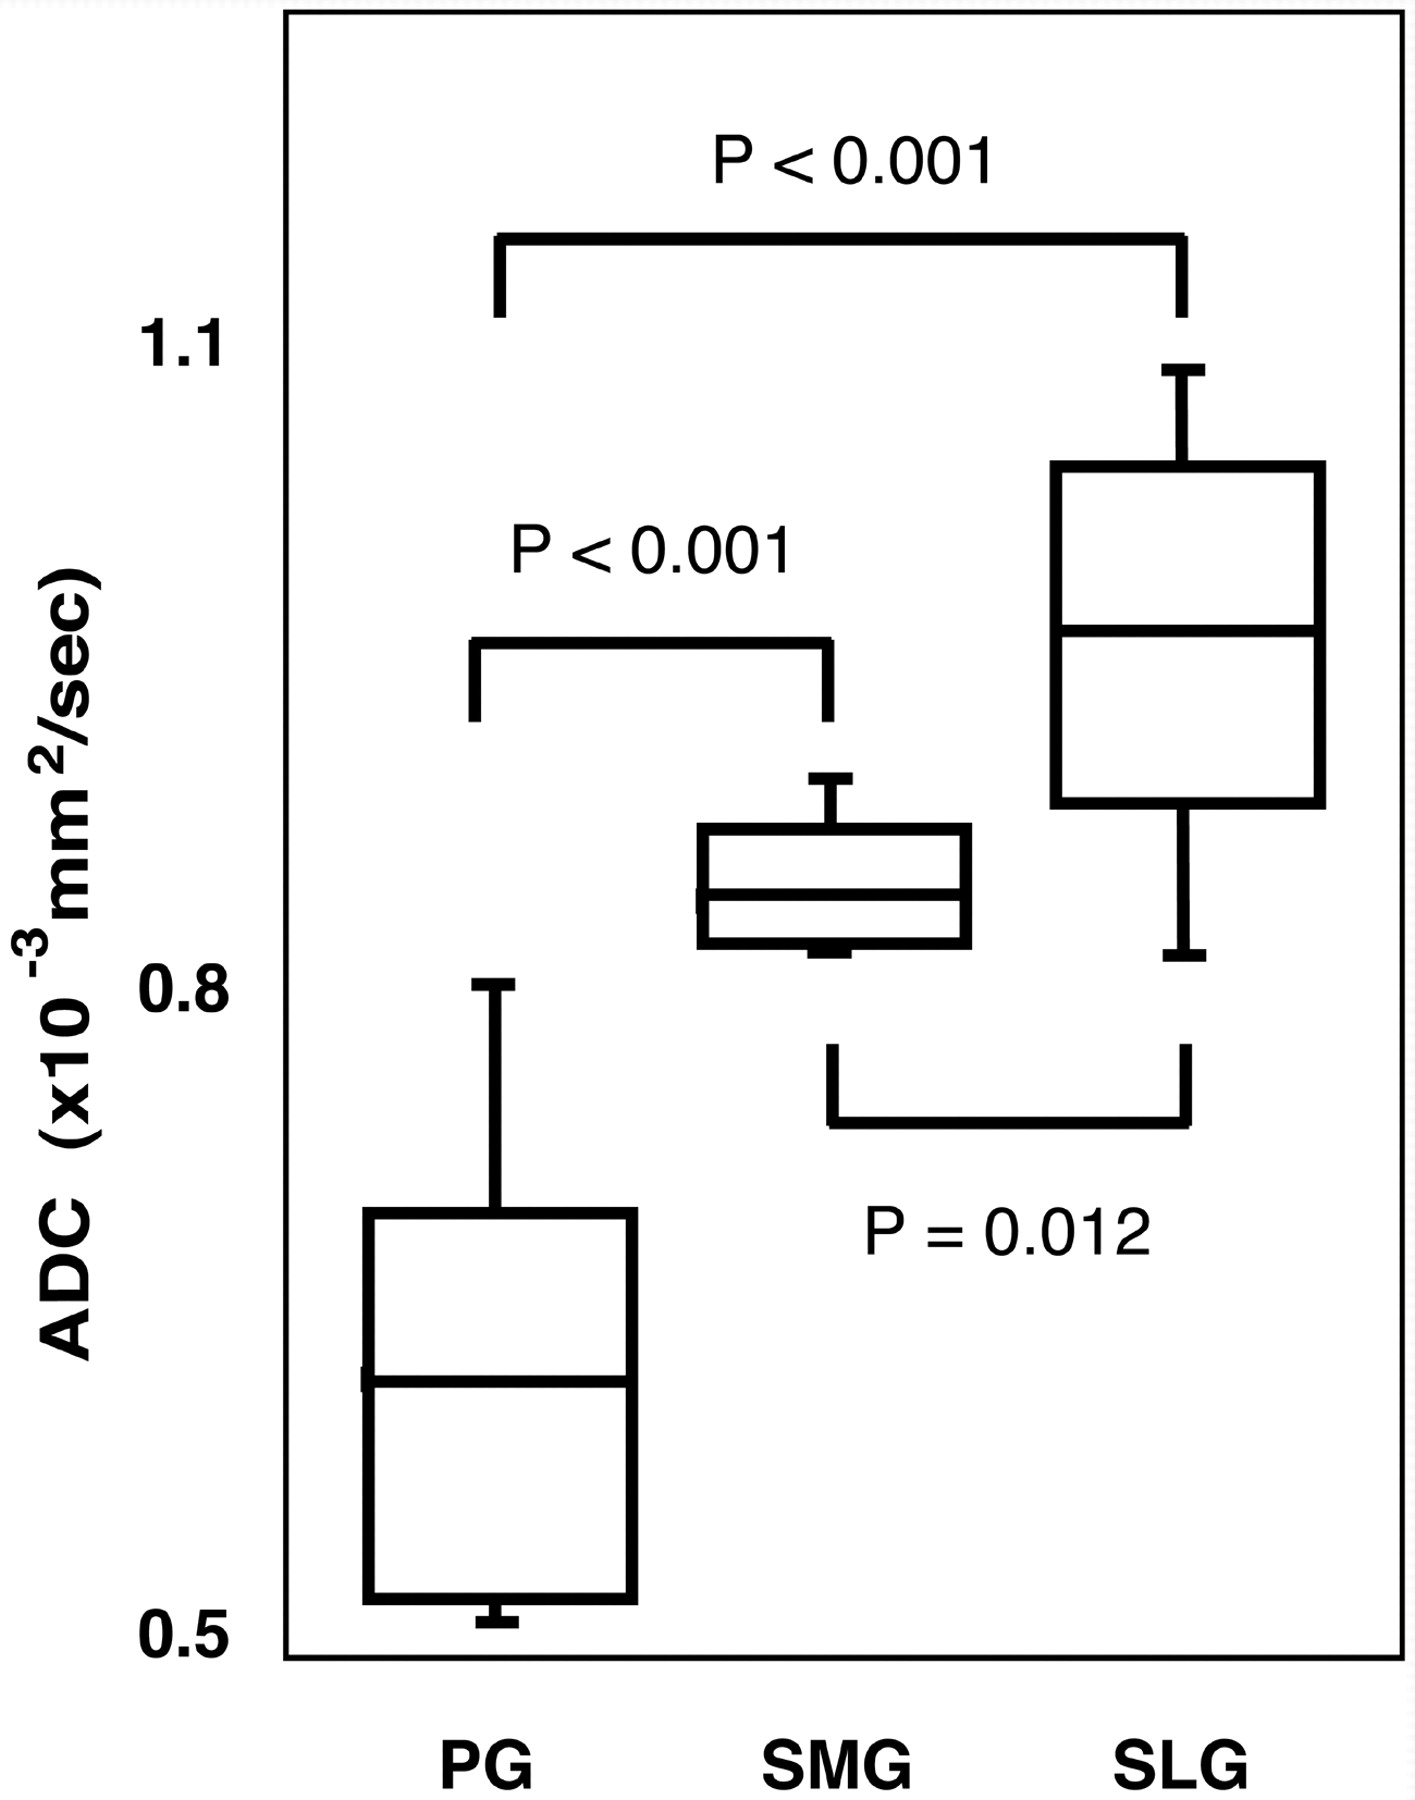
We found significant differences in ADCs between any 2 of the 3 different types of the salivary glands; the ADCs of the parotid, submandibular, and sublingual glands were 0.63 ± 0.11 × 10⁻³ mm2/s, 0.97 ± 0.09 × 10⁻³ mm2/s, and 0.87 ± 0.05 × 10⁻³ mm2/s, respectively (Fig 1).

Differences in ADC levels of the parotid, submandibular, and sublingual glands. Graph (box plots) shows ADC levels of parotid (PG), submandibular (SMG), and sublingual (SLG) glands. The horizontal line in each box is a median (50th percentile) of the measured values, the top and bottom of the boxes represent 25th and 75th percentiles, respectively, and whiskers indicate the range from the largest to smallest observed data points within 1.5 interquartile range presented by the box. P, Mann-Whitney U test.
ADC Maps of Benign Salivary Gland Tumors
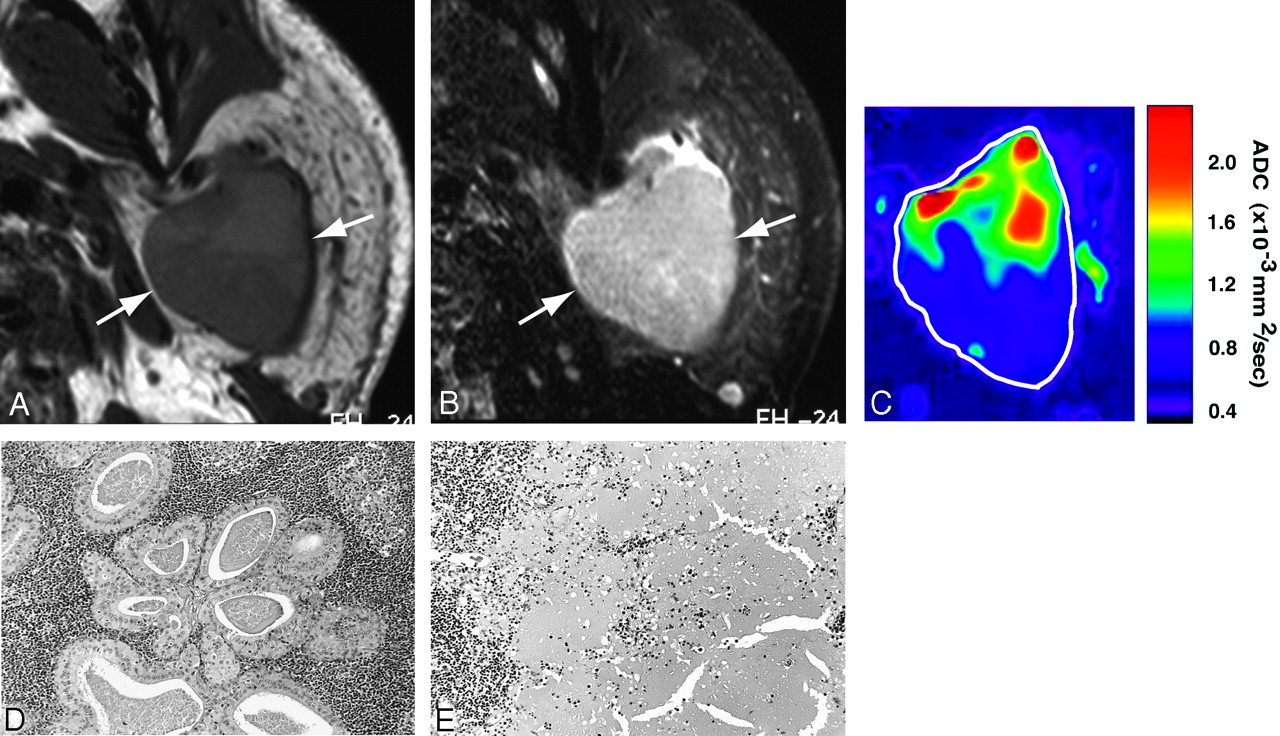
In general, pleomorphic adenomas were homogeneous on T1-weighted images (Fig 2A) and heterogeneous on fat-suppressed T2-weighted images (Fig 2B). The ADC maps showed that the areas of proliferating tumor cells (Fig 2D) were of intermediate ADC levels (Fig 2C). The tumor contained large areas with high ADC (Fig 2C) that corresponded to cystic (Fig 2E) or myxomatous lesions.

A 70-year-old man with pleomorphic adenoma of parotid gland. A, Axial T1-weighted (TR/TE = 426 ms/12 ms) image using 47-mm microscopy coil shows tumor (arrows) with homogeneous architectures and hypointense signals relative to gland.
B, Axial fat-suppressed T2-weighted (TR/TE = 4677 ms/80 ms) image using microscopy coil shows heterogeneous tumor (arrows).
C, Axial ADC map shows that tumor (indicated by white contour) contains central high ADC area and peripheral intermediate ADC area.
D and E, Photomicrographs show area with proliferating tumor cells (D) or large cyst (E). Original magnifications, 20× (D) and 10× (E). Hematoxylin-eosin staining.
Warthin tumors were relatively homogeneous on T1-weighted (Fig 3A) and T2-weighted (Fig 3B) images. The ADC maps demonstrated heterogeneous ADC levels (Fig 3C); they were composed of areas with extremely low ADC indicating lymphoid tissues (Fig 3D), areas with intermediate ADC corresponding to necrosis (Fig 3E), and areas with low ADC indicating cyst formation among the lymphoid tissues.

A 55-year-old man with Warthin tumor of parotid gland. A, Axial T1-weighted (TR/TE = 426 ms/12 ms) image using 47-mm microscopy coil shows hypointense and homogeneous tumor (arrows).
B, Axial fat-suppressed T2-weighted (TR/TE = 4677 ms/80 ms) image using 47-mm microscopy coil shows roughly homogeneous tumor (arrow).
C, Axial ADC map shows high ADC areas in proximal half and low ADC areas in distal half of Warthin tumor.
D and E, Photomicrographs show lymphoid tumor area (D) and necrotic area (E). Original magnification, 20×. Hematoxylin-eosin staining.
ADC Maps of Malignant Salivary Gland Tumors
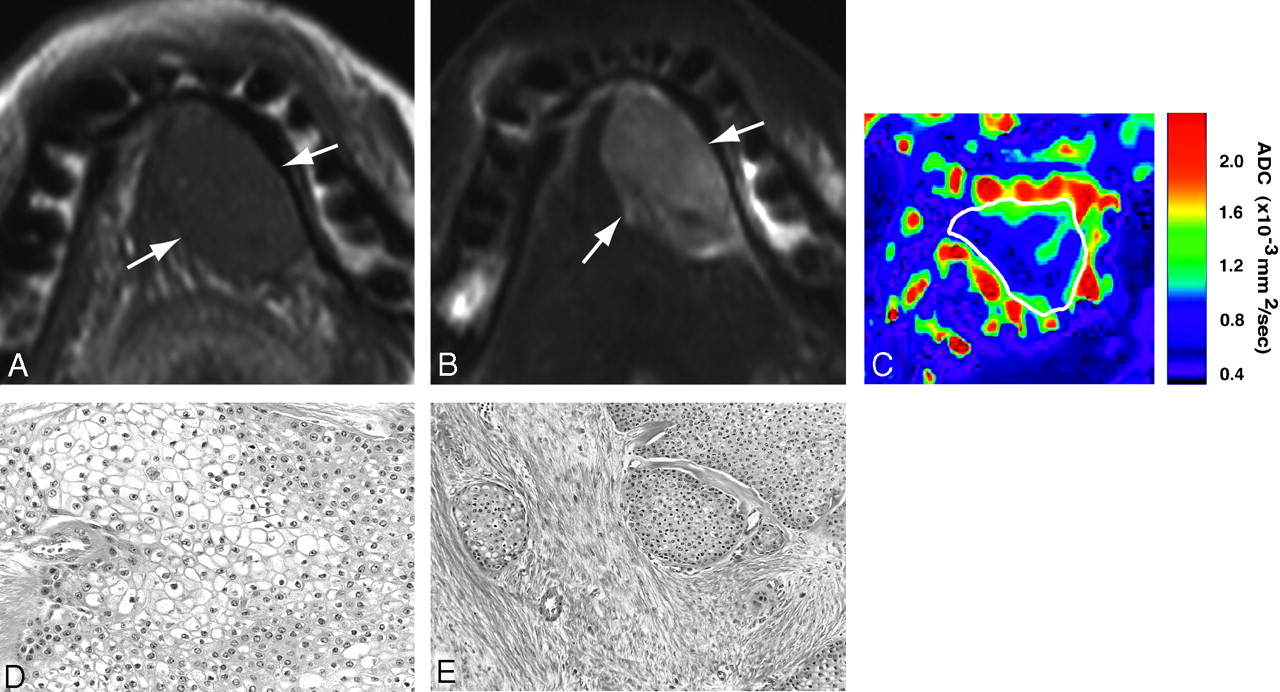
Mucoepidermoid carcinomas displayed homogeneous architectures on T1-weighted (Fig 4A) and slightly heterogeneous architectures on T2-weighted images (Fig 4B). The ADC map demonstrated relatively homogeneous areas of low ADCs (Fig 4C), corresponding to tumor areas with polygonal (Fig 4D) or round-cell proliferation (Fig 4E).

A 68-year-old man with mucoepidermoid carcinoma of sublingual gland. A, Axial T1-weighted (TR/TE = 500 ms/15 ms) image using 110-mm surface coil shows homogeneous tumor (arrows) of sublingual gland.
B, Axial fat-suppressed T2-weighted (TR/TE = 4677 ms/80 ms) image using 110-mm surface coil shows homogeneous tumor (arrows).
C, Axial ADC map shows that major part of tumor is of low ADCs.
D and E, Photomicrographs show proliferation of polygonal, clear cancer cells (D) and cancer cell nests in attenuated fibrous connective tissues (E). Original magnifications, 20× (D) and 10× (E). Hematoxylin-eosin staining.
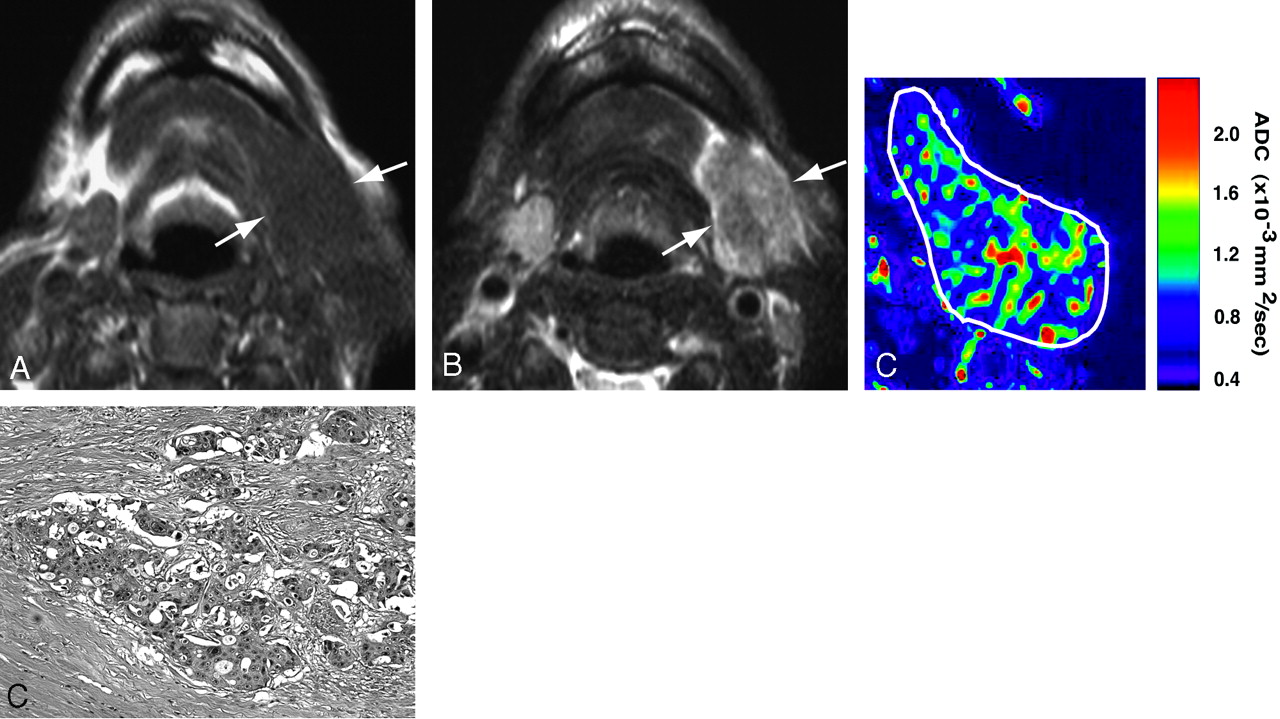
Adenocarcinoma (Fig 5) and adenoid cystic carcinoma (data not shown) exhibited similar MR imaging features, with relatively homogeneous signals on T1- (Fig 5A) and T2-weighted (Fig 5B) images, and speckled patterns on ADC maps for indicating low to high ADCs (Fig 5C). The heterogeneity on ADC maps indicated small necrotic or cystic areas distributed in the tumors (Fig 5D).

A 71-year-old man with adenocarcinoma of submandibular gland. A, Axial T1-weighted (TR/TE = 500 ms/15 ms) image using 110-mm surface coil shows homogeneous tumor (arrows) of submandibular gland.
B, Axial fat-suppressed T2-weighted (TR/TE = 4677/80) image using surface coil shows slightly heterogeneous tumor (arrows).
C, Axial ADC map shows speckled pattern of low and high ADCs in tumor.
D, Photomicrograph shows cancer cells proliferating in loose connective tissues. Original magnification, 20×. Hematoxylin- eosin staining.
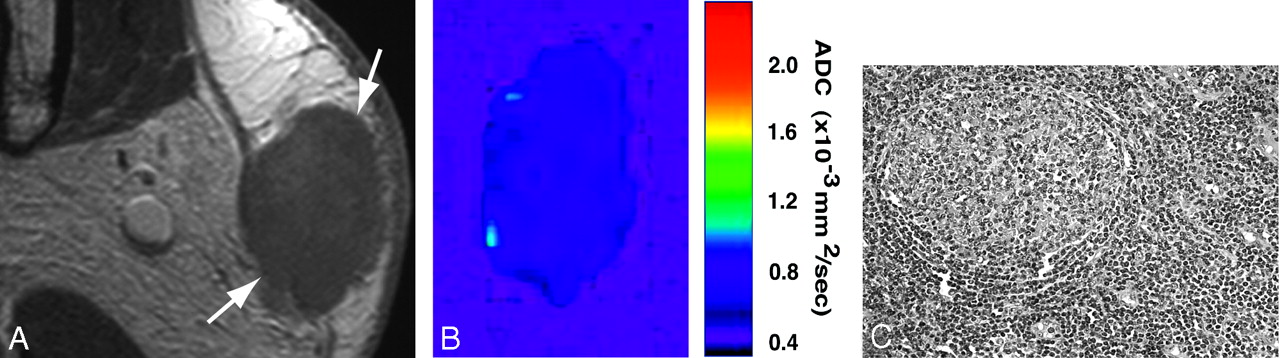
In contrast to salivary gland cancers, malignant lymphomas (Fig 6) arising in the salivary glands were associated with extremely low ADCs throughout the lesions (Fig 6B); this was consistent with the homogeneous growth patterns of lymphoma cells (Fig 6C).

A 56-year-old woman with malignant lymphoma of parotid gland. A, Axial gadolinium-enhanced fat-suppressed T1-weighted image (TR/TE = 426 ms/12 ms) using 47-mm microscopy coil shows homogeneous lymphoma (arrows) of superficial part of gland.
B, Axial ADC map shows lymphoma having low ADCs throughout lesion.
C, Photomicrograph shows lymphoma cell proliferation (B cell, medium-sized cell type) associated with germ center-like structure. Original magnification, 20×. Hematoxylin-eosin staining.
Differential Diagnosis of Benign and Malignant Tumors Using ADC Maps
We have summarized the profiles of ADC maps in Table 1. The area with high ADCs occupied 54%, 28%, and 8% of the tumor areas in pleomorphic adenomas, papillary cystadenoma, and Warthin tumors, respectively. In contrast, the high ADC areas were very limited, and instead, the areas with extremely low ADCs were predominant in the malignant tumors; the areas with extremely high ADCs were significantly greater in benign tumors than in malignant tumors (Table 1). When a salivary gland tumor having 5% or smaller areas of extremely high ADCs was considered to be malignant, we obtained 89% sensitivity, 100% specificity, 97% accuracy, and 100% positive and 96% negative predictive values (Table 2).
ADC map analysis of salivary gland tumors
Predictive ability of ADC criteria for salivary gland tumors
Discussion
Here, we have shown that the ADC maps can provide insights into the histologic characteristics such as presence of growing cancer cells, myxomatous tissues, fibrosis, necrosis, cyst formation, and lymphoid tissues.
Diffusion-weighted imaging was recently advocated for functional imaging of the parotid glands.1,11,12 Any changes in water content in the cells and the interstitial tissues are considered to affect the ADC levels of the glands. The ADC was decreased in the salivary glands with impaired function,1 and stimulations of the salivary gland function increased the ADC levels of the glands.12
In general, proliferating tumor cells are considered to be relatively rich in water content; the nature of these tumor cells, particularly of malignant tumor cells, significantly contributes to the diagnosis of recurrent and metastatic tumors.13 However, the salivary gland tumors are known to display a wide spectrum of histologic features. Therefore, tumor contrast on diffusion-weighted images may be significantly affected by variations in the proportions of tumor tissue components (ie, the stages of tumor cell differentiation, the presence or absence of necrotic tissues and cyst formation, attenuation of tumor cells, and degenerative changes of the interstitial tissues, such as myxomatous changes).
The technique has been applied to the diagnosis of salivary gland tumors14–16; for example, Ikeda et al14 showed that the ADCs of Warthin tumors were significantly lower than those of malignant tumors The same study group demonstrated that cellularity of tumors affects the ADC levels of the tumors.15 Using a small surface coil and comparing the histologic finding, we have extended these previous findings to show that the ADC mapping can depict the histologic characteristics of salivary gland tumors.
Pleomorphic adenomas exhibit versatile histologic features, and the MR imaging features of the tumors may overlap with those of malignant salivary gland tumors.9 Motoori et al16 proposed the significance of myxomatous tissue detection on MR images in differentiating between pleomorphic adenomas and malignant tumors. In the present study, we found that myxomatous tissues have high ADCs (∼1.8 × 10⁻³ mm2/s). In addition, the benign tumors frequently contained cystic components, which also contributed to the high ADC levels seen in the benign tumors. In contrast, such areas with high ADCs were rare or very limited in case of the malignant tumors (Table 1). Thus, the presence of high ADC tumor areas could be an important criterion in differentiating benign salivary gland tumors from malignant ones.
In most of the malignant salivary gland tumors, the areas with extremely low or low ADCs occupied 60% or greater parts of the tumor areas (Table 1). However, Warthin tumors exhibited significant areas with extremely low or low ADCs, which occupied 72% of the tumor area. Therefore, the use of the low or extremely low ADC criterion did not yield a good result in differentiating between benign and malignant tumors.
Consistent with the preceding study,17 we found that the ADCs were significantly different among the parotid, submandibular, and sublingual glands (Fig 1). However, considerable differences were found in ADC values of the salivary glands in healthy volunteers.8,18,19 These discrepancies in the ADC values of the salivary glands are considered to be attributable to the selection of different b factors applied9; the ADC values calculated using low b factor settings were found to be higher than those calculated using high b factor settings. This may be the result of differences in perfusion states in the glands. Therefore, when assessing the ADCs of salivary gland tumors, especially with low b factor settings, it should be noted that any differences in tumor blood vessel volumes might greatly influence the ADC levels of the salivary gland tumors.
Conclusion
Barring some limitations, such as a small number of malignant tumors included, the ADC map could allow us to predict the histologic characteristics and even the benign and malignant nature of the salivary gland tumors before surgical intervention. High-resolution MR imaging using a small surface coil would be effective for the evaluation of the nature of salivary gland tumors.
References
- Received December 6, 2005.
- Accepted after revision February 13, 2006.
- Copyright © American Society of Neuroradiology
In this issue


Jump to section
Related Articles
Cited By...
- Diffusion weighted magnetic resonance imaging in the diagnosis of parotid masses. Preliminary results
- Evaluating Instantaneous Perfusion Responses of Parotid Glands to Gustatory Stimulation Using High-Temporal-Resolution Echo-Planar Diffusion-Weighted Imaging
- Head and Neck Tumors: Assessment of Perfusion-Related Parameters and Diffusion Coefficients Based on the Intravoxel Incoherent Motion Model
- Biologic Imaging of Head and Neck Cancer: The Present and the Future
- Efficacy of Diffusion-Weighted Imaging for the Differentiation between Lymphomas and Carcinomas of the Nasopharynx and Oropharynx: Correlations of Apparent Diffusion Coefficients and Histologic Features
- Multiparametric MR Imaging of Sinonasal Diseases: Time-Signal Intensity Curve- and Apparent Diffusion Coefficient-Based Differentiation between Benign and Malignant Lesions
- Apparent Diffusion Coefficient Calculated with Relatively High b-Values Correlates with Local Failure of Head and Neck Squamous Cell Carcinoma Treated with Radiotherapy
- Apparent Diffusion Coefficient Mapping for Sinonasal Diseases: Differentiation of Benign and Malignant Lesions
- Diagnosing common parotid tumours with magnetic resonance imaging including diffusion-weighted imaging vs fine-needle aspiration cytology: a comparative study
- Diffusion-Weighted Echo-Planar MR Imaging of Primary Parotid Gland Tumors: Is a Prediction of Different Histologic Subtypes Possible?