
Abstract
BACKGROUND AND PURPOSE: Hypoxic-ischemic cerebral changes can be difficult to distinguish from normal myelination on T1-weighted images. We hypothesized that comparing signal intensity (SI) of brain structures on T1-weighted images enables differentiation of myelination from hypoxic-ischemic brain damage.
MATERIALS AND METHODS: T1-weighted images, obtained in 57 infants aged 1–104 days and born after a gestational age of 35 weeks or older, were retrospectively evaluated. Subjects were assigned to a patient (n = 23, with perinatal hypoxic-ischemic encephalopathy [HIE] stage 2/3) or a control group (n = 34). In each subject, an SI score was assigned to 19 brain structures on the basis of pairwise comparisons with the other 18 structures. In both groups, mean total SI scores were calculated for the 19 structures. Independent samples t tests assessed whether the mean total score of a structure differed significantly between the 2 groups. Logistic regression assessed which comparison was best to distinguish between the groups and to predict the presence of hypoxic-ischemic injury.
RESULTS: In patients, mean total SI scores for posterolateral putamen (PP) and peri-Rolandic cortex (PC) were significantly higher (P = .000 for both). Mean total SI scores of the posterior limb of internal capsule (PLIC) and the corona radiata (CR) were significantly lower in patients (P = .000 and 0.005, respectively). Two comparisons (PLIC versus CR, PP versus PC) were best to distinguish patients and controls and to predict absence or presence of HIE (P < .0001).
CONCLUSION: SI changes due to hypoxia-ischemia can be differentiated from normal myelination by comparing SI of 4 brain structures on T1-weighted images.
MR imaging findings of cerebral damage in infants with hypoxic-ischemic encephalopathy (HIE) have been described in previous studies.1–16 Abnormalities in MR imaging signal-intensity (SI) patterns were found to be related to the severity of asphyxia, usually classified into partial or profound.4,9,14 In addition, the infant's age at the time of the hypoxic-ischemic event has been shown to be of relevance to the patterns of cerebral damage.3,4,9,17 Actively myelinating structures are particularly susceptible to hypoxic-ischemic insults.14,18 In profound asphyxia, MR imaging may show changes in the brain stem, basal ganglia, thalamus, peri-Rolandic cortex (PC), subcortical white matter, and hippocampus.14,18 MR imaging changes due to hypoxic-ischemic cerebral damage can be subtle and difficult to distinguish from normal myelinated areas because both have similar SI increases on T1-weighted images.19–26 The cerebral injury represented by these changes can have important consequences for neurologic development.7,12,13 Differentiation of normal myelination and hypoxic-ischemic cerebral injury is very relevant for prediction of neurologic development.7,12,13
Modern MR imaging techniques such as diffusion-weighted imaging (DWI) and MR spectroscopy have been reported to be sensitive in detecting cerebral damage in HIE.27–37 However, most MR spectroscopy studies focus on prediction of neurologic outcome after perinatal asphyxia and not on the detection of hypoxic-ischemic brain damage.33–37 For DWI, optimal timing of the examination is of utmost importance. Imaging needs to take place within 1 week after the hypoxic-ischemic event because after this time period, interpretation of the DWI changes is intricate.38 However, in very sick young infants, optimal timing of imaging is difficult. In addition, in some cases, the onset and duration of the hypoxic-ischemic event are unknown. We chose to study signs of hypoxic-ischemic damage on T1-weighted images. T1-weighted images can easily be obtained, and timing, as in DWI, is of less importance. MR imaging changes due to hypoxic-ischemic cerebral damage can be subtle and difficult to distinguish from normal myelinated areas because both give similar SI increase on T1-weighted images. Actively myelinating structures are particularly susceptible to hypoxic-ischemic insults. We hypothesized that comparing SI of brain structures might permit differentiation of myelination and hypoxic-ischemic damage on T1-weighted images.
Materials and Methods
Patients
Cerebral MR imaging examinations were collected from all infants born after a gestational age of more than 35 weeks, who had undergone MR imaging between the 1st day after birth and 4 months of age in the period of January 1990–September 2001. The cutoff point of 4 months was chosen because within this period, high SI in the basal ganglia and PC due to hypoxic-ischemic cerebral damage can be confused with high SI due to myelination.39,40 Institutional review board approval was obtained. The review board deemed informed consent not necessary. The infants were classified into 2 groups: a patient group and a control group. The patient group consisted of infants with symptoms of perinatal HIE compatible with HIE stage 2 lasting at least 5 days or HIE stage 3.41 HIE stage 2 indicates a moderate encephalopathy, the infant being lethargic and hypotonic and having seizures. In HIE stage 3, there is a severe encephalopathy, the infant being comatose and severely hypotonic with decreased or absent reflex activity and a severely depressed electroencephalography. After the neonatal period, the medical history was uneventful concerning episodes that might provoke additional cerebral damage. We studied only near-term and term-born infants because there are no clinical criteria to define hypoxia-ischemia accurately in preterm-born infants. The control group consisted of infants without a history of perinatal asphyxia or other episodes that might provoke cerebral damage and without symptoms of HIE. Frequent indications for MR imaging in the control group were chromosomal abnormalities, suspected congenital malformations of the central nervous system such as Chiari malformations, hydrocephalus (with the exclusion of posthemorrhagic hydrocephalus), and micro- or macrocephalia of unknown origin. Infants with more serious neurologic problems were excluded from this study. According to the attending neuroradiologists, brain maturation compared with known time tables and brain parenchyma were normal in all infants from the control group, and in none of the MR imaging examinations were signs of hypoxic-ischemic injury seen.26,39
MR Imaging
Images were obtained with superconducting magnets (Gyroscan ACS-NT 15, Philips Medical Systems, Best, the Netherlands) operating at a field-strength of 1.5T. T1-weighted spin-echo sequences (TR/TE, 205–730/4–16 ms), T2-weighted spin-echo sequences (TR/TE, 1553–5897/80–200 ms), and fluid-attenuated inversion recovery (FLAIR) imaging (TR/TE/TI, 8000/110–120/1860–2000 ms) were performed in all infants in axial planes, and in addition in most infants, T1-weighted spin-echo sequences (TR/TE, 205–730/4–16 ms) were also obtained in sagittal planes. Section thickness ranged from 4–7 mm with an intersection gap of 0.4–0.7 mm. In addition, from 1999 on, DWI by using single-shot spin-echo echo-planar sequences (TR/TE, 5132–5000/74–68 ms with a b-value of 800–1000 s/mm2) were routinely performed in axial planes.
MR Imaging Data Collection
A pediatric neurologist, blinded to the MR images, retrospectively assigned the infants to 1 of the 2 groups on the basis of clinical information by using the criteria mentioned previously. The MR images were retrospectively evaluated by a neuroradiologist and a neonatologist, both experienced in neonatal neuroimaging. These evaluations were done simultaneously. They reached consensus in all MR imaging examinations and were blinded to the clinical history and the study group to which the infants had been assigned.
SI of 19 different brain structures was assessed on T1-weighted images. Myelinated structures were the following: medulla oblongata (MO), cerebellar peduncles (CP), pons (P), mesencephalon (M), ventrolateral thalamus (VT), rest of thalamus (RT), globus pallidus (GP), posterolateral putamen (PP), rest of putamen (RP), head of caudate nucleus (CC), posterior limb of internal capsule (PLIC), corona radiata (CR), centrum semiovale (CS), PC, and visual cortex (VC).19–22,26 Unmyelinated structures were the following: the peripheral white matter zones (peripheral temporal white matter [TW], peripheral occipital white matter [OW], peripheral parietal white matter [PW], and peripheral frontal white matter [FW]). For each structure, the SI was compared with the SI of all other 18 structures (pairwise comparisons). We did not discriminate between normal and abnormal brightness but compared SI on T1-weighted images. SI was scored as lower (SI score, 0), equal (SI score, 1), or higher (SI score, 2) in each comparison, yielding a total SI score for each of the 19 structures in each subject. Thus, the highest possible total SI score for a structure in an individual was 36 (18 × 2), and the lowest possible total SI score was 0. In addition, a mean total SI score was calculated for of each of the 19 structures in both study groups (patients and controls).
Statistical Analysis
To study whether the mean total SI score of a given structure differed significantly between infants from the HIE group and infants from the control group, we used independent samples t tests. Logistic regression, by using a forward stepwise selection procedure (likelihood ratio test), was performed to assess which pairwise comparisons were most useful to distinguish between infants from the HIE group and infants from the control group and to predict the presence or absence of HIE. The Kruskal-Wallis H test was used to test for differences in age among the different categories of infants who were identified after the logistic regression analysis. To test for differences in age between subjects with HIE and control subjects within these groups, we used the nonparametric Wilcoxon rank sum test.
To study if age at imaging influenced the results, we repeated the logistic regression selection procedure separately for infants with ages at imaging of 28 days or younger. A flow chart was made illustrating this prediction rule.
Results
Clinical Data
All 57 infants (35 male, 22 female) underwent MR imaging between the ages of 1 day and 3½ months (104 days). The patient group consisted of 23 infants (16 male); the control group consisted of 34 infants (19 male). Infants from the HIE group underwent the MR imaging examination at an earlier mean age than infants from the control group (HIE group: range, 1–26 days; mean, 7.9 days; median, 6.0 days; control group: range, 1–104 days; mean, 26.3 days; median, 8.0 days), but this difference was not significant (P = .32). Gestational age was not significantly different between the HIE group and control group (HIE group: range, 35+5–42+5 weeks; mean, 39+4; control group: range, 35+0–42+1 weeks; mean, 39+2). In the patient group, there were 20 infants with HIE stage 2, and 3 infants with HIE stage 3.
Signal Intensity of Brain Structures
Figure 1 shows the mean total SI scores of all the 19 structures in the infants from the HIE group and the control infants. In the PLIC, the PP, the PC, and the CR, mean total SI scores differed significantly between the 2 groups. Mean total SI scores for PLIC were, respectively, 22.9 in patients and 32.7 in controls (P = .000), 24.2 versus 29.6 (P = .005) for CR, 23.7 versus 18.6 (P = .000) for PP, and 27.9 versus 22.8 (P = .000) for PC.

Mean total SI scores of all structures on T1-weighted images. There is a statistically significant difference in mean total SI scores between controls and HIE infants for PP, PC, PLIC, and CR.
The comparison of PP versus the PLIC was most discriminative to distinguish infants of the HIE group from those of the control group (likelihood ratio test = 31.54, P < .0001): A higher or equal SI score of the PP compared with the SI score of the PLIC was seen significantly more often in infants from the HIE group than in infants from the control group. Other discriminating comparisons (P < .0001) were PC versus PLIC (higher SI in the PC compared with the PLIC, significantly more often in patients), MO versus PLIC (higher SI in the MO compared with the PLIC, significantly more often in patients), and PC versus CR (higher SI in the PC compared with the CR, significantly more often in patients).
After entering the most discriminating pairwise comparison (PP versus PLIC) in a logistic model (1st step), the pairwise comparison PC versus CR had the most additional discriminating power (P < .0001) (2nd step).
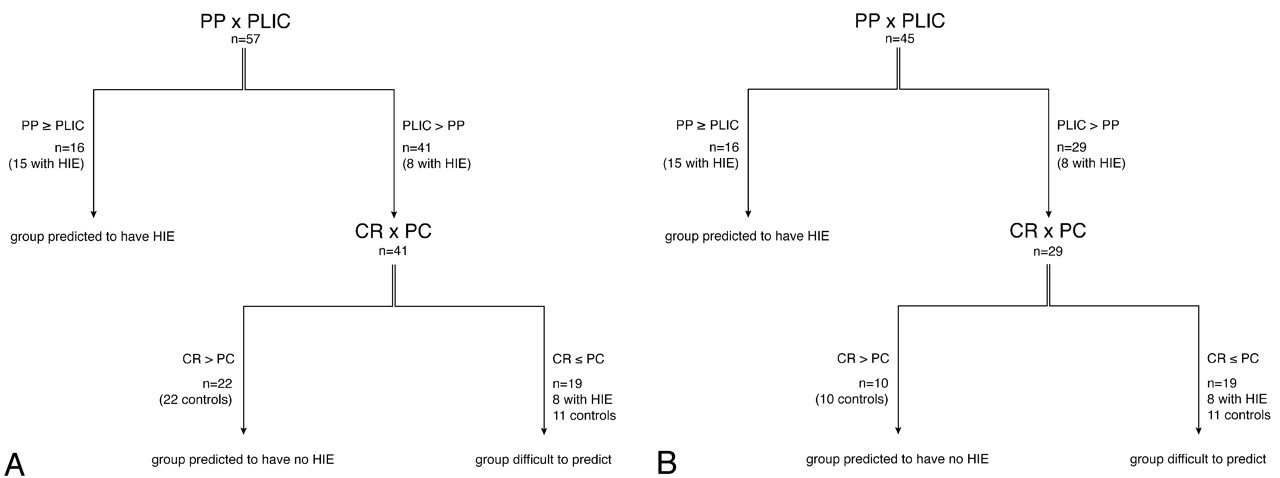
On the basis of the predictions from the logistic regression analysis, we identified 3 categories of infants (Fig 2A):
) These were infants with SI score of the PP > SI score of the PLIC or SI score of the PP = SI score of the PLIC.
) These were infants with SI score of the PP < SI score of the PLIC and SI score of the CR > SI score of the PC.
) The 3rd group consisted of infants with SI score of the PP < SI score of the PLIC and SI score of the CR ≤ SI score of the PC.

A, Flow chart comprising all infants.
B, Flow chart comprising infants with ages at imaging of 28 days or younger.
If we assumed that the subjects in the 3rd group (subjects who were difficult to allocate according to the flow chart) belonged to the control group, positive and negative predictive values were, respectively, 94% and 80%. The results were virtually the same for the subgroup with age at imaging of 28 days or younger (94% and 72%, respectively). If we assumed that the subjects in the 3rd group (subjects who were difficult to allocate according to the flow chart) belonged to the patient group, positive and negative predictive values were, respectively, 66% and 100%. The results were the same for the subgroup with ages at imaging of 28 days or younger.
For the subgroup with ages at imaging of 28 days or younger, comprising 45 infants, the comparison of PP versus PLIC was still the most discriminating comparison (P < .0001), and the comparison of CR versus PC still had a significant additional effect (P < .01) (Fig 2B). No difference in age was found among the 3 categories of infants from the flow chart. Also, no difference in age was found between subjects with HIE and control subjects within these 3 groups. Thus, age at imaging was no reason that 8 infants with HIE could not be categorized in the 1st group. The 10 infants who underwent MR imaging at ages of 28 days or older were all controls and all in the category with low probability to have HIE (all these 10 infants had SI scores of the PP < SI scores of the PLIC and SI scores of the CR > SI scores of the PC). Figures 3–6 show examples of MR images of infants with and without HIE.

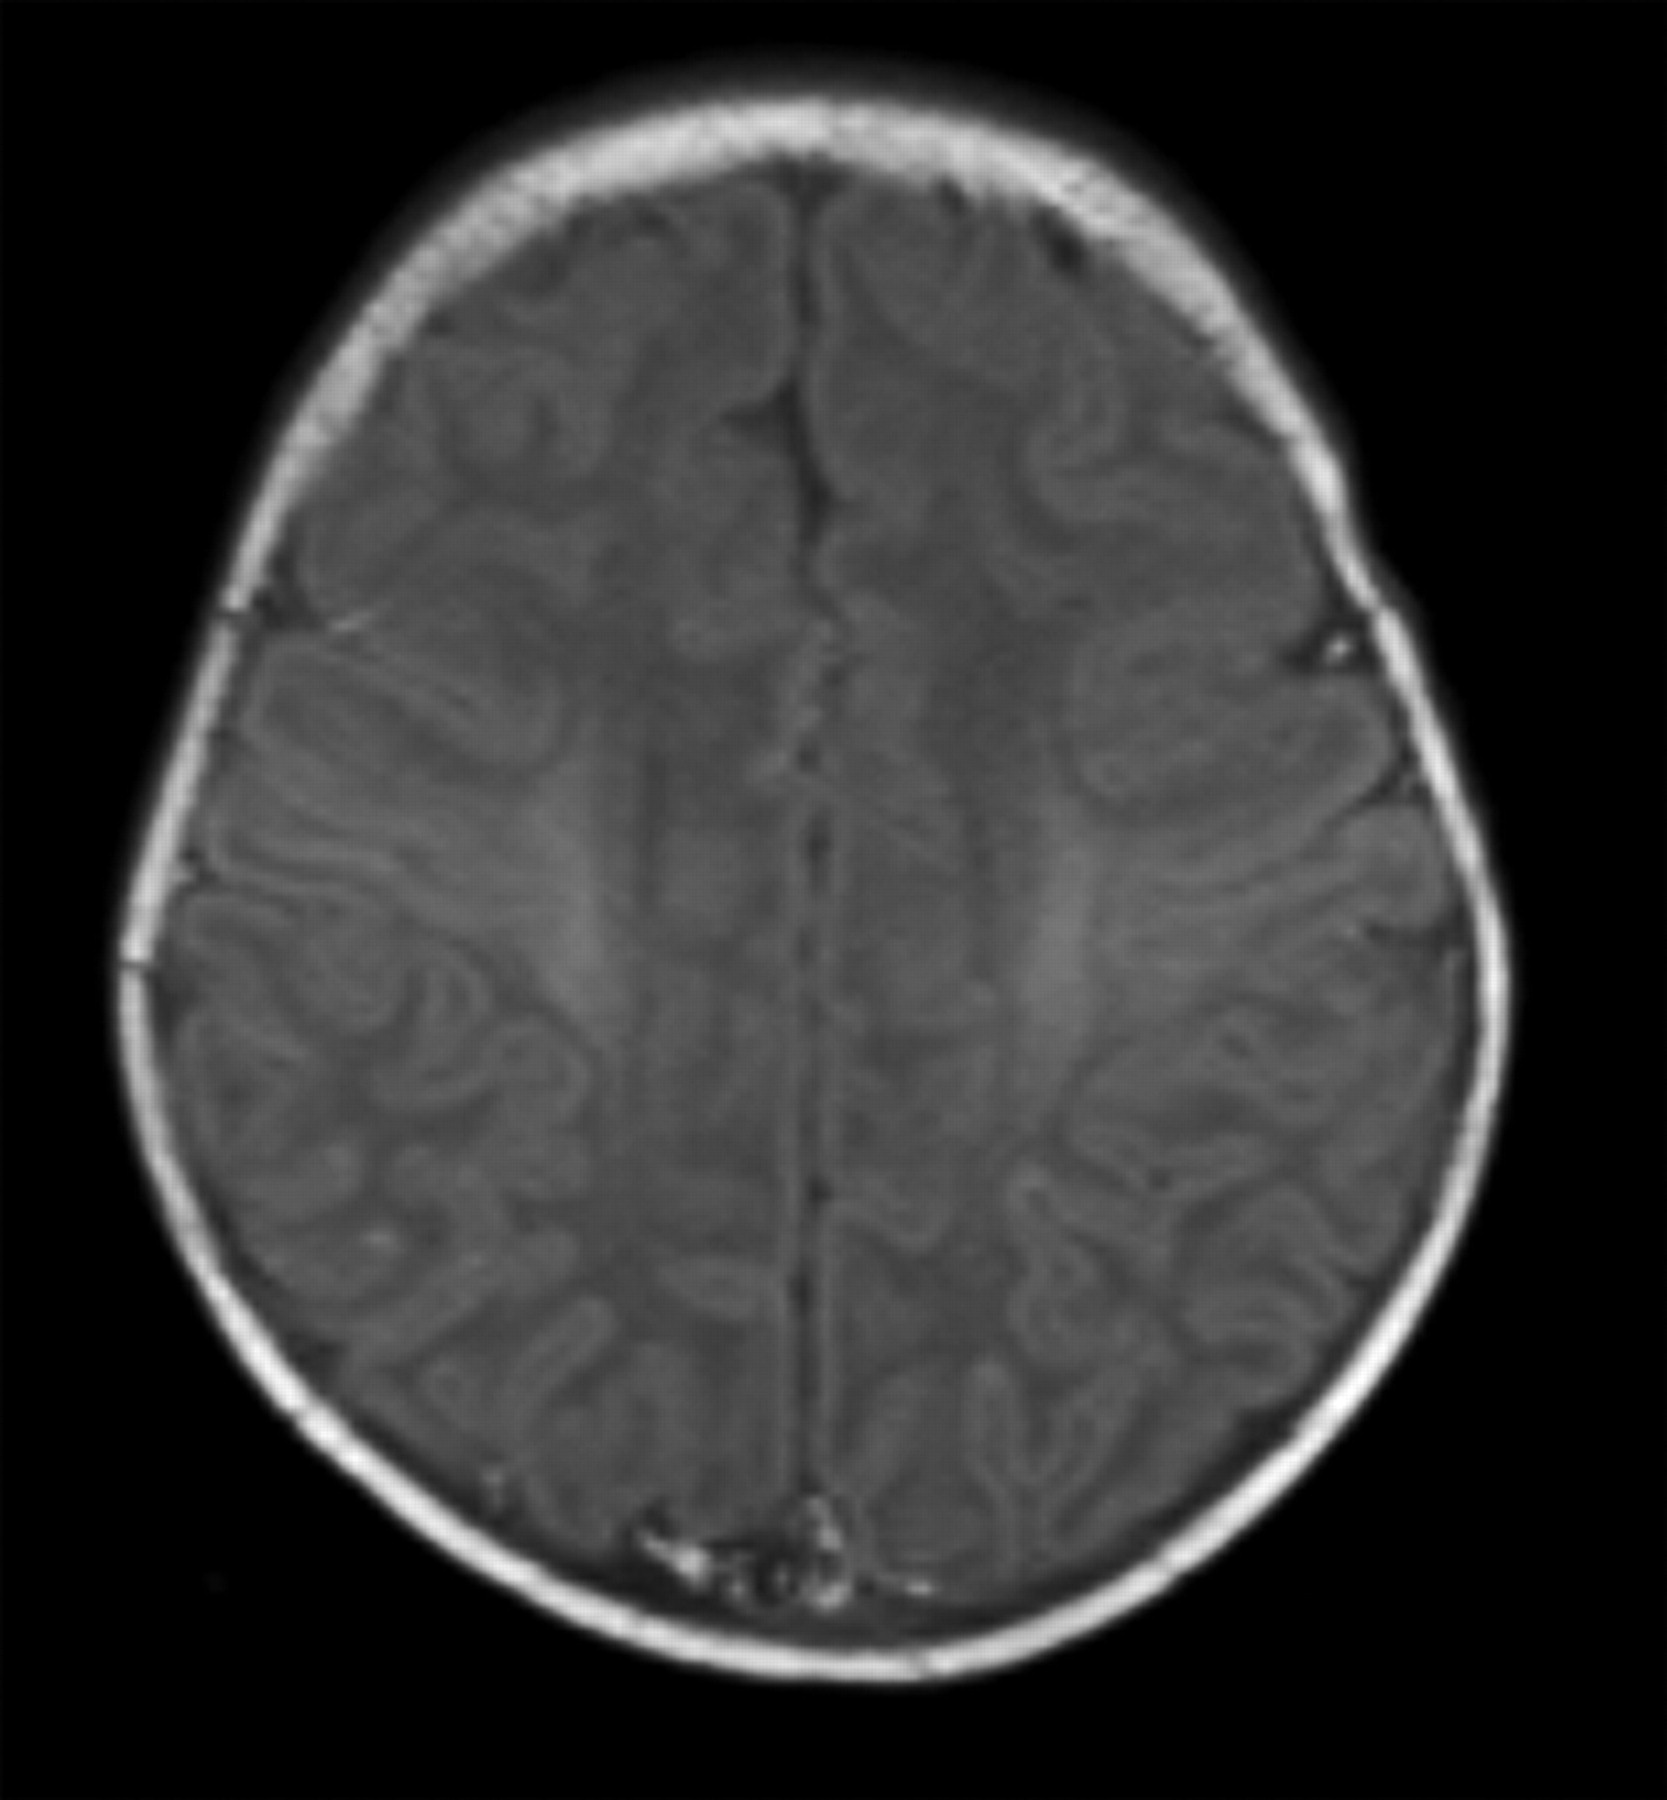
Term-born infant with a closed bifid spine. T1-weighted image (TR/TE, 550/14; signals acquired, 2; matrix, 205 × 256; section thickness, 5 mm; section gap, 0.5 mm; FOV, 16 cm) of the infant from the control group at 2 days of age. The image shows higher SI in the PLIC than in the PP. The flow chart predicted the infant to come from the control group.

Term-born infant with a small dimple at the back and without neurologic symptoms. T1-weighted image (TR/TE, 640/16; signals acquired, 2; matrix, 205 × 256; section thickness, 5 mm; section gap, 0.5 mm; FOV, 16 cm) of the infant from the control group at 8 days of age. The image shows higher SI in the CR than in the PC. The flow chart predicted the infant to come from the control group.

An infant born at a gestational age of 40+4 weeks with cesarean delivery for fetal distress who had an Apgar score of 0–4–5. Resuscitation was required, and there were no brain stem reflexes. T1-weighted image (TR/TE, 550/14; signals acquired, 2; matrix, 205 × 256; section thickness, 5 mm; section gap, 0.5 mm; FOV, 16 cm) of the infant from the HIE group at 3 days of age. The image shows higher SI in the PP than in the PLIC and abnormal SI in the lateral thalami. The flow chart predicted the infant to come from the HIE group.

Term-born infant of a mother with solutio placentae. T1-weighted image (TR/TE, 550/14; signals acquired, 2; matrix, 205 × 256; section thickness, 5 mm; section gap, 0.5 mm; FOV, 16 cm) of the infant from the HIE group at 10 days of age. The image shows higher SI in the PC than in the CR. T1-weighted imaging also showed (not shown here) equal SI in the PP and the PLIC. The flow chart predicted the infant to come from the HIE group.
In all 57 infants, T2-weighted and FLAIR imaging was performed. DWI was performed routinely from 1999 on and was not performed in 16 controls and 4 patients. Of the 57 infants studied, 23 had clinical symptoms of HIE. Findings of the other MR imaging techniques (T2-weighted, FLAIR, and DWI) were normal in 12/23 infants with HIE. Of the 16 infants with HIE who were predicted to have HIE according to the flow chart, 7 had normal findings on T2-weighted, FLAIR, and DWI. Of the remaining 8 infants with HIE who could not be allocated with high predicted probability according to the flow chart, 3 had abnormal findings on T2-weighted, FLAIR, and DWI (infarctions but normal basal ganglia and thalamus and normal PC). Thus, by applying our method (comparing SI on T1-weighted images), 15/23 (65%) infants were correctly predicted to have HIE, and by adding visual analysis of the other MR imaging techniques after comparing SI, another 3/23 infants could be diagnosed as having hypoxic-ischemic brain damage. Thus, by using the 2 methods (SI comparisons and visual analysis), 78% of the infants were correctly diagnosed as having hypoxic-ischemic brain damage. By using the 2 methods, we still could not diagnose 5/23 infants (22%) with HIE as having brain damage. The more severe hypoxic-ischemic damage (basal ganglia and thalamus abnormalities) was only seen in the infants who could be allocated with high probability to have HIE. Of the 15 patients predicted to have HIE, there were 7 infants with basal ganglia and thalamus abnormalities, 1 infant with PC damage, and 1 infant with infarction but normal basal ganglia and PC.
Discussion
This is the first study comparing SI of different brain structure images within the same subject to predict presence of perinatal hypoxic-ischemic brain damage in young infants undergoing MR imaging.
The study was designed to develop a practical method to identify hypoxic-ischemic changes on MR images in individual patients. The method, by using the pairwise comparisons of the flow chart, is applicable on conventional MR imaging techniques and is independent of the MR imaging system. Implementing the flow chart by using 2 comparisons (PP versus PLIC and PC versus CR), we could differentiate infants of the HIE group from controls with high predicted probability (Fig 2A). This implies that in young infants with HIE, conventional T1-weighted images enable distinction of infants with hypoxic-ischemic brain damage from those without brain damage.
We subsequently looked at the other MR imaging sequences. These showed us that our newly developed method of comparing SI on T1-weighted images was more sensitive to detect hypoxic-ischemic injury (in 15/23 infants) than the visual analysis of the other sequences (11/23 of infants). The 2 methods combined (comparing SI on T1-weighted images and visual analysis of the other sequences) enabled us to predict HIE in a high percentage (18/23, 78%) of infants. Age at imaging was no reason that in 8 infants with HIE, no brain damage could be detected. It is possible that these infants with HIE, indeed, did not have brain damage or that abnormalities were so subtle that they remained undetected. Follow-up studies are needed to assess whether our new method enables prediction of neurologic outcome in infants with HIE, this being the main reason for performing MR imaging in these patients. The most severe hypoxic-ischemic brain lesions were only seen in the infants who could be predicted with high probability to have HIE. However, 8/15 (53%) infants who could be predicted to have HIE by using SI comparisons had normal findings on the other sequences. In the difficult-to-allocate group, 5/8 (63%) infants with HIE had normal findings on other MR imaging sequences; this indicated no significant difference.
Many MR imaging sequences and techniques are used in the detection of hypoxic-ischemic brain damage. DWI and MR spectroscopy have been demonstrated to be useful for the detection of perinatal hypoxic-ischemic brain injury,27–37 but to our knowledge, positive and negative predictive values of DWI and MR spectroscopy for presence of hypoxic-ischemic brain injury in young infants have not been reported in the literature.
The results of this study are compatible with those in the literature. In normal full-term-born infants, the posterior half of the PLIC is myelinated at birth and has high SI on T1-weighted images (Fig 3).26,40 Rutherford et al12,13 have reported the loss of this normal high SI in the PLIC in infants with HIE, probably indicating a delay in myelination or injury to previously myelinated tracts. This loss of high SI in the PLIC, though sometimes subtle, is associated with unfavorable outcome.13 The PC is also actively myelinating in the early postnatal period and susceptible to hypoxic-ischemic injury.14,18
A possible limitation of our study is that infants from the HIE group underwent the MR imaging examination at an earlier age than infants from the control group because in the former, infants had more acute medical problems and, in many of them, decisions on continuation or withdrawal of intensive treatment was required. One could argue that the age differences between our 2 groups influenced the data: Some brain structures may have contained less myelin at an earlier age and, therefore, had lower SI on T1-weighted images. However, when looking separately at the infants imaged at an age of 28 days or younger, the comparison of PP versus PLIC was still highly discriminative. Therefore, we think that the results have not been influenced by the differences in age between the 2 groups. The results of the Kruskal-Wallis H test and the nonparametric Wilcoxon rank sum test support this conclusion. We are aware of the fact that our control group did not consist of healthy infants. This may have influenced the results. However, infants from the control group were carefully selected not to have hypoxic-ischemic cerebral damage. The MR images of the control infants, indeed, did not show hypoxic-ischemic brain damage, and maturation was normal. One may expect that in healthy infants, cerebral maturation, including myelination, is at least equal to or more advanced than that in infants with cerebral abnormalities and makes the differences between completely healthy controls and HIE infants even larger.
One could argue that if one applies multiple pair comparisons, the more pairs that are compared, the more likely it is to obtain a significant result “by random chance.” However, our results were highly significant. In a prospective study including clinical follow-up, how the 2-step flow chart will perform in the individual infant should be investigated.
Conclusion
In young infants, SI changes due to hypoxic-ischemic events can be differentiated from normal changes due to myelination on the basis of the comparison of SI of 4 brain structures on T1-weighted images. This finding supports our hypothesis that comparing SI of brain structures permits differentiation of myelination and hypoxic-ischemic damage on T1-weighted images. The comparison of SI between the PP and PLIC is the most distinctive. Additional predictive value is obtained by comparing CR versus PC. Hypoxic-ischemic brain damage is detected in 78% of (near) term infants with HIE, if comparing SI on T1-weighted images is combined with visual analysis of T2-weighted, FLAIR, and DWI.
Footnotes
Paper previously presented at: Scientific Assembly and Annual Meeting of the Radiological Society of North America, November 28–December 3, 2004; Chicago, Ill.
References
- Received March 29, 2006.
- Accepted after revision July 10, 2006.
- Copyright © American Society of Neuroradiology


