
Abstract
BACKGROUND AND PURPOSE: SWI is an MR imaging technique that is very sensitive to hemorrhage. Our goal was to compare SWI and CT to determine if SWI can show traumatic SAH in different parts of the subarachnoid space.
MATERIALS AND METHODS: Twenty acute TBI patients identified by CT with SAH underwent MR imaging scans. Two neuroradiologists analyzed the CT and SWI data to decide whether there were SAHs in 8 anatomical parts of the subarachnoid space.
RESULTS: Fifty-five areas with SAH were identified by both CT and SWI. Ten areas were identified by CT only and 13 by SWI only. SAH was recognized on SWI by its very dark signal intensity surrounded by CSF signal intensity in the sulci or cisterns. Compared with the smooth-looking veins, SAH tended to have a rough boundary and inhomogeneous signal intensity. In many instances, blood in the sulcus left an area of signal intensity loss that had a “triangle” shape. SWI showed 5 more cases of intraventricular hemorrhage than did CT.
CONCLUSIONS: SAH can be recognized by SWI through its signal intensity and unique morphology. SWI can provide complementary information to CT in terms of small amounts of SAH and hemorrhage inside the ventricles.
Abbreviations
- BW
- bandwidth
- FA
- flip angle
- FLAIR
- fluid-attenuated inversion recovery
- FPC
- frontal-parietal convexity
- GRAPPA
- generalized autocalibrating partially parallel acquisition
- HU
- Hounsfield unit
- IHF
- interhemispheric fissure
- IVH
- intraventricular hemorrhage
- kvp
- kilovoltage peak
- MIP
- minimum intensity projection
- PFC
- posterior fossa cisterns
- PMC
- perimesencephalic cistern
- SAH
- subarachnoid hemorrhage
- SVF
- Sylvian fissure
- SWI
- susceptibility-weighted imaging
- T1WI
- T1-weighted imaging
- T2WI
- T2-weighted imaging
- TBI
- traumatic brain injury
- TNC
- tentorial cistern
- TOC
- temporal-occipital convexity
- WM
- white matter
Subarachnoid hemorrhage is a common finding in the setting of acute TBI.1 Traumatic injury to the brain results in stretching, tearing, and laceration of the blood vessels coursing within the subarachnoid space where blood enters the subarachnoid space and mixes with the CSF within the subarachnoid space.2 Hemorrhage can accumulate both in the brain cisterns and fissures as well as in the sulci throughout the brain after injury.3 Intraventricular hemorrhage can also be seen along with SAH, as the CSF spaces are communicating compartments. The incidence of traumatic SAH varies from 11% to 60% in TBI patients.4–7 A few large TBI studies have shown that the amount of SAH significantly correlates with initial TBI presentation and long-term outcomes.4–6
CT has long been considered the first choice in the detection of acute SAH because of its sensitivity, low cost, and wide availability. The sensitivity of CT in detecting SAH is dependent on the resolution of the scanner, the interval after onset, the amount of hemorrhage, and the skills of the radiologist.8 It has been widely accepted by neuroradiologists that MR imaging is insensitive to acute SAH, and the reason why SAH cannot be seen with MR imaging consistently has been attributed to the complex hemorrhagic signal intensity seen on MR imaging.9–11 During the past 15 years, new MR imaging sequences have been developed and their application in detecting SAH at high fields has been explored. Some studies have shown that FLAIR is more sensitive than CT in detecting SAH in the acute stage in vitro and in vivo.12,13 However, hyperintensity in the subarachnoid space on FLAIR can be caused by artifacts such as supplemental oxygen, CSF pulsation, and vascular pulsation rather than SAH.14 On the other hand, gradient-echo sequences have been used in imaging hyperacute SAH in a small number of patients and some think that it can be reliably used to diagnose SAH at 3T.15
SWI is an MR imaging technique that uses tissue magnetic susceptibility differences to generate a unique contrast.16 SWI data are composed of 4 sets of images: the magnitude, the phase, the final processed SWI, and the MIP (often over 4 adjacent sections) images. The original magnitude image is a flow-compensated gradient-echo image but with a long TE. Usually TE is 40 ms at 1.5T and 20 ms at 3T for SWI. These values render the phase images at both field strengths essentially identical because the phase is proportional to the product of the field strength and echo time. The magnitude image in a gradient-echo scan tends to highlight small changes in susceptibility across a voxel as signal intensity loss.17 The SWI phase image is high pass filtered to remove low spatial frequency background field variations. This image is then used to create a mask to highlight the remaining information coming from smaller structures, including veins, hemorrhage, and anatomic structures that contain more iron such as red nucleus and substantia nigra, and calcium deposits.18 The SWI-filtered phase images themselves are also useful. For example, iron and calcium can be differentiated from each other because iron is paramagnetic whereas calcium is diamagnetic. Therefore, similar signals on magnitude images will have opposite phase values (with iron in veins appearing dark while calcium deposits often appear bright for a right-handed system).18 Because phase values range from −π to π, aliasing may occur in areas having very high iron or calcium content. When phase aliases, it changes from dark to bright abruptly and creates a zebra stripe pattern that is easily recognized. This aliasing creates a heterogeneous, discontinuous phase signal intensity. Aliasing also makes it difficult to quantify the amount of iron, though in some cases it is possible to unwrap the phase aliasing by using postprocessing methods.19
SWI has been successfully applied in TBI and has proved to be from 3 to 6 times more sensitive than conventional gradient-echo imaging in detecting parenchymal hemorrhage.20 No study has yet been done by using SWI to evaluate SAH. In this study, we compare CT and SWI in their abilities to detect SAH and determine whether SWI can provide complementary information to CT.
Materials and Methods
Patient Data Collection
From May 2008 to December 2008, patients from the Emergency Department or Trauma Center from Tianjin Huanhu Hospital and Beijing Tiantan Hospital who had closed-head TBI and underwent a CT scan were screened for further MR imaging examination. Patients who had contraindications to MR imaging and previous neurosystemic diseases such as tumor, stroke, and malformation were excluded. Consent from the patient or a legal proxy if the patient was not able to sign was obtained before the MR imaging scan. Sixty TBI patients underwent both CT and MR imaging scans during that period. CT identified 23 TBI patients with SAH. Three of them had poor MR imaging or CT image quality because of motion artifacts and these patients were excluded; this left 20 patients in this study. There were 16 men and 4 women ranging in age from 21 to 73 years old (mean, 42.4 ± 13.8 years). Three were injured from falls and 17 had motor vehicle crashes. Fourteen of them had the CT scan on the same day of injury, 5 the second day, and one 4 days later. Nineteen patients had their MR imaging done within a week of injury and 1 was scanned 12 days after injury (the average time to the MR imaging scan was 5 ± 3 days).
CT Scan Parameters
CT (Somaton; Siemens, Erlangen, Germany) parameters from Tianjin Huanhu Hospital were: x-ray tube current = 360 mA, kvp = 120 kV, convolution kernel H30s (soft tissue window), resolution = 0.5 × 0.5 × 5 mm3, and FOV = 240 mm; from Beijing Tiantan Hospital the parameters were: x-ray tube current = 310 mA, kvp = 120 kV, convolution kernel H31s (soft tissue window), resolution = 0.5 × 0.5 × 4.5 mm3, and FOV = 230 mm.
MR Imaging Scan Parameters
Four MR imaging sequences were collected at 3T (Trio; Siemens), including: T1WI, T2WI, FLAIR, and SWI. The SWI parameters from Tianjin Huanhu Hospital were: TR/TE = 29/20 ms, FA = 15°, BW = 120 Hz/pixel, spatial resolution = 0.5 × 0.5 × 2.0 mm3, FOV = 256 mm, parallel imaging mode = GRAPPA, accelerating factor = 2; from Beijing Tiantan Hospital the parameters were: TR/TE = 28/20 ms, FA = 15°, BW = 120 Hz/pixel, spatial resolution = 0.5 × 0.5 × 2.0 mm3, FOV = 230 mm, parallel imaging mode = GRAPPA, accelerating factor = 2.
Data Evaluation
Conventionally, subarachnoid space is divided into the following major parts: 1) convexity subarachnoid spaces, which cover the surfaces of the brain's hemispheres; 2) Sylvian cistern, which is between the insula and opercula; 3) mesencephalic cisterns, which refer to the area around midbrain, 4) suprasellar (basal) cisterns, which lie above the sella and between the cerebral peduncles; and 5) posterior fossa cisterns, which include the medullary cistern, cisterna magna, pontine cistern, cerebellopontine angle cistern, and superior cerebellar cistern.21
In this study, we did not strictly follow this conventional categorizing method, but rather we divided or combined the above 5 major parts into 8 regions as described below. To start, we divided the convexity subarachnoid spaces into 3 parts: 1) frontal-parietal, 2) temporal-occipital, and 3) interhemispheric cisterns; followed by 4) the Sylvian cistern, 5) the perimesencephalic cisterns (combination of mesencephalic cisterns and basal cisterns), 6) posterior fossa cisterns, 7) tentorial cistern (it is also called superior cerebella cistern and belongs to the posterior fossa cisterns, but it was evaluated separately in our study), and 8) intraventricular hemorrhage. Two neuroradiologists were blinded to all other information except the imaging data. They were required to finish the review of the SWI data before they started to review the CT data. The orders of the cases were arranged randomly for both CT and SWI and the neuroradiologists were blinded to this order. After the 2 neuroradiologists finished reviewing all of the data initially, they then discussed their results and came to an agreement.
The signature of SAH on SWI was a hypointense signal intensity in the sulci and cisterns. The CSF signal intensity was similar to or a little less than that of the brain parenchyma on SWI. The ideal situation would be very dark signal intensity (hemorrhage) surrounded by iso-intense CSF signal intensity in the subarachnoid space. If CSF in the basilar cisterns is obscured by susceptibility artifacts, SWI would fail to identify SAH. The key to identifying SAH in the sulci is to differentiate hemorrhage from veins. One way is to follow a few neighboring sections or to examine a MIP over many sections centered on the region of interest so that the continuity of veins could be evaluated. The second means to differentiate these is that the shape of vessels is regular and smooth and the signals are uniform, while that of hemorrhage is irregular and has a rough boundary and signals are nonuniform. The third means is that if the sulcus is filled with blood, the hemorrhage would have a “triangle” shape. SAH along the tentorium and falx has been differentiated from subdural hemorrhage. If hemorrhage has a bulging shape or smooth edges, subdural hemorrhage would be diagnosed. If hemorrhage inside the paramedian sulci or between folia of the cerebellum is seen, then SAH would be diagnosed.
Results
The number of hemorrhagic areas from 20 TBI patients identified by CT and SWI are shown in the Table. A total of 78 hemorrhagic areas were found combining results from CT and SWI. Fifty-five areas were found by both SWI and CT. Agreement between CT and SWI was 70%. Areas found only by CT were 10 (13%) and only by SWI were 13 (17%). Because there was no criterion standard for validating SAH, we could not determine whether extra cases found only by 1 method or the other were true or false; thus, sensitivity and specificity could not be calculated. Among the 78 hemorrhagic areas, 30 areas (45%) were located at the convexity and interhemisphere, 17 (22%) areas belonged to cisterns, 16 (21%) were tentorial SAH, and 10 (13%) were IVH.
Number of SAH areas identified by CT and SWI
Eleven cases of frontal-parietal convexity SAH were found with CT and SWI, and 4 more were found only by SWI. Two cases of temporal-occipital convexity SAH were found by both CT and SWI, and 1 more was found only by CT. Figure 1 shows 2 cases of TBI patients with SAH at the frontal-parietal convexity. CT shows high attenuation inside the sulci (white arrows) and SWI shows dark signal intensity in the corresponding locations (black arrows). SAH shows a rough boundary and nonuniform signal intensities (black arrows in Fig 1B, -E), while the vein appears smooth and has uniform signal intensity throughout the course of the vessel (long white arrow in Fig 1B).

Two cases with both convexity and interhemispheric fissure SAH. Case 1: CT (A) shows high attenuation in the sulci of the convexity (arrows) and the paramedium sulci (along the centerline). SWI (B) shows SAH with a thick and rough boundary (short arrows and sulci inside the circle), while the vein is smooth and thin (long white arrow). SWI phase image (C) shows aliasing in the paramedian sulci (inside circle). Case 2: CT (D) shows high attenuation in 1 sulcus (white arrow) and falx high attenuation. SWI (E) shows SAH in the same sulcus (black arrow) and hemorrhage in the paramedian sulci (inside circle). SWI phase image (F) shows aliasing in the sulci (inside circle).
Thirteen cases of interhemispheric cistern SAH were found with CT and SWI, 2 more were found by CT only, and another 2 were found by SWI only. The 2 cases in Fig 1 also have hemorrhage in the interhemispheric cistern. In the first case, CT shows hemorrhage inside the paramedian sulci, while in the second case, only a long thin highly attenuated falx is seen. SWI shows dark signal intensity inside the paramedian sulci with a rough boundary (Fig 1B, inside the circle) or with a triangular shape (Fig 1E, inside the circle). The 2 phase images show aliasing from hemorrhage in the paramedian sulci (Fig 1C, -F, inside circles).
Both CT and SWI identified 7 cases with Sylvian cistern hemorrhage. One more case was identified by CT only and another 2 cases were found by SWI only. Figure 2 shows 2 TBI patients who had different amounts of hemorrhage in the Sylvian fissure. In the first case, a large amount of hemorrhage is clearly seen on CT, while SWI only shows small amounts of hemorrhage scattered along the Sylvian fissure. In the second case, CT does not show high attenuation in the right Sylvian fissure, but SWI shows there is a very small amount of hemorrhage (very dark signal intensity) surrounded by CSF (slightly dark signal intensity) (Fig 2E). Phase image shows the aliasing effect in the second case (Fig 2F).

Two cases with Sylvian fissure SAH. Case 1: CT (A) shows a large amount of hemorrhage accumulating in the lateral part of the left Sylvian fissure (white arrow). SWI (B) shows only a small amount of hemorrhage deposited along the Sylvian fissure. SWI phase image (C) shows a similar pattern as in B without obvious aliasing. Case 2: CT (D) does not show high attenuation at the right Sylvian fissure (white arrow). SWI (E) shows a small amount of hemorrhage (black arrow). Phase image (F) shows aliasing effect (white >arrow).
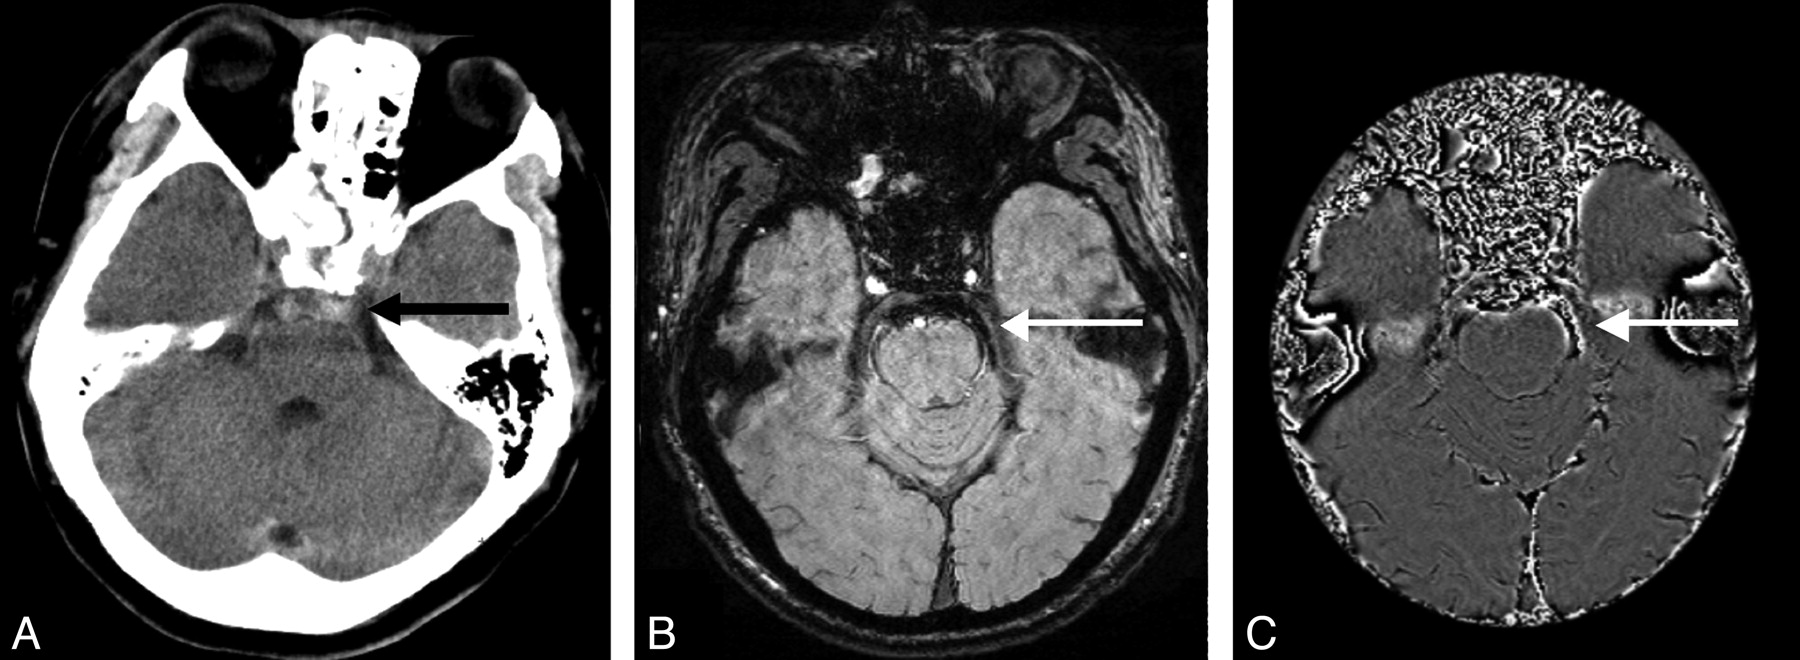
Both CT and SWI identified 1 case of posterior fossa cistern hemorrhage. Two more cases were identified by CT only. Four cases of perimesencephalic cisterns were found by both CT and SWI. Figure 3 shows 1 posterior fossa cistern hemorrhage case identified by both CT and SWI. CT shows a high attenuation in the posterior fossa cisterns (specifically, pontine cistern in this case). SWI shows hemorrhagic signal intensity in front of the pons with CSF signal intensity surrounding the hemorrhage. The filtered SWI phase image shows a heterogeneous signal intensity because of aliasing. In the other 2 cases missed by SWI, artifacts from the sinus obscured the CSF and hemorrhage signal intensity so that the SAH could not be identified.

SAH of the prepontine cistern: CT (A) shows high attenuation in the pontine cistern (black arrow). SWI (B) shows very dark signal intensity at the same location with CSF signal intensity surrounding (white arrow). SWI phase image (C) shows aliasing (white arrow).
Eight patients were found to have tentorial SAH by both CT and SWI. Another 8 cases were found by CT only. Among the 8 cases that were not identified as SAH on SWI, 1 was diagnosed as tentorial subdural hemorrhage, 4 had dark signal intensity in tentoria, but the tentoria were smooth and linear, and 3 had no dark signal intensity in the tentorium at all. Figure 4 shows 3 TBI patients who have high densities in the tentorium on CT but had different signals on SWI. The first case was diagnosed as SAH by both CT and SWI. SWI shows hemorrhage in the tentorial area and the shape of the hemorrhage is irregular (Fig 4B). Hemorrhagic signal intensity is also shown between the folia of the vermis (Fig 4B), which further confirmed SAH. In the second case, hemorrhage in the tentorium has a bulging shape (Fig 4E). SWI magnitude image (Fig 4F) shows 2 smooth edges of the hemorrhage. In the third case, there is no hemorrhagic signal intensity in the tentorial area at all. The small foci of dark signal intensity nearby are microhemorrhages of the parenchyma (Fig 4H).

High attenuation of the tentorium on CT with different signals on SWI on 3 different patients. Case 1: CT (A) shows high attenuation of the tentorium (white arrow). SWI (B) shows irregular hemorrhagic signal intensity on top of the tentorium and in between the cortex of vermis of the cerebellum (black arrow). Phase image (C) shows aliasing effect (white arrow). Case 2: CT (D) shows high attenuation of the tentorium (white arrow). SWI (E) shows bulging dark signal intensity along the tentorium. SWI magnitude image (F) shows 2 smooth lines at the edge of the hemorrhage, indicating subdural hematoma. Case 3: CT (G) shows high attenuation of the tentorium (white arrow). SWI (H) and phase image (I) show no hemorrhage at the tentorial area at all. (The small foci of dark signal intensity near the tentorium in H are microhemorrhages.)
Five cases of IVH were found by both CT and SWI. Five more cases were found by SWI only. IVH can be identified on CT by the high densities in the ventricles. Calcified choroid plexus can also show as high densities inside the ventricles. However, calcification has a much higher HU than hemorrhage (calcium has >100 HU, while hemorrhage has <100 HU). In Fig 5, in the first case, CT identified intraventricular hemorrhage and a calcified choroid plexus above the hemorrhage in the left side. However, SWI shows hemorrhage at both sides; for the second case, CT does not show any sign of IVH, but only 2 calcified choroid plexus, while SWI shows very small amounts of hemorrhage in both posterior horns of the lateral ventricles. Typical fluid levels are seen on SWI (Fig 5D). Among the 5 cases missed by CT, all had very small amounts of hemorrhage.

Two cases with intraventricular hemorrhage. Case 1: CT (A) shows a calcified choroid plexus (long arrow) and hemorrhage (short arrow) in the left posterior horn of the lateral ventricle. SWI (B) shows hemorrhage in both sides of the posterior horn with distinct fluid levels (black arrows) below that are blood. Case 2: CT (C) does not show intraventricular hemorrhage, but only 2 calcified choroid plexus. SWI (D) shows a very small amount of hemorrhage in both posterior horns of the lateral ventricle (arrows).
Discussion
SAH can be shown on CT because blood has a higher attenuation coefficient than the surrounding tissue. The attenuation of blood on CT (as measured in HU) decreases as the hemoglobin concentration decreases.22 When the hemoglobin concentration is <10 g per deciliter, hemorrhage may appear isoattenuated on CT.23 Overall sensitivity in detecting aneurysmal SAH using CT is ∼92% in the first 24 hours, 85% at 5 days, and 50% after 1 week.24,25
It is thought that MR imaging is more sensitive than CT in detecting posttraumatic lesions except for skull fractures and SAH.26 SWI is very sensitive to blood products and has been used to detect parenchymal hemorrhage and was found to be much more sensitive than conventional gradient-echo sequences.20 The subarachnoid space is between brain parenchyma and arachnoid, and most parts of the arachnoid are in contact with the dura and the skull, where susceptibility artifact occurs, except for those parts that fold into sulci. Theoretically, SWI should be sensitive to SAH in the sulci but not to cisterns where bone structures are close by and artifacts occur.
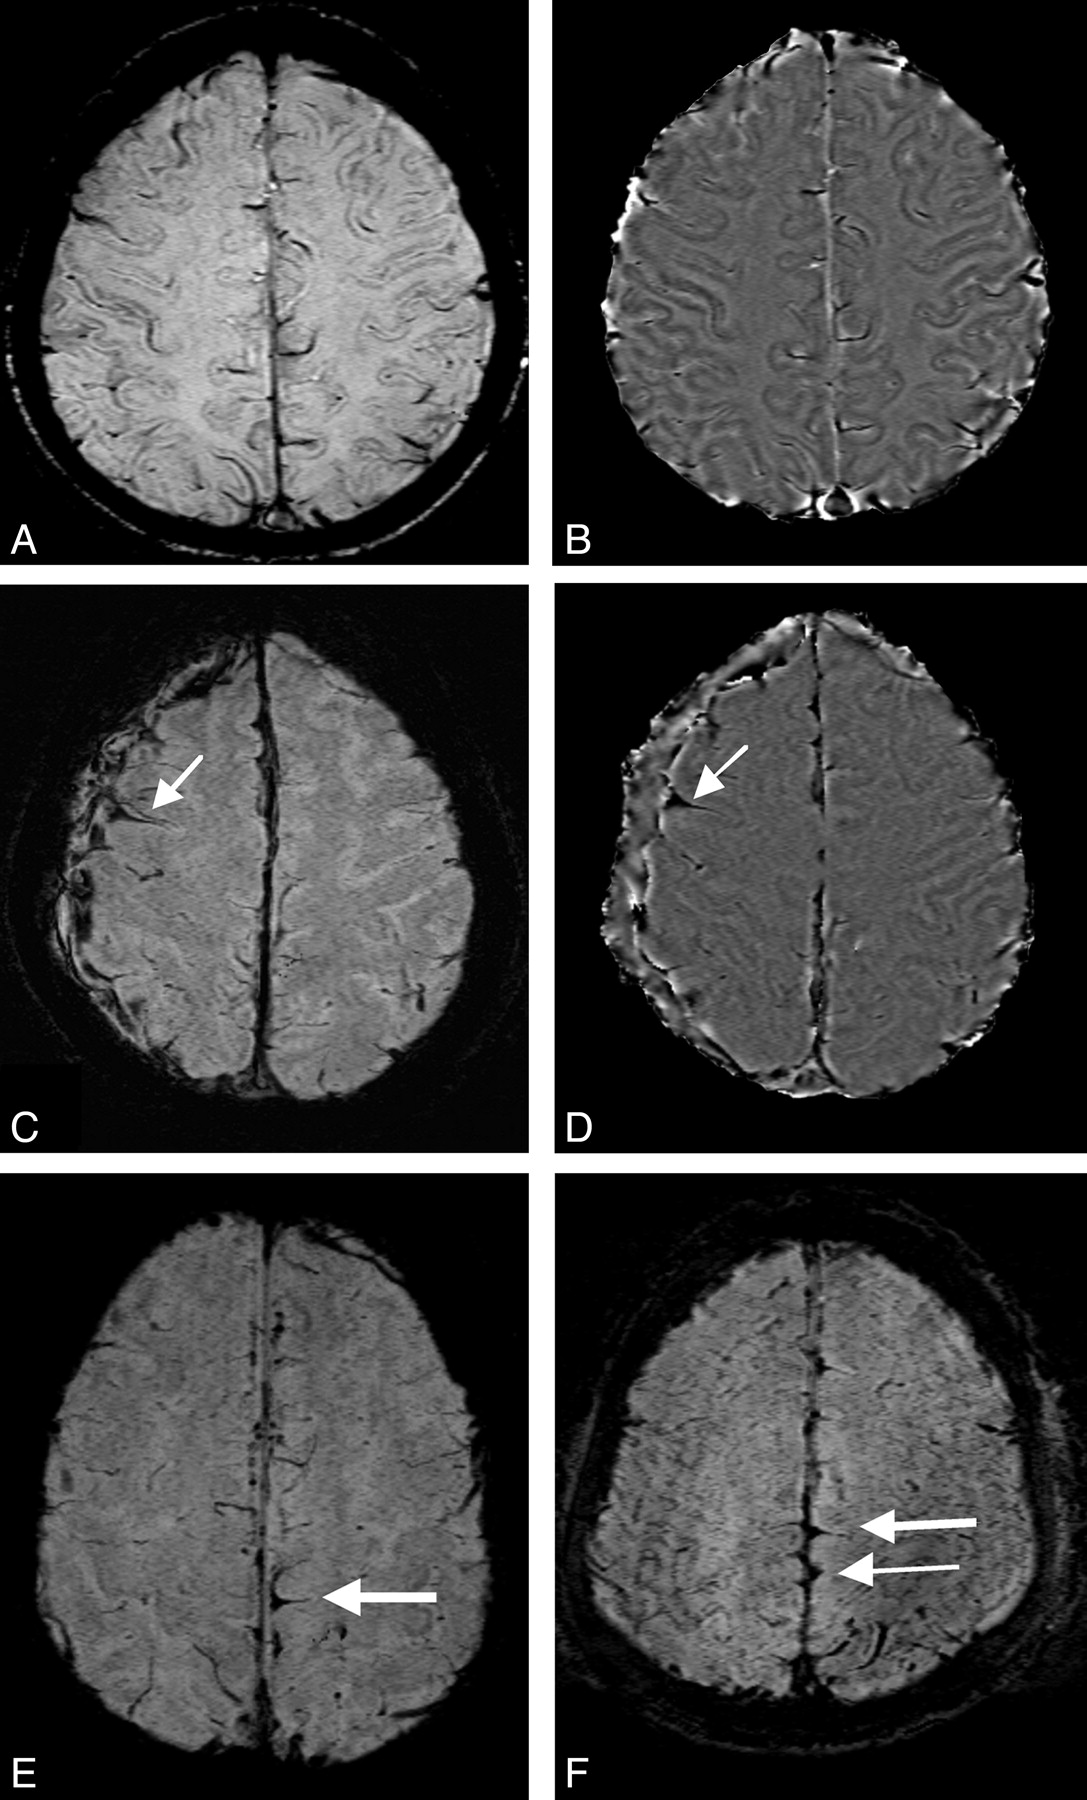
Traumatic SAH occurs more frequently in the cerebral convexities and less often in the Sylvian and basilar cisterns,22 while aneursymal SAH is the opposite. In this study, most cases of SAH were found in the sulci of the convexity and interhemispheric fissure. The key to identify SAH in these regions on SWI is to differentiate SAH from veins because both appear with low signal intensity. Morphologic differences between hemorrhage and veins were observed in our study. As shown in Fig 1B (long white arrow), veins are smooth and have a uniform signal intensity, while hemorrhage has a rough boundary and nonuniform signal intensity. We also observed a “triangle sign” of hemorrhage inside some of the sulci as shown in Fig 1B, -E, which indicates the “filling” effect of blood inside the sulci. Figure 6A, -B depicts the SWI data from a healthy volunteer, where normal sulci, CSF, and veins are shown. CSF appears as a slightly darker signal intensity than parenchyma. None of the veins in this normal volunteer shows a triangular shape. Figure 6C, E, F, shows SWI from 3 different patients, all of which show the “triangle sign” where SAH occurs.

A and B are the SWI and phase image from a healthy volunteer, which show the normal sulci, veins, and falx. Note the interhemispheric fissure has CSF and therefore appears slightly brighter than WM in the phase image. C and D represent a TBI patient showing 1 sulcus filled with blood, creating a typical triangle sign. Additionally, a crescent-shaped subdural hematoma along the right convexity is seen. E and F are 2 other TBI cases showing a similar triangle sign in the paramedian sulci.
High pass-filtered phase images have become a unique part of SWI.27 With a high concentration of iron, such as that present in some hemorrhages,16,17 aliasing can occur. Aliasing has been thought of as an artifact and is usually not desirable. It was incidentally found in our study that most SAH had this artifact in the phase image (Figs 1C, -F;2F; and 3C), while most veins did not. The reason that veins do not alias on phase images is because the deoxyhemoglobin concentration in veins is usually not high enough to cause this effect for TE of 40 ms. This aliasing therefore actually helps differentiate SAH from veins and other tissue, but not all the sulci with SAH had aliasing (for example, Fig 6D). Aliasing artifacts can also be caused by other reasons such as bone-tissue interface, fast flow from the middle cerebral artery, and calcification of the tentorium or falx. These confounding factors make it hard to use phase images alone to diagnose SAH in regions of the basilar cistern, the transverse part of the Sylvian cistern, and the tentorium or falx.
Generally, a high attenuation of the tentorium on CT is assumed to represent SAH.28 However, hyperattenuation of the cerebral tentorium is commonly seen in healthy individuals without any history of trauma29 and this may lead to false-positives in the identification of SAH with CT. It has always been difficult to know how much blood is in the tentorium (subdural) and how much on the tentorium (subarachnoid).30 Fig 7 shows a healthy volunteer's tentorium on SWI and the SWI filtered-phase image. Here the tentorium appears isointense on the SWI and slightly brighter than the surrounding tissue on the phase image (which means that the tentorium is slightly diamagnetic). This suggests that the third case in Fig 4 might be normal. Because we do not have a criterion standard and we only had very limited patients, we cannot determine whether this is true. More studies need to be done to know whether SWI can be used to differentiate normal, subarachnoid, or subural hemorrhage in the tentorium.

A normal volunteer's tentorium appears as isointense on SWI (A) and slightly hyperintense (diamagnetic) on the SWI phase image (B).
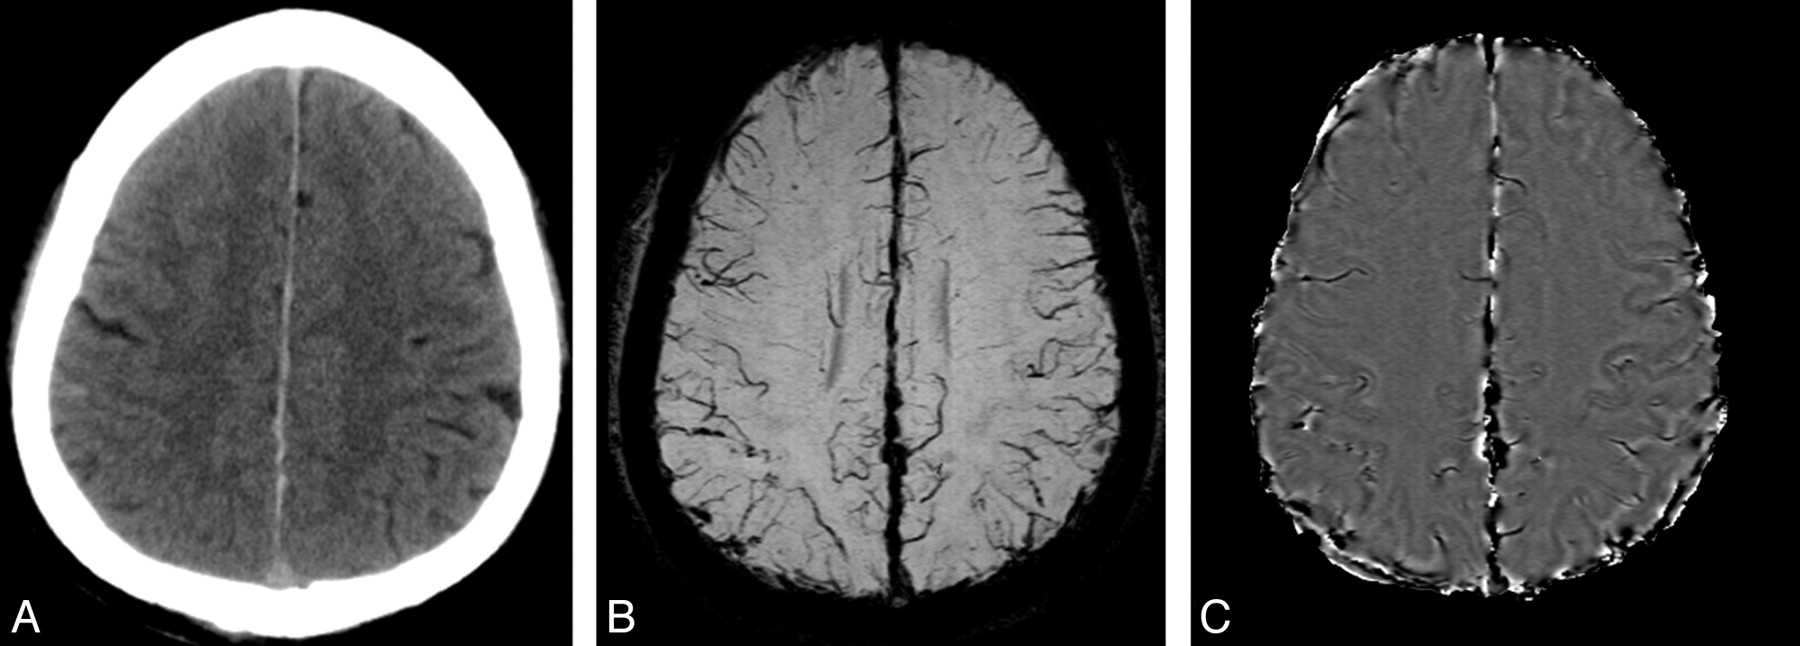
A similar situation is seen in the interhemispheric region. If CT shows blood extending into the sulci along the interhemsipheric fissure, as shown in Fig 1A, it is quite easy to conclude that it is SAH. However, if it is just a long, thin band of increased attenuation in the falx region (the falx sign),4,29,31 the interhemispheric SAH cannot be differentiated from normal falx unless the follow-up CT scans show resolution of this attenuation.29 Fig 1D shows the falx sign on CT. The corresponding SWI data show blood in the sulci along the falx (the triangle sign), which validates SAH in this case. While the same falx sign is seen in Fig 8A, SWI does not show the triangle sign. Instead, SWI shows the irregular bulging shape along the falx. Therefore, it is diagnosed as subdural hemorrhage, rather than SAH.

CT (A) shows high attenuation of the falx, while SWI (B) and phase image (C) do not show the triangle sign, but rather show a bulging effect indicating subdural hemorrhage.
SWI was very sensitive to intraventricular hemorrhage. In this region, there are no susceptibility artifacts or veins. CT did not show hemorrhage in half of the 10 cases, probably because the amount of hemorrhage was too small and due to partial volume effects (the section thickness for CT is of 4.5 to 5 mm). SWI is a high-resolution (0.5 × 0.5 × 2 mm3) sequence, so there is minimal partial volume effect, plus the sequence itself is very sensitive to microhemorrhage due to both T2* and phase information. Although there was no criterion standard to prove that there was blood in the ventricles, the gravitational layering in the ventricles helps to validate this interpretation.
The biggest limitation of this study is that we do not have a criterion standard to determine if the extra cases found by either method individually were true or false. In a sense, CT is the criterion standard because it was used to choose the patients with SAH and it was also used to validate the SWI results when both methods found SAH. We evaluated SAH in different parts of the subarachnoid space in further detail. In vitro or animal studies need to be done to validate our assumptions. The major problem with SWI is the susceptibility artifact from air-tissue interfaces. Only when CSF surrounding the hemorrhage is seen can we confidently conclude that SAH is present. Another shortcoming of the study is that the CT data and MR imaging data were not acquired on the same day in most cases. It is possible that the amount of hemorrhage can change over time. For example, the first case in Fig 2 is a patient who had CT done 1 day after injury and MR imaging done 2 days after injury. CT shows a large amount of hemorrhage along the Sylvian cistern, but SWI shows only microhemorrhages along the lateral fissure. This could be related to the hemorrhage resolving with time. Finally, the orientation between CT and MR images was different. The 2 radiologists could check the neighboring sections when 1 particular region was studied, but it was difficult to put all of the sections in 1 figure for the readers.
Conclusions
SWI is better than CT in detecting intraventricular hemorrhage. SWI is very sensitive to small amounts of SAH. Aliasing on phase images could be used to help differentiate SAH from veins. However, SWI is not good in detecting basilar cistern SAH. Overall, we think that SWI has the potential to provide complementary information to CT in imaging traumatic SAH.
Footnotes
-
This work was supported in part by National Institutes of Health Award NHLBI R01HL062983. The content is solely the responsibility of the authors and does not necessarily represent the official views of the National Heart, Lung, and Blood Institute or the National Institutes of Health.
Indicates open access to non-subscribers at www.ajnr.org
References
- Received July 22, 2009.
- Accepted after revision November 23, 2009.
- Copyright © American Society of Neuroradiology
In this issue


Jump to section
Related Articles
Cited By...
- Traumatic subarachnoid hemorrhage: a scoping review
- Detection of aneurysmal subarachnoid hemorrhage 3 months after initial bleeding: evaluation of T2* and FLAIR MR sequences at 3 T in comparison with initial non-enhanced CT as a gold standard
- Double Inversion Recovery MR Sequence for the Detection of Subacute Subarachnoid Hemorrhage
- Detection of Microhemorrhage in Posterior Reversible Encephalopathy Syndrome Using Susceptibility-Weighted Imaging