
Abstract
BACKGROUND AND PURPOSE: Because we had previously observed geometric changes of frontal lobe association pathways in children with ASD, in the present study we analyzed the curvature of these white matter pathways by using an objective TBM analysis.
MATERIALS AND METHODS: Diffusion tensor imaging was performed in 32 children with ASD and 14 children with typical development. Curvature, FA, AD, and RD of bilateral AF, UF, and gCC were investigated by using the TBM group analysis assessed by PFDR for multiple comparisons.
RESULTS: Significantly higher curvatures were found in children with ASD, especially at the parietotemporal junction for AF (left, PFDR < .001; right, PFDR < .01), at the frontotemporal junction for UF (left, PFDR < .005; right, PFDR < .03), and at the midline of the gCC (PFDR < .0001). RD was significantly higher in children with ASD at the same bending regions of AF (left, PFDR < .03, right, PFDR < .02), UF (left, PFDR < .04), and gCC (PFDR < .01).
CONCLUSIONS: Higher curvature and curvature-dependent RD changes in children with ASD may be the result of higher attenuation of thinner axons in these frontal lobe tracts.
Abbreviations
- AD
- axial diffusivity
- AF
- arcuate fasciculus
- ASD
- autism spectrum disorders
- CC
- corpus callosum
- Cg
- cingulum
- DTI
- diffusion tensor imaging
- FA
- fractional anisotropy
- gCC
- genu of corpus callosum
- GM
- gray matter
- MD
- mean diffusivity
- MNI
- Montreal Neurologic Institute
- PFDR
- false discovery rate P value
- RD
- radial diffusivity
- ROI
- region of interest
- TBM
- tract-based morphometry
- TD
- typically developing
- UF
- uncinate fasciculus
ASD are neurodevelopmental disorders behaviorally characterized by impaired language and reciprocal social interaction, accompanied by repetitive and stereotypical behaviors. Although conventional neuroimaging in patients with ASD has failed to identify specific abnormalities, several MR DTI studies1–7 have reported abnormalities of white matter structure, including changes in FA, MD, AD, and RD. Significant changes in these parameters were reported in several major white matter tracts, such as the gCC, AF, UF, internal capsule, external capsule, forceps minor, and corticospinal tract.
In addition to changes in diffusion parameters, potential changes in tract geometry (length, attenuation, and volume) were suggested previously based upon conventional tractography methods from our group.6 Children with ASD showed shorter length of left UF; increased length, volume, and attenuation of right UF; increased length and attenuation of CC; and higher attenuation of left Cg compared with TD children.6 Furthermore, the display of conventional streamline tractography8 showed that the right UF in children with ASD seemed to course beyond the temporal lobe and then turned sharply into the temporal cortex. Based on this observation, we presumed that objective investigation of the geometry and morphometry of these fiber pathways might provide additional insight into the neuronal organization and morphology associated with ASD.
Here, we used TBM analysis to differentiate alterations in the curvature (ie, first eigenvector change per unit length) of major frontal lobe tracts in children with ASD. The TBM analysis9 was originally proposed to investigate subtle alterations in diffusivity parameters of bilateral AF and Cg in normal adults. This method spatially normalizes the fibers of multiple subjects in standard space and then registers the coordinates of individual fibers to those of a group standard fiber, followed by statistical analysis of diffusivity parameters only at the common coordinates of group subjects.
Unlike other DTI analyses such as tract-based spatial statistics10 and tissue-specific smoothing-compensated voxel-based analysis11 that use diffusion map (eg, FA or b0 image) for voxel-wise intersubject registration, the TBM analysis uses native white matter trajectory to register spatial coordinates of an individual subject's tracts to a common coordinate system that represents a given population. Thus, TBM provides a feasible way to evaluate the curvature of individual tracts at any point of their course in 3D space. Also, it may result in lower error rates in registering DTI parameters across subjects, which highly depends on the differences of individual white matter tract morphology. Furthermore, statistical analysis of DTI parameters at the common coordinate system may enhance the reliability of group comparison because the parameter values are directly sampled at anatomically equivalent tract points.
Here, we analyzed the curvature of the major frontal white matter pathways, including bilateral AF, UF, and gCC, by using an objective TBM analysis, in children with ASD. We also evaluated how the changes in curvature of these tracts relate to various diffusion parameters, such as FA, AD, and RD.
Materials and Methods
Subjects
Thirty-two children with a diagnosis of ASD (mean age, 58.8 ± 22.64 months; 29 males) and 14 TD children (mean age, 67.36 ± 23.81 months; 11 males; data from this group of children were reported in Kumar et al 20106) underwent MR imaging with DTI and developmental-behavioral assessments. All the patients had been referred to the Children's Hospital of Michigan Neurology Clinic. The inclusion criteria for the ASD group included the following: 1) a diagnosis of autistic disorder, Asperger disorder, or pervasive developmental disorder not otherwise specified made by pediatric neurologists by using the Diagnostic and Statistical Manual of Mental Disorders, 4th edition, text revision criteria; 2) scores >15 on the Social Communication Questionnaire12; and 3) scores >85 on the autism quotient of the Gilliam Autism Rating Scales.13
We did not attempt to distinguish between different diagnostic categories within the ASD group, because current data do not support the notion that strictly behaviorally defined autism is a homogeneous disorder. Conversely, persons on the spectrum in different categories may have a common underlying etiology.14 Therefore, the aim of the present study was to investigate the neurobiology underlying autistic features.
Inclusion criteria for the TD group included the following: 1) measured intellectual functioning within normal limits (≥85), 2) normal neurologic screening, and 3) absence of any current or historical medical or psychiatric diagnoses. TD children were obtained through active recruitment. Children with any of the following were excluded from the study: 1) history of seizures, 2) focal deficits on clinical examination by a pediatric neurologist, 3) MR imaging interpreted as abnormal by a pediatric neuroradiologist, 4) dysmorphic features suggestive of a genetic syndrome, 5) history of prematurity or perinatal hypoxic-ischemic event, and 6) an inborn error of metabolism.
All children in the study were right-handed. The groups did not differ on age (P = .25) or sex (P = .27). Because the scans of children with ASD were clinical MR imaging studies, sedation was used as necessary by the sedation team at Children's Hospital of Michigan. None of the TD children were sedated for the MR imaging. Younger children were scanned while sleeping, and all children were monitored for movement during scan. If there was significant movement, either MR imaging was repeated or the subject was removed from the study. Written and informed consent was obtained from 1 of the parents or legal guardians of the TD participants. The Human Investigations Committee at Wayne State University granted permission for the retrieval and analysis of the clinical data and MR imaging scans of ASD children.
DTI Acquisition
All DTI scans were performed on a 3T Signa scanner (GE Healthcare, Milwaukee, Wisconsin) equipped with an 8-channel head coil at TR = 1250 ms, TI = 88.7 ms, FOV = 240 cm, 128 × 128 acquisition matrix (nominal resolution = 1.89 mm), contiguous 3 mm thickness to cover entire axial sections of whole brain by using 6 isotropic gradient directions with b = 1000 s/mm2, 1 b = 0 acquisition, and NEX = 6 to increase the signal intensity–to-noise ratio and to reduce artifacts. Approximate scanning time for the DTI acquisition was 9 minutes by using a double refocusing pulse sequence to reduce eddy current artifacts. Array spatial sensitivity encoding technique also was applied to further reduce geometric distortion due to the sequence design.
To secure uniform quality of DTI data across the subjects, the b = 1000-s/mm2 images were corrected for eddy current distortion and any potential movements during the DTI acquisition. We used the FMRIB Software Library module for this correction (The Oxford Centre for Functional Magnetic Resonance Imaging of the Brain Software Library, http://www.fmrib.ox.ac.uk/fsl/fdt). The correction relies on a 12-parameter affine transformation.
DTI Analysis
Spatial Normalization of DTI Parameter Maps and Whole-Brain Tractography.
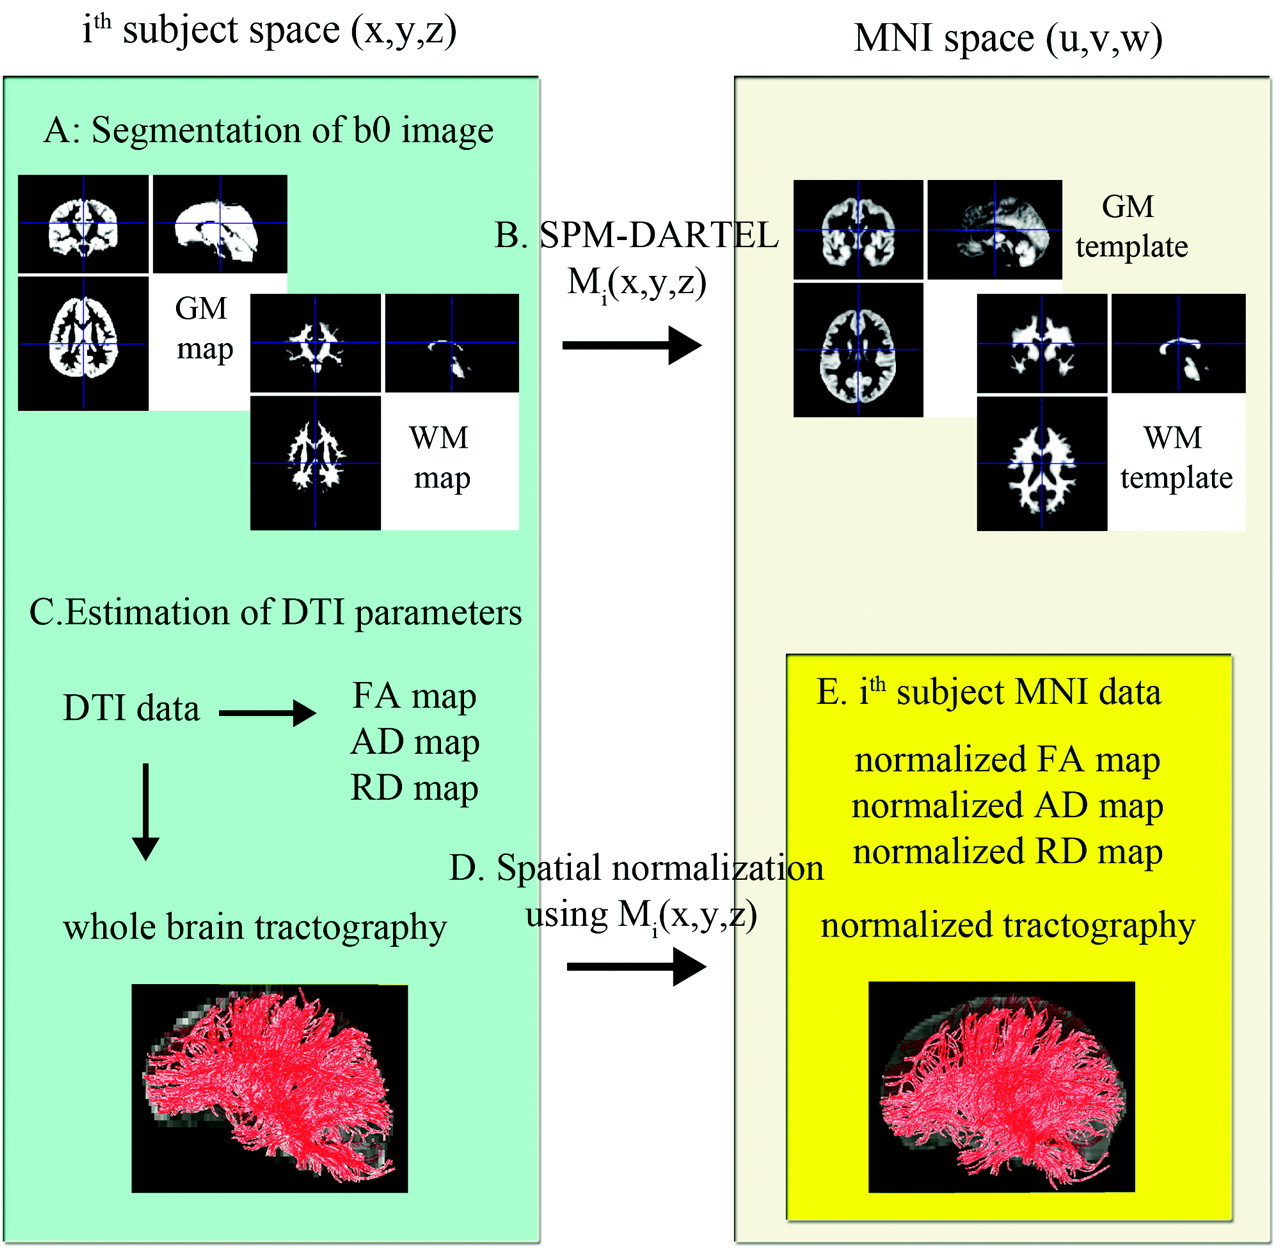
The block diagram in Fig 1 illustrates the overall steps to normalize DTI parameters across subjects in MNI space. To estimate nonlinear deformation field between native space (x, y, z) and standard MNI space (u, v, w), the GM and white matter maps of individual subjects were spatially normalized to those of the TD group by using the SPM DARTEL approach.15 That is, for a given ith subject, tissue probability maps (ie, GM and white matter) were first segmented from the B0 image by using the SPM segmentation module. Then, each tissue map was iteratively aligned and deformed to the corresponding map of the TD group, resulting in a nonlinear deformation field to register the voxels of native space to those of the TD population space. A composite of this nonlinear deformation field and an affine transformation between the GM coordinates of the TD space and those of the pediatric MNI space16 was used as a final deformation field, Mi(x, y, z), which was defined as point-to-point mapping between the coordinates of native space and those of MNI space.

Steps involved in normalizing diffusion tensor data and whole-brain fiber tracts: Left and right blocks indicate the subject's native space (x, y, z) and the MNI space (u, v, w), respectively. A, Initially each subject's B0 image was segmented into the probability maps of GM and white matter in native space. B, Resulting tissue maps were normalized onto corresponding pediatric probability templates in the MNI space via the SPM DARTEL deformation field, Mi(x, y, z). C, Diffusion tensor calculation and whole brain white matter tractography were performed in each subject. D, Resulting FA, AD, and RD maps and the tractography results (whole-brain fiber tracts) were transferred to the MNI space by using a deformation field generated during the initial step [via point-to-point mapping of Mi(x, y, z)]. E, Normalized tractography was used to isolate individual fiber tracts by using “atlas-based tract filtering.” Finally, the isolated fiber tracts and normalized diffusivity maps were subjected to TBM analyses.
Spatial maps of diffusion tensor at every voxel of native space (x, y, z) were evaluated from DTI data by using an in-house implemented software incorporating a signal intensity–to-noise-ratio–weighed multivariate least square fitting approach.17 Based on the first eigen vector, v1, and 3 eigenvalues (λ1,λ2,λ3) of the diffusion tensor matrix, diffusion parameter maps, including FA = [3×variance of (λ1,λ2,λ3)/(λ12+λ22+λ32)]1/2, AD = λ1, and RD = (λ2+λ3)/2, were reconstructed at every voxel of native space.18 Whole-brain tractography was conducted per subject of each group by using conventional streamline tractography based on Runge-Kutta order 2 interpolation at FA >0.20, angular deflection <60°, and step size = 0.2 mm.
The deformation field Mi(x, y, z) of individual subjects was then applied for the spatial normalization of all DTI parameters, including FA, AD, RD, and whole-brain tractography [ie, the (x, y, z) coordinates of individual parameters in native space can be transferred to the corresponding (u, v, w) coordinates in MNI space via the Mi(x, y, z)]. We used the Frenet equation to measure the scale-free fiber curvature for normalized tracts.19 For a given fiber x(s), the curvature was measured by absolute magnitude of the first derivative of tangent vector, T(s), at spatial coordinate, s:
 where T(s) is defined by a gradient of x(s) (ie, dx/ds).
Atlas-Based Tract Filtering.
To isolate the frontal lobe tracts of interest, the normalized whole-brain tracts of individual subjects were systematically sorted by using atlas-based ROIs defined in Anatomical Automatic Labeling map.20 A pair of ROIs was selected to sort the fibers in each tract (ie, inferior frontal operculum and middle temporal region for AF, middle orbitofrontal region, and superior temporal pole for UF, and left superior orbitofrontal and right superior orbitofrontal regions for gCC). The sorted fibers of individual subjects were then pooled to form a group bundle. To ensure the consistency of individual fibers in the group pool, a group consistency map was computed by summing up the number of fibers penetrating individual voxels. This map approximates local fiber attenuation at every voxel. The voxels in which the fibers passed through in at least half of the subjects of each group were assumed to represent a “consistent pathway.” The fibers existing inside the consistent pathway were subsequently considered for the group bundle that is used as an input to the subsequent TBM analysis.
TBM Analysis.
The TBM analysis is a coordinate-wise statistical analysis to compare DTI parameters of multiple subjects at a common coordinate system of a specific fiber bundle.9 Initially, the most representative fiber from a given fiber bundle is selected as “prototype fiber.” Uniformly sampled points on the prototype define the common coordinates, s. Independent statistical tests are performed at these common coordinates.
Here, the longest fiber penetrating the highest fiber attenuation region of a given fiber bundle in the TD group was selected as a prototype for that particular bundle and was used to define the common arc-length coordinates for that bundle. Common coordinates were placed every 2-mm arc-length of the prototype fiber (ie, 2-mm arc-length approximates single voxel size, ≈1.89 mm). These coordinates were used as “reference points” to register the corresponding coordinates of individual fibers of the respective tracts in each subject by using the Hungarian matching algorithm.9,21 Subsequently, the DTI parameters (curvature, FA, AD, and RD) of each fiber tract at each coordinate were evaluated in each subject, and group differences were examined by 2-sample t test. We assessed PFDR for multiple comparisons.22
Results
Curvature TBM Analysis
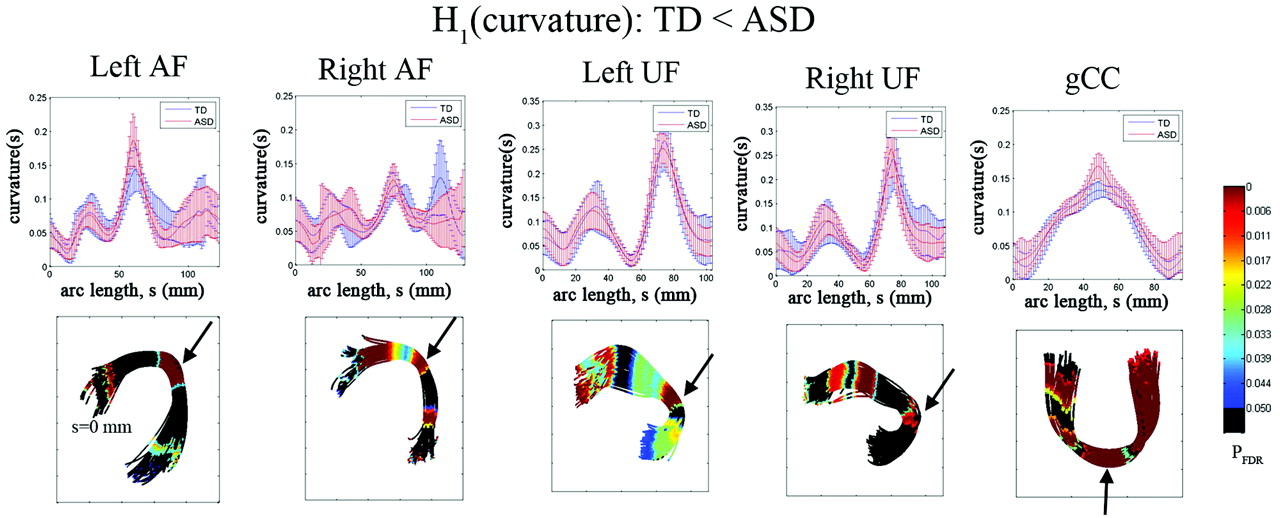
The TBM group comparisons of curvature are presented in Fig 2. For each common arc-length coordinate of individual fiber bundles, the curvature values of all registered fibers were evaluated by using equation 1 and compared across the groups. The group mean and SD are presented in the plot (blue for TD and red for ASD). The coordinates showing significant group difference (H1[curvature]: TD < ASD at PFDR < .05) are appropriately color-coded at every 2-mm common arc-length coordinate for the entire pathway. The TBM analysis identified focal coordinates showing higher curvature in the ASD group. As indicated by black arrows in Fig 2, the bending regions of individual pathways showed higher curvature. That is, the curvature is apparently increased at the parietotemporal junction for bilateral AF (left, ASD versus TD = 0.18 ± 0.03 versus 0.14 ± 0.03, PFDR < .001; right, ASD versus TD = 0.12 ± 0.02 versus 0.10 ± 0.02, PFDR = .01), at the frontotemporal junction for bilateral UF (left, ASD versus TD = 0.18 ± 0.05 versus 0.16 ± 0.04, PFDR = .005; right, ASD versus TD = 0.26 ± 0.06 versus 0.22 ± 0.06, PFDR = .03), and at the midline of the gCC (ASD versus TD = 0.17 ± 0.02 versus 0.13 ± 0.01, PFDR < .0001). Table 1 summarizes the locations of junctions in MNI space, showing higher curvature in the children with ASD.

Fiber tract curvature estimates from TBM analysis for AF, UF, and gCC. Top panel: group mean and SD of fiber curvature at each common arc-length coordinate are plotted at the respective common coordinates. Bottom panel: for the comparison TD curvature is less than in the ASD group, the multiple-comparison PFDR value for the group difference in fiber curvature at each common arc-length coordinate is overlaid on a respective TD group fiber bundle. The regions with the highest P values are marked with an arrow. Note that we define the first common arc-length coordinate (s = 0) at the anterior region for both AF and UF. The first common arc-length coordinate of the gCC is defined in the right hemisphere, which is the left side of the tract display.
Locations of common arc-length coordinates with the highest curvature differences between the TD and ASD groups
Diffusivity TBM Analysis
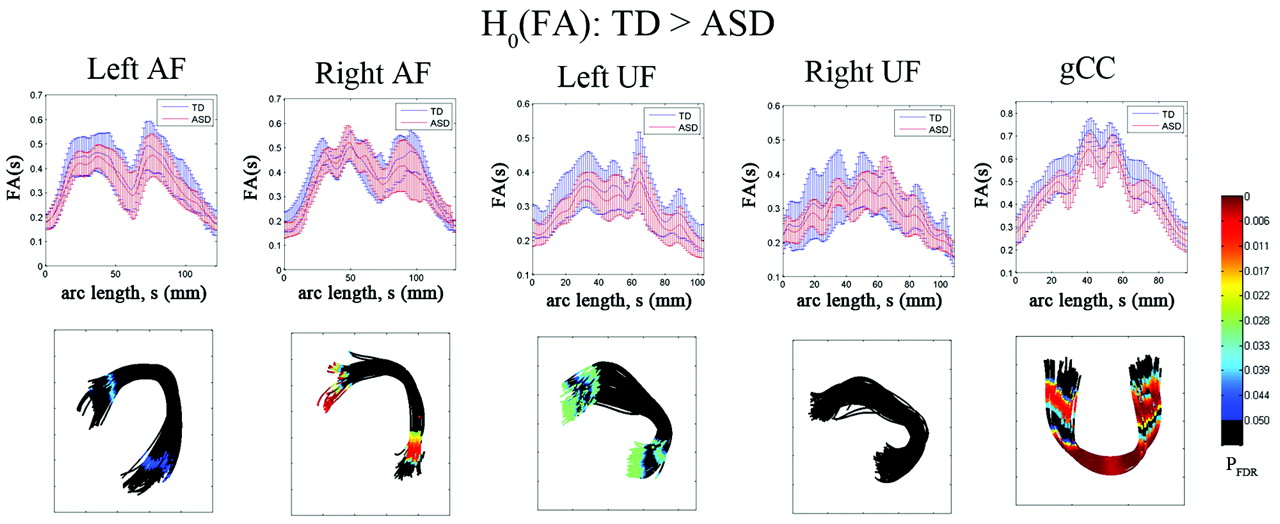
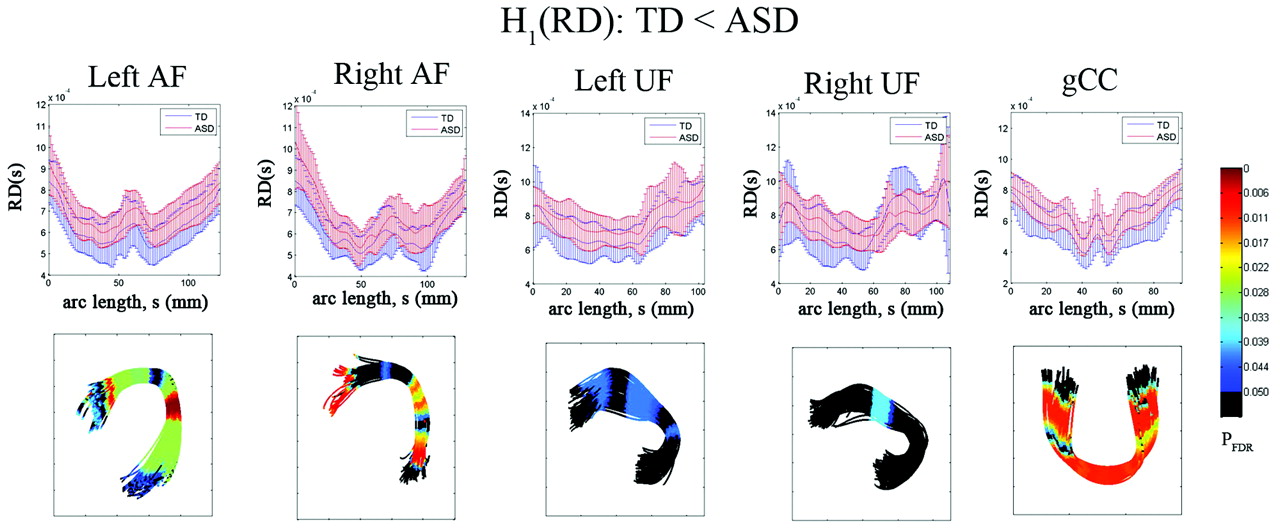
The results of the diffusivity analysis are presented in Fig 3. The FA was significantly reduced in children with ASD at 2 distinct focal regions, inferior frontal and middle temporal regions, of bilateral AF (PFDR < .04). Similarly, the anterior and posterior ends of left UF showed significant group differences in FA (decreased in children with ASD, PFDR = .041). The ASD group also exhibited significantly reduced FA in the central portion of gCC (PFDR = .0005). The TBM analysis of RD is presented in Fig 4. The children with ASD showed higher RD at most arc-length coordinates of individual pathways, especially in bilateral AF (PFDR < .025), left UF (PFDR < .04), and gCC (PFDR < .015). However, no group difference was found in AD for any of the tracts.

Fiber tract FA estimates from TBM analysis for AF, UF, and gCC. Top panel: group mean and SD of FA at each common arc-length coordinate are plotted at the respective common coordinates. Bottom panel: for the comparison of the TD group FA is greater than in the ASD group, the multiple-comparison PFDR value for the group difference in fiber curvature at each common arc-length coordinate is overlaid on a respective TD group fiber bundle. Note that we define the first common arc-length coordinate (s = 0) at the anterior region for both AF and UF. The first common arc-length coordinate of the gCC is defined in the right hemisphere, which is the left side of the tract display.

Fiber tract radial diffusivity estimates from TBM analysis for AF, UF, and gCC. Top panel: group mean and SD of RD at each common arc-length coordinate are plotted at the respective common coordinates. Bottom panel: for the comparison of the TD group RD is less than in the ASD group, the multiple-comparison PFDR value for the group difference in fiber curvature at each common arc-length coordinate is overlaid on a respective TD group fiber bundle. Note that we define the first common arc-length coordinate (s = 0) at the anterior region for both AF and UF. The first common arc-length coordinate of the gCC is defined in the right hemisphere, which is the left side of the tract display.
Relationship between Curvature and Diffusivity
Interestingly, we found high correlations between the values of curvature and diffusivity parameters (FA and RD) that were sampled from the same bending regions of bilateral AF, UF, and gCC of both groups. There was significant negative correlation between curvature and FA (increased curvature and decreased FA) and positive correlation between curvature and RD (increased curvature and increased RD) at bilateral AF, UF, and gCC (Table 2). Compared with the TD group, the ASD group showed stronger correlations between curvature and RD. No significant correlation was found between curvature and AD in both groups.
Correlation between curvature and diffusivity parameter measured at the bending regions of bilateral AF and UF, and gCC
Discussion
The major finding of the present study is that children in the ASD group show higher curvature and sharper bending in bilateral AF and UF, and gCC. At sharply bending regions of these pathways, the change of the curvature was positively correlated with RD but negatively correlated with FA. Our previous study in this patient population6 showed changes of the fiber tracts by quantifying “fiber length” and “fiber length profile.” In the current study, further details about changes in the fiber geometry by quantifying “fiber curvature” along the whole path of the fiber were determined. In addition, whereas diffusion parameters were calculated and reported for the entire fiber tract in the previous study, the present study calculated the curvature-based changes in diffusion parameters. For this analysis, we used TBM. The registration is a key factor in determining the accuracy of the TBM analysis. Although the accuracy of the SPM DARTEL model has been validated in an ROI-based VBM study,23 the perfect coregistration of all fiber bundles of the brain (small and large) is difficult to achieve. Whereas reasonable coregistration can be achieved for large fiber tracts, coregistration is not very reliable for smaller fiber tracts. Therefore, although this limitation did not affect our present findings, because only large fiber tracts were analyzed in the present study, this may limit the applicability of the current method to the analysis of major fiber bundles only. In addition, we observed that the curvature is highly sensitive to 2 experimental parameters: the signal intensity–to-noise ratio of MR acquisition and the size of arc-length in the TBM analysis. The optimization of these parameters requires a larger sample size.
Several studies have reported abnormal changes of diffusivity parameters averaged over the entire fiber in the AF of children with ASD. For example, our previous study6 showed that children with ASD had significantly lower FA and higher MD in right AF. Fletcher et al24 reported lower FA and higher MD in bilateral AF but less left lateralized MD and FA in high-functioning adolescents with ASD. These findings are also consistent with our present results showing reduced FA and increased RD in bilateral AF fibers in children with ASD.
Primarily, the UF contains fibers connecting amygdala and orbitofrontal cortex (amygdalo-orbitofrontal circuit). Thus, the UF plays a critical integrative role in social cognitive and emotional functioning. The present study demonstrated that children with ASD showed aberrant changes in diffusivity and geometry in bilateral UF; these changes may be related to impairment in amygdalo-orbitofrontal circuit function in children with ASD.25,26
The reduced FA in gCC of the children with ASD has been reported by several studies.3,27,28 We also found lower FA and higher RD in gCC of the children with ASD. Especially, our TBM analysis revealed that these changes are more predominant in the midline of the gCC, which is the segment with high curvature. Although one previous study reported no significant difference in overall CC shape and contour in children with ASD associated with macrocephaly,29 it approximated the shape of the CC by measuring only 5 angulations between 4 lines enclosing the entire CC in T1-weighted midsagittal images. This approach would not be sensitive enough to reveal fine structural differences that the TBM analysis could detect at voxel resolution level.
Microstructural Basis of DTI Abnormalities in Autism
Higher curvature, higher RD, and lower FA in children with ASD are consistent with increased number of fibers5,6 and may be related to higher attenuation of cortical minicolumns demonstrated in previous studies.30,31 In “minicolumnopathy” of ASD, the cortical minicolumns contain numerous, smaller neurons that are densely packed. Thus, it could be anticipated that thinner and more numerous axons would emanate from these minicolumns. The interpretation of more numerous, thinner axons is also consistent with our previous studies of increased number of fibers in frontal lobe tracts.5,6 Thinner axons will disproportionately decrease the axon volume and increase interaxonal volume. The overall effect is to decrease the diffusion barriers to axons that can result in increased RD and decreased FA. Thus, the profile of abnormalities (higher curvature, higher RD, and lower FA) is consistent with the microstructural abnormalities of thinner and more numerous axons.
Aberrant Properties of Frontal Lobe Fibers in ASD
In this study, the children with ASD showed lower FA confined to the inferior frontal and middle temporal regions of bilateral AF, with higher RD at the same regions. This set of finding implies 2 possible scenarios: 1) existence of thin axons with high attenuation as discussed in the previous section and 2) decreased organization of fibers resulting in more tortuosity at local areas. Of these 2 possibilities, higher curvature at flexion points of a fiber tract would be more consistent with the presence of thin axons with high attenuation. Thinner fibers would be expected to lead to slower conduction velocity and may be related to reports of delayed auditory evoked potentials in ASD.32 Thinner and more numerous axons in AF might degrade language functionality and be interpreted as the underconnectivity previously demonstrated in ASD.33
Conclusions
The present study found higher curvature and significant curvature-dependent diffusivity changes in bilateral AF, UF, and gCC in children with ASD. These changes are likely to be due to abnormally developed axons of these frontal lobe pathways, which provide new insight into ASD specific white matter malformation characterized by higher attenuation of thinner axons in frontal lobe tracts.
Footnotes
-
Disclosures: Diane S. Chugani, Consultant: Shire, Details: Autism workshop speaker Dec. 13, 2010.
References
- Received December 9, 2010.
- Accepted after revision January 17, 2011.
- © 2011 by American Journal of Neuroradiology
In this issue


Jump to section
Related Articles
Cited By...
- No citing articles found.