
Abstract
BACKGROUND AND PURPOSE: CT perfusion data sets are commonly acquired using a temporal resolution of 1 image per second. To limit radiation dose and allow for increased spatial coverage, the reduction of temporal resolution is a possible strategy. The aim of this study was to evaluate the effect of reduced temporal resolution in CT perfusion scans with regard to color map quality, quantitative perfusion parameters, ischemic lesion extent, and clinical decision-making when using DC and MS algorithms.
MATERIALS AND METHODS: CTP datasets from 50 patients with acute stroke were acquired with a TR of 1 second. Two-second TR datasets were created by removing every second image. Various perfusion parameters (CBF, CBV, MTT, TTP, TTD) and color maps were calculated by using identical data-processing settings for 2-second and 1-second TR. Color map quality, quantitative region-of-interest-based perfusion measurements, and TAR/NVT lesions (indicated by CBF/CBV mismatch) derived from the 2-second and 1-second processed data were statistically compared.
RESULTS: Color map quality was similar for 2-second versus 1-second TR when using DC and was reduced when using MS. Regarding quantitative values, differences between 2-second and 1-second TR datasets were statistically significant by using both algorithms. Using DC, corresponding tissue-at-risk lesions were slightly smaller at 2-second versus 1-second TR (P < .05), whereas corresponding NVT lesions showed excellent agreement. With MS, corresponding tissue-at-risk lesions showed excellent agreement but more artifacts, whereas NVT lesions were larger (P < .001) compared with 1-second TR. Therapeutic decisions would have remained the same in all patients.
CONCLUSIONS: CTP studies obtained with 2-second TR are typically still diagnostic, and the same therapy would have been provided. However, with regard to perfusion quantitation and image-quality–based confidence, our study indicates that 1-second TR is preferable to 2-second TR.
Abbreviations
- ASPECTS
- Alberta Stroke Program Early CT Score
- CBF
- cerebral blood flow
- CBV
- cerebral blood volume
- CTA
- CT angiography
- CTP
- CT perfusion
- DC
- deconvolution
- GM
- gray matter
- MS
- maximum slope
- MTT
- mean transit time
- N/A
- not applicable
- NCCT
- noncontrast CT
- NVT
- nonviable tissue
- PCA
- posterior cerebral artery
- ROI
- region of interest
- TAC
- time attenuation curve
- TAR
- tissue at risk
- TTD
- time to drain
- TTP
- time to peak
- TR
- temporal resolution
- TTS
- time to start
- WM
- white matter
CTP is commonly used for imaging of patients with acute stroke.1,2 These studies are generally performed in conjunction with an NCCT of the brain and CTA. Quantitative perfusion parameters such as CBF, CBV, TTP, MTT, and TTD can be calculated and displayed as color maps. The pattern of disturbance of the perfusion parameters can be used to differentiate infarct core from potentially salvageable penumbra, as is possible with MR imaging.3,4 Optimized CTP protocols performed at 80 kV(peak) and 200 mAs5,6 can limit radiation dose, whereas standard multimodal stroke CT (NCCT, CTA, CTP) delivers an effective radiation dose of approximately 9 mSv7–9 and up to 500 mGy local dose.8,10 As an additional strategy for minimizing radiation exposure and increasing spatial coverage, CTP protocols with reduced TR have been suggested.11 Discordant findings regarding the feasibility of reduced TR have been reported in the literature.9,11–13 The purpose of our study was to evaluate the feasibility of a reduced TR scan protocol using a 2-second TR versus the standard TR of 1-second, by using 2 different algorithms (least mean squares DC and MS).
Materials and Methods
Datasets
We retrospectively evaluated 50 CTP datasets of patients with acute onset of neurologic symptoms of ≤9-hour duration. These datasets were acquired on multisection CT scanners, 22 with Somatom Sensation 16 (a 16-section scanner) (Siemens, Malvern, Pennsylvania), and 28 with Volume Zoom (a 4-section scanner) (Siemens Healthcare, Forchheim, Germany) after administration of a compact contrast bolus by using an injection rate of at least 5 mL/s delivered via power-injector through an 18-ga intravenous line, by using the following scan parameters: section thickness, 10–12 mm; tube voltage, 80 kVp; tube current, 180–235 mAs; scan delay, 4 seconds; scanning time, 40 seconds; and TR, 1 second. Two contiguous sections at the level of the basal ganglia were imaged. In the final evaluation, only the section demonstrating the largest extent of ischemia was selected for analysis. Datasets without any hemodynamic disturbance (unremarkable CTP) were excluded from the analysis. Datasets with 2-second TR were created by removing every second image.
Postprocessing
Calculation of perfusion parameters and color maps was performed by using a commercial perfusion package (VPCT Neuro VA31; Siemens Healthcare) providing both DC and MS postprocessing algorithms (the user can select which algorithm to use for calculation of CTP maps). Both algorithms have been previously described by Abels et al14 and Klotz and Konig.15 All postprocessing steps were performed 4 times per patient (for 2-second and 1-second TR datasets as well as by using the DC and the MS algorithms), generating 4 distinct sets of perfusion parameters (and color maps) per patient. For each dataset, brain parenchyma was first isolated by removal of calvarial bone (automatic contour finding). CSF and intracranial calcifications were then removed by using automatic thresholding. The venous outflow was obtained from the superior sagittal sinus. The arterial input function was measured in suitable branches of the middle or anterior cerebral artery. Major vessels were then removed by applying relative thresholding to the maximum voxel-enhancement profiles. Finally, an adaptive spatial-filtering step was performed that did not smooth over edges or vessel borders.
Qualitative and Quantitative Analysis
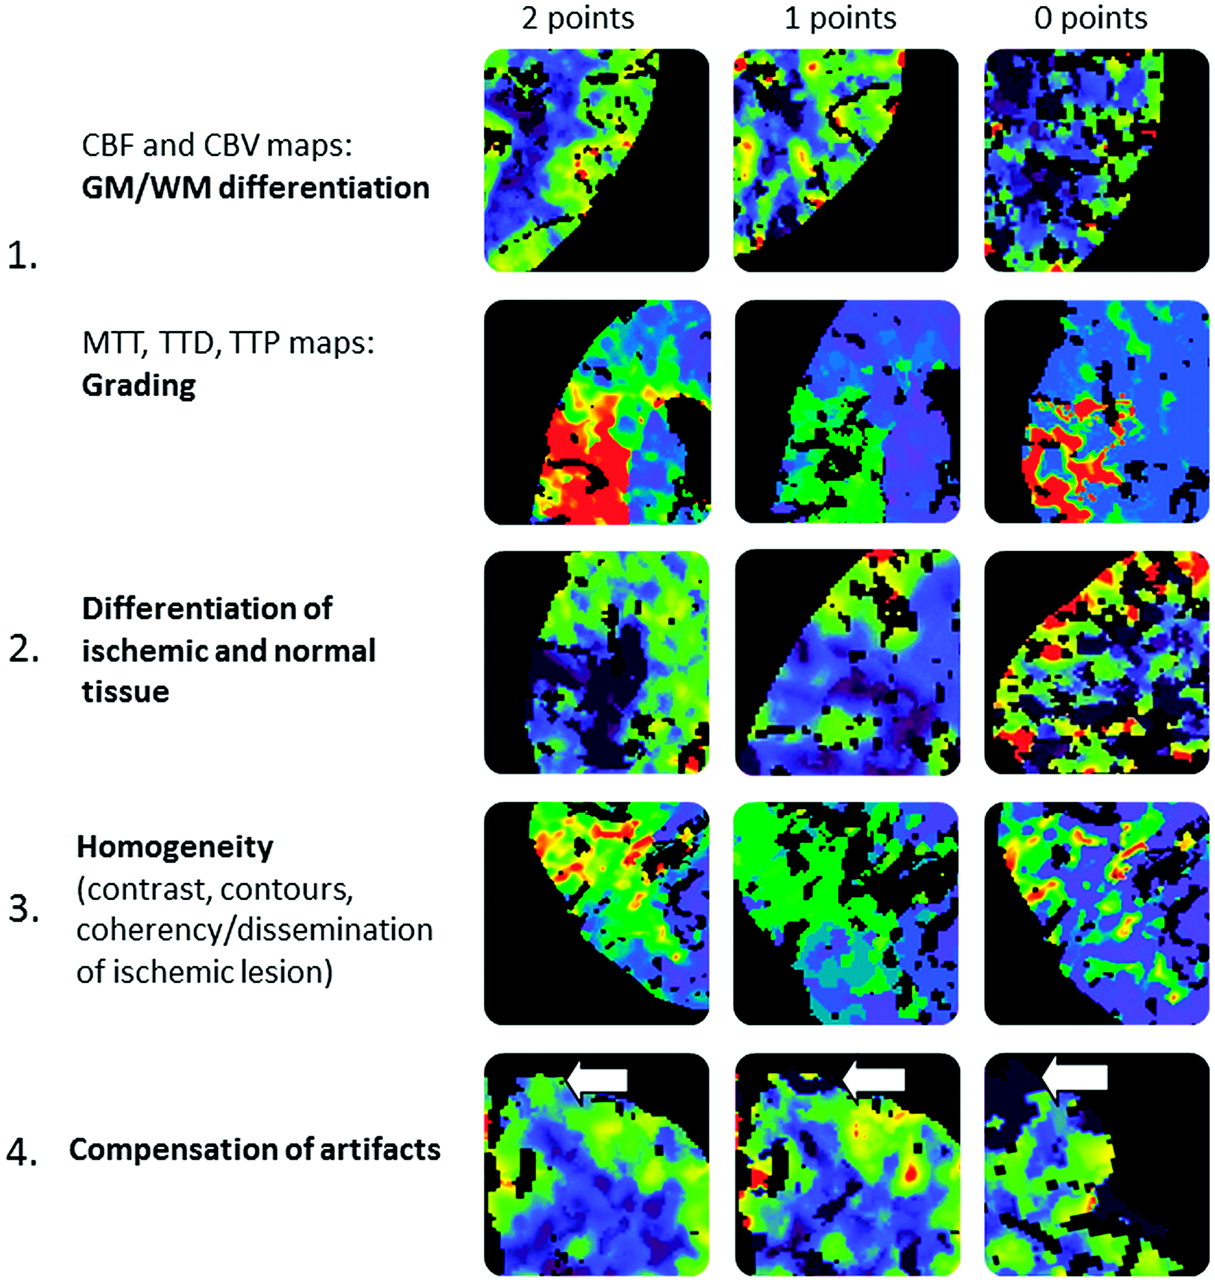
Color maps were visually analyzed and rated by 2 board-certified senior radiologists/neuroradiologists in a consensus reading by using a scoring system, as illustrated in Fig 1. Briefly, color maps were rated on a 3-point scale. The scores of the 4 categories were added, resulting in a maximum score of 8. Examinations with a score of >4 points were considered to be of high quality and high diagnostic value (category I); those with a score ≤4 points and ≥2 points were considered to be of medium quality but still sufficient for diagnosis (category II); and those with a score <2 points were considered poor quality and insufficient for diagnosis (category III).

Qualitative scoring system.
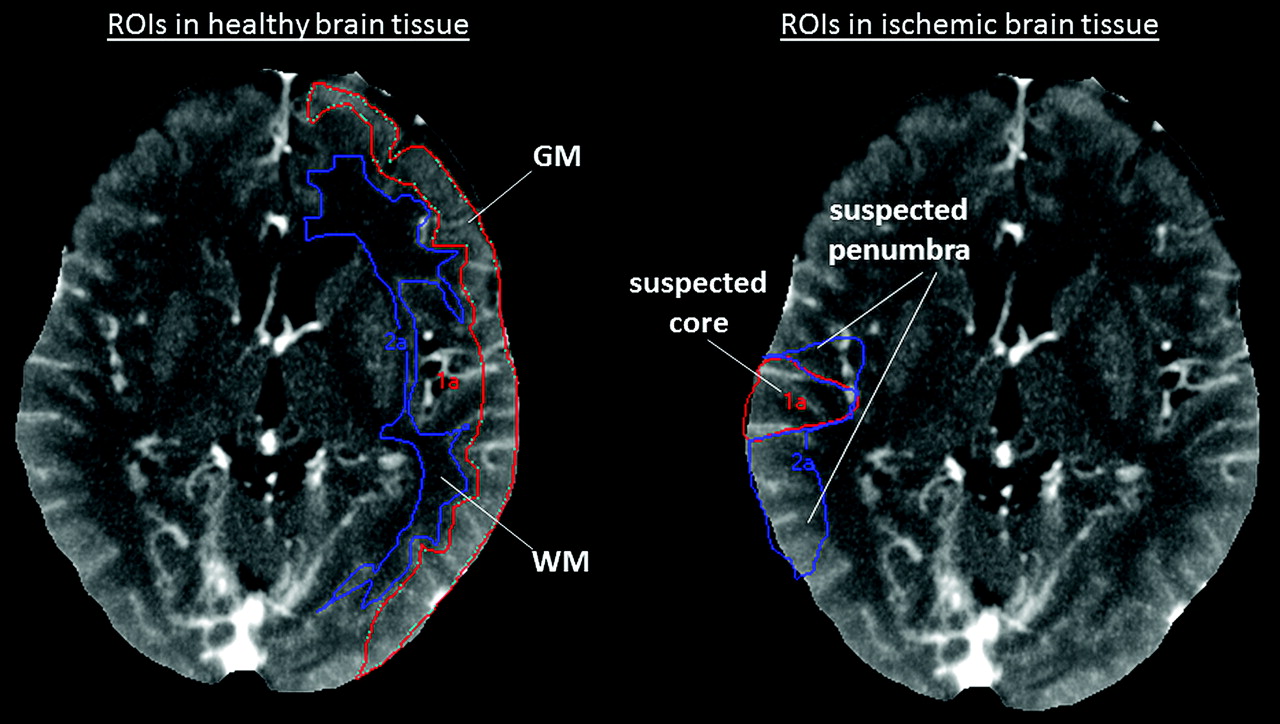
To extract quantitative measurements from different regions of the brain, we manually contoured regions of interest for each case, as illustrated in Fig 2.

In the nonischemic hemisphere, GM and WM regions of interest are placed as shown on the left part of the figure. In the ischemic vascular territory, the GM region with significantly reduced CBF but normal or elevated CBV is outlined as a “suspected penumbra” region of interest. The GM region with significantly reduced CBF and significantly reduced CBV is outlined as a “suspected core” region of interest. All regions of interest were used to determine quantitative perfusion values only; they were not used to predict final tissue fate (final tissue fate was not verified by follow-up imaging).
CTP Lesion Extent
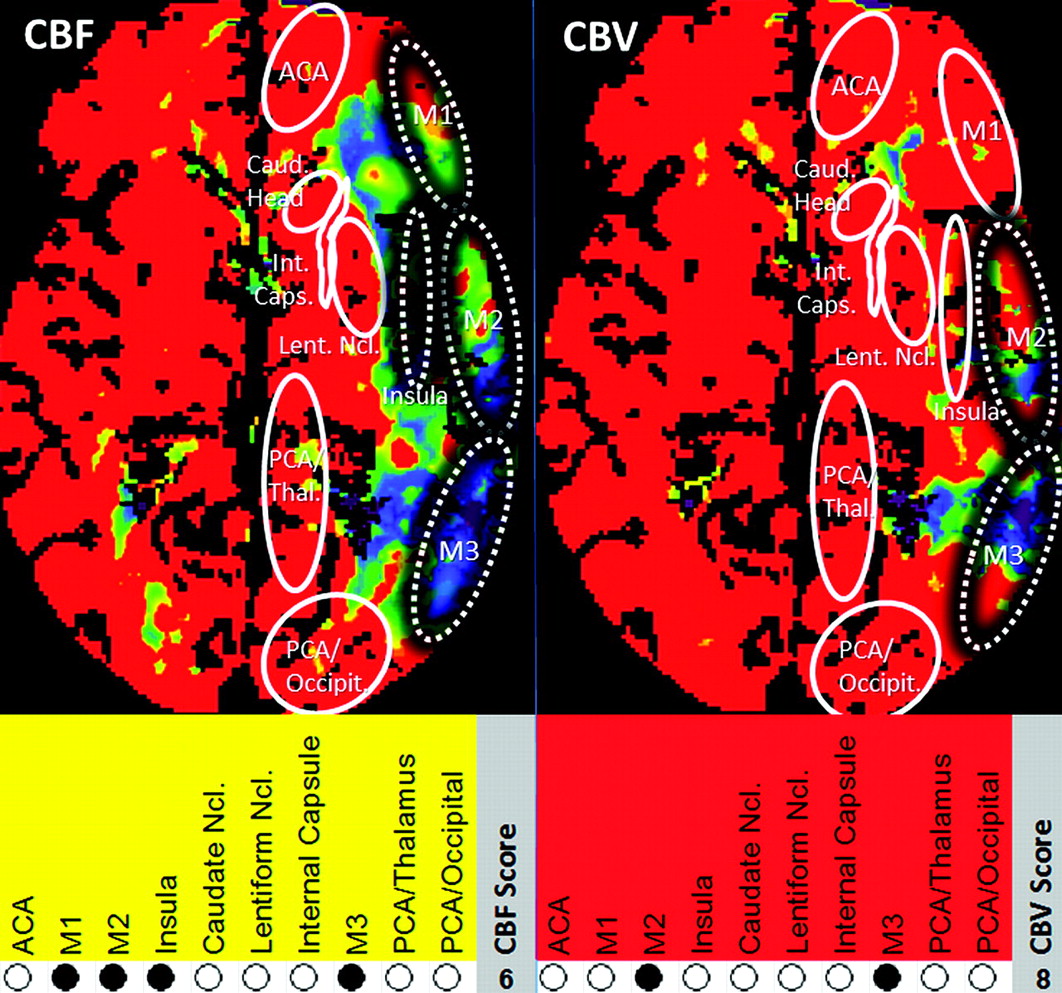
To examine whether variations in TR influence depiction of ischemic lesions, we measured the extent of CTP lesions by using both 2-second and 1-second TR datasets. NVT and TAR extent were determined by applying adapted absolute CBF/CBV thresholds as described by Abels et al.14 For defining TAR, a CBFDC threshold of 27 mL/100 g/min and a CBFMS threshold of 34 mL/100 g/min were used; for defining NVT, CBVDC and CBVMS thresholds of 1.2 mL/100 g were used. From CBF and CBV lesions depicted on color maps, CTP lesion scores (adapted to the ASPECTS14,16) were determined. To account for only 1 section per examination, we used the modified 10-point score as illustrated in Fig 3.

CTP scoring system in relationship to ASPECTS. M1, M2, M3, insular ribbon, caudate head, lentiform nucleus, internal capsule, anterior cerebral artery, PCA/occipital lobe, and PCA/thalamus were assigned 1 point each if nonaffected and 0 points if affected. Maximum score (healthy tissue) = 10, minimum score (complete infarction) = 0. For each case, CBF (TAR + NVT) and CBV (NVT) CTP lesion scores were derived from the CBF and CBV color maps, respectively.
Statistical Analysis
Statistical analysis was performed with the Statistical Package for the Social Sciences, Version 15.0 (SPSS, Chicago, Illinois), and MedCalc 10 for Windows (MedCalc Software, Mariakerke, Belgium). Image-quality scores for 2-second and 1-second TR data were compared by using the Wilcoxon signed rank test for paired samples. Absolute and relative region-of-interest values derived from 2-second and 1-second TR datasets were compared by using descriptive statistics. Differences of absolute and relative region-of interest measurements were tested for statistical significance by using the Wilcoxon signed rank test for paired samples. CTP lesion sizes obtained with 2-second and 1-second TR datasets were compared by using the Pearson correlation coefficient, scatterplots, and linear regression statistical methods. CTP lesion scores and corresponding NVT lesion scores (indicated by CBV2sec and CBV1sec maps, respectively, as well as TAR lesion scores indicated by CBF2sec and CBF1sec maps, respectively) were compared by using the Spearman rank correlation, scatterplots, and linear regression. Differences of corresponding scores were tested for statistical significance by using the Wilcoxon signed rank test. The threshold for significance was set at P < .05.
Results
From 50 individual datasets, 8 were excluded because they did not exhibit a perfusion abnormality. The mean age of the remaining 42 patients (23 men, 19 women) was 63.8 ± 11.7 years.
Qualitative Results
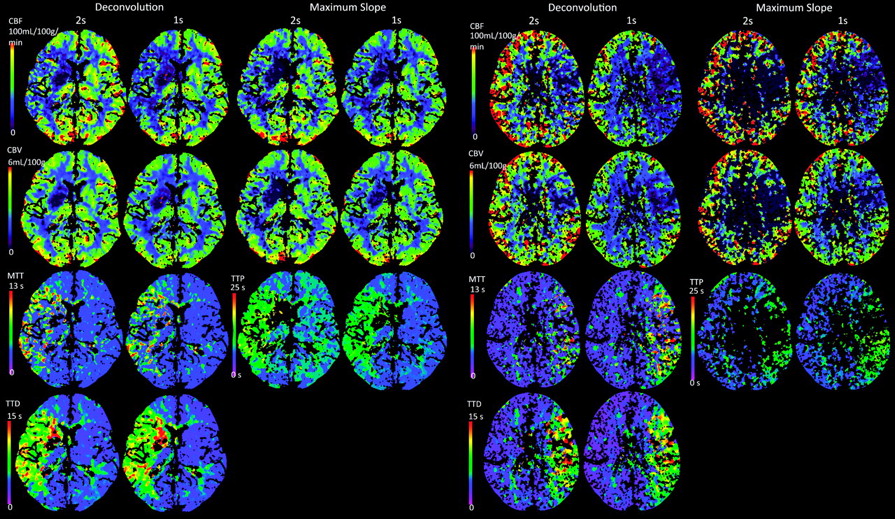
Color map quality of CBFDC, CBVDC, and TTDDC was nearly identical for 2-second versus 1-second TR (differences not reaching statistical significance, Table 1). Color map quality of MTTDC and of CBFMS, CBVMS, and TTPMS was significantly reduced for 2-second versus 1-second TR. Examples of corresponding color maps are shown in Fig 4.
Qualitative analysis (n = 42)a

Left panel: Example of a case with good source data quality. Note color map quality is almost identical for 2-second TR (column 1) versus 1-second TR (column 2) by using DC and MS (columns 3 and 4) techniques. Right panel: Example of a case with low dataset quality. Note that color map quality at 2-second TR is slightly reduced when using DC (columns 1 and 2) and significantly reduced when using MS (columns 3 and 4) processing techniques.
Quantitative Results
An overview of the results of the quantitative analysis is provided in Fig 5.

Box-and-whisker plots comparing 2-second and 1-second TR perfusion values.
DC
In cerebral GM and WM regions, quantitative CBF and CBV values obtained with 2-second TR (CBF2secTR and CBV2secTR) were systematically higher compared with those obtained with 1-second TR (CBF1secTR and CBV1secTR) (compare On-line Table 1 DC). MTT2secTR and TTD2secTR values were almost identical to MTT1secTR and TTD1secTR, respectively. In suspected penumbra regions, absolute CBF2secTR values were significantly higher than CBF1secTR values (On-line Table 1, footnote e) and CBV2secTR values tended to be higher than CBV1secTR values. Differences of relative CBF2secTR and CBF1secTR as well as relative CBV2secTR and CBV1secTR values, however, were not that remarkable. In suspected infarction core regions, CBF2secTR and CBV2secTR were similar or slightly higher compared with CBF1secTR and CBV1secTR, respectively. MTT2secTR and TTD2secTR values were slightly lower than MTT1secTR and TTD1secTR, respectively, in suspected penumbra as well as in suspected infarction core regions.
MS
In GM and WM regions, quantitative CBF2secTR values were almost identical to corresponding CBF1secTR values (On-line Table 2). Also, CBV2secTR values were similar to CBV1secTR values. TTP2secTR was slightly prolonged compared with TTP1secTR. In suspected penumbra regions, CBF2secTR tended to be slightly larger than CBF1secTR, whereas CBV2secTR tended to be lower than CBV1secTR. In suspected infarct core regions, differences of CBF2secTR and CBF1secTR did not reach statistical significance. However, CBV2secTR was significantly lower compared with CBV1secTR (On-line Table 2, footnote e). TTP values obtained with a 2-second TR were not markedly altered from those obtained with a 1-second TR in suspected penumbra and core infarction regions.
CTP Lesions
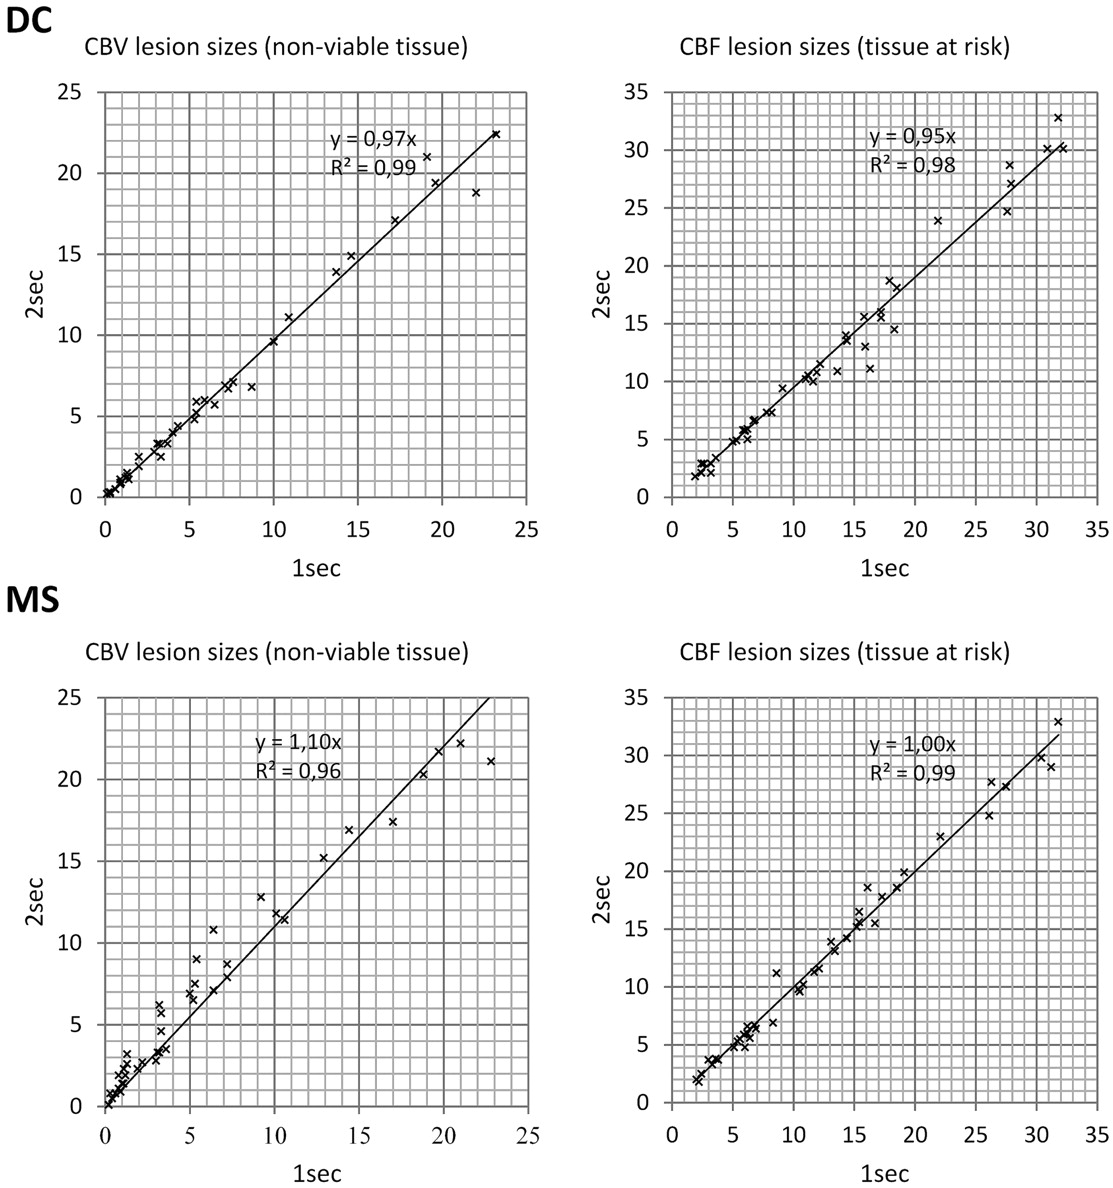
The results of the comparison of lesion sizes are shown in Fig 6. An overview of CTP lesion scores is provided in Table 2.

Scatterplots comparing CTP lesion sizes: 2-second versus 1-second TR for CBV and CBF perfusion parameters. All units are in cubic centimeters.
Results of CTP lesion scores (n = 42)a
We found an excellent correlation between all corresponding 2-second and 1-second TR CTP scores, by using both DC and MS: TARDC, r = 0.963; NVTDC, r = 0.995; TARMS, r = 0.966; NVTMS, r = 0.919, R2 = 0.86 (all P < .001).
CBVDC (NVT) lesions obtained with 2-second and 1-second TR were of similar size (linear regression: NVT2secTR = 0.97 × NVT1secTR, R2 = 0.99), and CBFDC (TAR) lesions obtained with 2-second TR were slightly smaller (−5%) than those obtained with 1-second TR (linear regression: TAR2secTR = 0.95*TAR1secTR, R2 = 0.98). Correlation (Pearson r) was excellent for corresponding 2-second and 1-second TR lesion sizes: NVTDC, r = 0.99 (P < .01); TARDC, r = 0.99 (P < .01). The average difference of mismatch (CBV/CBF ratio) between 2-second and 1-second TR was 2% (differences were ≤20% in 41 cases, >20% but ≤50% in 1 case, and >50% in none of the cases). Regarding the CTP lesion scores (modified ASPECTS), there were no statistically significant differences of CBVDC (NVT) lesion scores between 2-second and 1-second TR, but CBFDC (TAR) lesion scores obtained with 2-second TR were significantly higher (indicating less severe ischemic lesions) than those obtained with 1-second TR (P < .05). CBVDC (NVT) scores obtained with 2-second TR were ≤4 (n = 5), >5 and ≤7 (n = 10), and >7 (n = 27 cases), whereas scores obtained with 1-second TR were ≤4 (n = 5), >4 and ≤7 (n = 10), and >7 (n = 27 cases). In terms of clinical relevance, a change of NVT/TAR ratio to ≥1 from <1 as a consequence of reduced TR was not found in any of our study patients; therapeutic decisions would have remained the same in all patients, whether a 1- or a 2-second TR was used.
CBVMS (NVT) lesions obtained with 2-second TR were larger (+10%) than those obtained with 1-second TR (linear regression: NVT2secTR = 1.10*NVTMS1secTR, R2 = 0.96). CBFMS (TAR) lesions obtained with 2-second and 1-second TR were of similar extent (linear regression: TAR2secTR = 1.00*TAR1secTR, R2 = 0.99) but showed more artifacts, especially in frontal regions in cases with reduced CTP source data quality. Correlation (Pearson r) was excellent for corresponding 2-second and 1-second TR lesion sizes: NVTMS, r = 0.98 (P < .01); TARMS, r = 0.99 (P < .01). The average difference of mismatch (CBV/CBF ratio) between 2-second and 1-second TR was 8% (differences were ≤20% in 39 cases, >20% but ≤50% in 3 cases, and >50% in none of the cases). Regarding the CTP lesion scores (modified ASPECTS), we found that CBVMS (NVT) lesion scores obtained with 2-second TR were significantly lower (ie, more severe) than those obtained with 1-second TR (P < .001). Differences of CBFMS (TAR) lesion scores of 2-second and 1-second TR did not reach statistical significance. CBVMS (NVT) scores obtained with 2-second TR were ≤4 (n = 9), >4 and ≤7 (n = 11), and >7 (n = 22 cases), whereas scores obtained with 1-second TR were ≤4 (n = 5), >4 and ≤7 (n = 11), and >7 (n = 26 cases). A change in NVT/TAR ratio to ≥1 from <1 as a consequence of reduced TR was seen in none of our study cases. Therapeutic decisions would have remained the same in all patients.
Discussion
Recently, concerns about radiation dose have generated reservations about using CTP in stroke imaging. The average effective patient doses of NCCT, CTA, and CTP studies are 3 mSv, 3 mSv, and 2.5–3.5 mSv, respectively,17 adding up to an effective dose of approximately 9 mSv for a multimodal examination incorporating all 3 elements. While CTP scan coverage has been generally confined to a range of 2–4 cm, equaling the detector width, with the imaging slab centered on the basal ganglia and angled away from the eyes, the latest CT scanners provide full-brain CTP, either through the use of wide detectors ≤16 cm, by using shuttle modes, or through the use of continuous spiral scans. These whole-brain CTP techniques usually result in even higher radiation exposure. Especially, direct exposure of the eye lens is of concern.9 A desire to reduce radiation dose without sacrificing diagnostic image quality has led to the evaluation of alternate CTP protocols, especially those using a reduced TR (2-second TR reduces the patient dose by 50% compared with a 1-second TR). So far, findings regarding the feasibility of sampling intervals of >1-second TR reported in the literature have been somewhat discordant. For deconvolution algorithms, studies by Wintermark et al11 and by Wiesmann et al12 indicated that a reduced TR of only 1 image per 4 seconds might be feasible. However, studies by Kämena et al13 (by using the Perfusion 3 software package, GE Healthcare, Milwaukee, Wisconsin) and Kloska et al9 (by using the MS algorithm, Neuro Perfusion, Siemens) indicated that a TR of 2 images/1 second or 1 image/1 second, respectively, should be used to achieve the best detection and depiction of ischemic areas. Different scan protocols (milliampere-second, kilovolt[peak]), patient cohorts, software packages, deconvolution algorithms, pre- and postprocessing settings, and TAR/NVT thresholds used in these studies make it hard to interpret and compare the results.18 To address the limitations of prior studies, we systematically compared 2-second and 1-second TR by using identical source data and data-processing settings.
Most published CTP data are based on some type of DC technique. The DC algorithm used in our study was described previously by Abels et al.14 We did not find differences in diagnostic values of CBFDC and CBVDC color maps by using reduced TR, which is in agreement with findings in other studies.11,12 However, there were slight differences in quantitative results at 2-second TR: underestimation of MTT and overestimation of CBF and CBV at a 2-second TR found in our study have also been reported earlier.11,12,19 Despite these differences, corresponding 2-second and 1-second TR lesion sizes showed very good agreement in our study. We found a trend toward slightly decreased CBFDC lesion extent (which is in agreement with findings by Kämena et al13). Most important, therapeutic decisions would not have been altered by these differences in any of the cases.
MS is an alternative CTP postprocessing technique that was described by Klotz and Konig15 and has been used in clinical practice for several years.20 Our qualitative analysis revealed that differences regarding color map quality were significant for CBFMS, CBVMS, and TTP, which is in agreement with previous findings.13 In contrast, Kloska et al9 found no significant reduction of diagnostic quality of CTP maps. Our quantitative analysis revealed that CBFMS2sec and CBFMS1sec as well as CBVMS2sec and CBVMS1sec medians were similar, but individual corresponding values differed markedly. The calculation of CTP data by using the MS is restricted to the upslope section of the local TAC (time until the peak of the TAC is reached).15 Reducing the number of data points in this section by using a reduced TR has a stronger influence on CTP results obtained with MS than those obtained with DC, which uses all data points of the TAC. Flattening the curve might lead to under- or overestimation of CBFMS and CBVMS values.
In contrast to 1 study,9 we did not observe significant quantitative differences of CBFMS and CBVMS in healthy brain tissue, but we did find significant differences in ischemic regions. Especially, underestimation of CBVMS in suspected core infarction regions was found. Despite reduced qualitative and quantitative accuracy, CBFMS (TAR) lesions in our study showed very good agreement for 2-second versus 1-second TR, whereas CBVMS (NVT) lesions were significantly larger on 2-second compared with 1-second TR. Differences of lesion extents were mostly seen in cases with lower source data quality (eg, patient movement, suboptimal contrast bolus, decreased signal intensity–to-noise ratio). While Kloska et al9 found that CBFMS and TTP lesion sizes (TAR) were significantly smaller at 2-second TR (such that therapeutic decisions in individual cases could potentially be affected), in our study, TAR extent was not significantly changed, but NVT tended to be larger at 2-second TR when using MS. These differences can be explained by different CBV and CBF thresholds. Most important, despite lesion-size alterations, therapeutic decisions would not have been altered in any of the cases in our study.
Although minimizing radiation associated with CTP is a desirable goal, one must remember that only patients with high clinical suspicion of acute stroke undergo CTP, which places the risks of radiation in perspective. Also, the alternative study, when MR imaging is not available or appropriate, is conventional angiography, which may deliver even greater radiation doses. If CTP dataset quality is compromised too much by the attempt to minimize patient dose, inappropriate therapeutic decisions may result. Therefore, the risk/benefit ratio associated with dose reduction strategies must always be weighed carefully.
When using DC, we found that color map quality is not markedly impaired in most cases, quantitative results are altered, TAR lesion sizes are slightly smaller, and NVT lesion sizes are not significantly different for 2-second versus 1-second TR. These findings mean that correct diagnoses can be made on the basis of CTP results obtained with DC by using 2-second TR, but diagnostic confidence might be slightly reduced, which makes 2-second TR a feasible but not an equivalent alternative to 1-second TR. When using the MS approach, we found reduced color map quality, alteration of quantitative results, good agreement of TAR lesions, and larger NVT lesion sizes for 2-second versus 1-second TR. This means that correct diagnoses can also be made on the basis of CTP results obtained with MS by using 2-second TR, but diagnostic confidence might be reduced and the requirement for high-quality source data increases. Because at 2-second TR there are fewer data points from which the TAC is generated, individual data points become more crucial and the TAC can more easily be distorted. This distortion can occur, for instance, when a section is degraded by patient motion artifacts.
Our study does not suggest that reducing TR is impossible in general. Larger studies are needed to assess the benefit/risk of using a 2-second TR. Also, alternative scan protocols, such as dynamic TR21 (with 1 image/1 second for the first seconds during TAC upslope and 1 image/2 seconds or 1 image/3 seconds after peak enhancement); a test bolus (low dose) to detect the optimum time to start, which facilitates a reduction of actual scanning time to 10 seconds when using MS; or other TRs (eg, 1 image/1.5 seconds) when using DC, might also help reduce radiation dose and should be examined in future studies.
Limitations
A limitation of our study is that the accuracy of CTP lesion sizes could not be verified by follow-up imaging. However, the objective of our study was not the verification of lesions indicated by CTP but rather a systematic analysis of qualitative and quantitative comparability of 2-second versus 1-second TR. Another limitation of this study is that to maintain manageable dataset sizes, perfusion measurements and lesion extents were retrieved from 1 axial section only. Furthermore, the inhomogeneity of source data (nonuniform protocols) can be regarded as a limitation. However, this was intended to test different datasets with different image quality. Finally, our trial was conducted retrospectively on a limited number of cases, which may have introduced sampling errors or other dataset biases.
Conclusions
By directly comparing CTP data obtained with 2-second and 1-second TR, we found that CTP studies with 2-second TR are typically still diagnostic and the same therapy would have been provided. However, with regard to reliable quantitation and image quality-based confidence, our study indicates that 1-second TR is preferable to 2-second TR.
Footnotes
-
Disclosures: Ernst Klotz, Other Financial Relationships: employee: Siemens Healthcare, Details: principal scientist with the CT Division of Siemens Healthcare, Germany. Michael M. Lell, Research Support (including provision of equipment or materials): Siemens, Details: software provided, no financial support, Speaker Bureau: Siemens, Bayer-Schering, Details: no financial support for this study, Consultant: Bracco, Details: no financial support for this study.
References
- Received October 11, 2010.
- Accepted after revision January 23, 2011.
- © 2011 by American Journal of Neuroradiology
In this issue


Jump to section
Related Articles
Cited By...
- Clinical Applications of Conebeam CTP Imaging in Cerebral Disease: A Systematic Review
- Optimal Computed Tomographic Perfusion Scan Duration for Assessment of Acute Stroke Lesion Volumes
- Exposing Hidden Truncation-Related Errors in Acute Stroke Perfusion Imaging
- Whole-Brain Adaptive 70-kVp Perfusion Imaging with Variable and Extended Sampling Improves Quality and Consistency While Reducing Dose
- Radiation Doses of Cerebral Blood Volume Measurements Using C-Arm CT: A Phantom Study
- Vertebral Artery Hypoplasia: Frequency and Effect on Cerebellar Blood Flow Characteristics
- Can Iterative Reconstruction Improve Imaging Quality for Lower Radiation CT Perfusion? Initial Experience
- Stroke and CT Perfusion