
Abstract
BACKGROUND AND PURPOSE: Super-resolution track density imaging generates anatomic images with submillimeter voxel resolution by using high-angular-resolution diffusion imaging and fiber-tractography. TDI within the diseased human brain has not been previously described. The purpose of this study was to correlate TDI with histopathologic features of GBM.
MATERIALS AND METHODS: A total of 43 tumor specimens (24 contrast-enhancing, 12 NE, and 7 centrally necrotic regions) were collected from 18 patients with treatment-naïve GBM by use of MR imaging–guided neurosurgical techniques. Immunohistochemical stains were used to evaluate the following histopathologic features: hypoxia, architectural disruption, microvascular hyperplasia, and cellular proliferation. We reconstructed track density maps at a 0.25-mm isotropic spatial resolution by using probabilistic streamline tractography combined with constrained spheric deconvolution (model order, 8; 0.1-mm step size; 1 million seed points). Track density values were obtained from each tissue site. A P value of .05 was considered significant and was adjusted for multiple comparisons by use of the false discovery rate method.
RESULTS: Track density was not significantly different between contrast-enhancing and NE regions but was more likely to be elevated within regions demonstrating aggressive histopathologic features (P < .05). Significant correlation between relative track density and hypoxia (odds ratio, 3.52; P = .01), architectural disruption (odds ratio, 3.49; P = .03), and cellular proliferation (odds ratio, 1.70; P = .05) was observed irrespective of the presence or absence of contrast enhancement.
CONCLUSIONS: Numeric values of track density correlate with GBM biologic features and may be clinically useful for identification of regions of tumor infiltration within both enhancing and NE components of GBM.
ABBREVIATIONS:
- CE
- contrast-enhanced
- FA
- fractional anisotropy
- GBM
- glioblastoma multiforme
- NE
- nonenhancing
- TDI
- track density imaging
Despite significant advances in combined therapy, GBM remains an aggressive malignant neoplasm with a poor prognosis. The ineffectiveness of current therapies is multifold but can, in part, be attributed to the diffuse microscopic infiltrative growth of a tumor that evades local therapeutic strategies. The infiltrative growth pattern of GBM also prevents precise delineation of the invading tumor margin by current standard imaging methods. Despite the known limitations in defining the spatial extent of tumor, the standard of care remains maximal safe resection of the contrast-enhancing region followed by combined irradiation and chemotherapy. This practice almost invariably leads to the subsequent development of locally recurrent or distant tumor. A noninvasive technique capable of differentiating the infiltrative tumor margin from the normal surrounding neuropil could significantly improve clinical outcomes.
Imaging differential rates of water diffusion within the brain has become an important noninvasive tool for characterization of the biologic properties of tumor and white matter connectivity. Super-resolution track density imaging is a reconstruction method that exploits the inherently high directional accuracy of diffusion fiber tractography to generate anatomic images with submillimeter voxel resolution.1,2 “Super resolution,” defined as the ability to resolve structures smaller than the native voxel resolution, is achieved in TDI by exploitation of the inherent continuous construction of diffusion fiber tracts, which are not confined to image voxel coordinates.
Calamante et al1⇓–3 have previously validated the super resolution property of TDI using in silico models and by direct comparison with mouse brain histologic patterns. Although track density maps clearly depict both gray and white matter anatomy at a very high spatial resolution, the mechanism by which tissue contrast is achieved is complex. From a numeric standpoint, image intensity values in TDI represent fractional counts of mathematical tracks passing through each voxel.1⇓–3 “Track density” can therefore be altered by any process (local or remote) from the voxel of interest, resulting in an overall change in the number of fiber tracts within that voxel. In our study, we hypothesized that track density would reflect aggressive histopathologic features of GBM, such as tumor infiltration and white matter disruption, thereby allowing the noninvasive delineation of biologic active tumor outside of CE regions.
Materials and Methods
Patient Population
A total of 18 adult patients (13 men, 5 women; mean age, 52 ± 7.3 years) referred to our institution for initial resection of treatment-naïve GBM were prospectively enrolled in this study which was compliant with the Health Insurance Portability and Accountability Act and approved by the UCSF Committee on Human Research.
MR Imaging Protocol
All patients underwent imaging on a 3T MR scanner (MR750; GE Healthcare, Milwaukee, Wisconsin). We used the following imaging protocol: a 3-plane localizer, T2 FLAIR (TR, 9500 ms; TE, 121 ms; TI, 2375 ms; section thickness, 3 mm), 2D FSE-T2 (TR, 3000 ms; TE, 105 ms; section thickness, 5 mm), CE T1-weighted 3D spoiled gradient-recalled (TR, 34 ms; TE, 8 ms; section thickness, 1.5 mm), DWI (TR, 8000 ms; TE, 66 ms; b = 0 and 1000 s/mm2, 3 orthogonal directions), and high-angular-resolution diffusion imaging (TR, 9000 ms; TE, 94 ms, b = 0 and 2000 s/mm2; 55 noncollinear directions; section thickness, 1.8 mm; matrix size, 128 × 128; field of view, 230 mm).4
Diffusion Image Processing
Super-resolution track density maps were generated on a Linux research workstation by use of the MRtrix package (Brain Research Institute, Melbourne, Australia; http://www.brain.org.au/software) and software developed in-house for the reconstruction of high-angular-resolution diffusion imaging data and fiber tractography.5 High-angular-resolution diffusion imaging data were corrected for eddy-current distortion. The margins of the brain and skull were calculated, and the skull and scalp tissues were removed by use of the Brain Extraction Tool (BET2 version 2.1) from the FMRIB software library (http://www.fmrib.ox.ac.uk/fsl).6 Constrained spheric deconvolution was then used to obtain fiber orientation distribution functions with maximal harmonic order 6. The second-order integration over fiber orientation distributions algorithm was used for probabilistic tractography with the following parameters: step size, 0.1 mm; maximal angle between steps, 45°; 3 fiber orientation distributions samples per step; and 1 million seed points randomly distributed throughout the white matter of the entire brain, including the tumor.7,8 Track lengths <0.5 mm were discarded, and tractography was terminated when tract points extended beyond the margins of the brain. The resulting streamlines were then used to generate maps of track density at 0.25-mm isotropic spatial resolution in DICOM format for side-by-side review with the acquired FLAIR, FSE-T2, and CE T1-spoiled gradient-recalled anatomic data.
DWI data were transferred to a commercially available workstation (Advantage Workstation, GE Healthcare) and were aligned to the same axial location and resolution with use of commercially available software (FuncTool, GE Healthcare). ADC and FA maps were calculated on a voxel-by-voxel basis from the DWI datasets (b = 1000 s/mm2).
Tumor Tissue Planning and MR Imaging Analysis
Preoperative selection of up to 4 tissue sites was prospectively planned by use of a commercially available neurosurgical navigation system (VectorVision; BrainLAB, Heimstetten, Germany) on the basis of the presence or absence of contrast enhancement within the T2 hyperintense lesion with ADC values <1200 × 10−6 mm2/s. This allowed for a correlative study between imaging and histopathologic features through the acquisition of stereotactic MR image–guided tumor specimens according to anatomic images that were coregistered with maps of track density, ADC, and FA. Tissue sites were classified as 1) CE, 2) NE, or 3) centrally necrotic.
FLAIR, FSE-T2, CE T1-weighted spoiled gradient-recalled, ADC, FA, and TDI were transferred to a commercially available DICOM viewer (OsiriX version 3.9.2; http://www.osirix-viewer.com) to allow for placement of regions of interest. Image processing and region-of-interest placement were performed in a blinded manner with concurrent use of a consensus approach by 2 authors (R.F.B., J.P.Y.; each with more than 5 years of experience in radiology). Using the aligned imaging dataset, we manually defined a circular 50-mm2 region of interest for each tumor specimen site, allowing for the measurement of mean track density, ADC, and FA. Track density values were standardized to a 50-mm2 region of interest placed on contralateral normal-appearing white matter to produce relative values. In addition, track density and FA values were obtained from normal-appearing white matter structures: the centrum semiovale and the corpus callosum.
Image-Guided Tumor Tissue Localization, Collection, and Processing
We analyzed all tissue specimens by using our institution's standardized tissue collection methodology, which has been previously validated.9 In brief, preplanned tumor specimen sites were intraoperatively localized by use of a neuronavigational system (VectorVision). Before tissue removal, screen shots and MR imaging coordinates of the tumor specimen location were recorded.
We made every effort to ensure that each tissue sample target contained homogeneous tissue characteristics on the basis of diffusion-weighted and CE MR imaging. This included selecting sites with a homogeneous expression of CE or NE with a sufficient edge of homogeneous tissue to account for any minimal brain shift that may have occurred. We negated substantial intraoperative brain shift by 1) performing accurate intraoperative neuronavigational system registration to the patient's facial anatomy, 2) avoiding substantial loss of CSF, 3) testing registration accuracy against visible cortical landmarks immediately before biopsy sampling, 4) biopsy sampling before volumetric tumor resection, and 5) using standardized regions of interest of sufficient size to compensate for any minimal shift in brain location.
Tumor specimens were stained with standard hematoxylin and eosin and monoclonal antibodies with automated immunohistochemical–staining processes.9 For each tissue specimen, the presence of tumor cells was scored based on review of hematoxylin and eosin–stained sections by a neuropathologist as follows: 0, no tumor present; 1, infiltrating tumor margin; 2, infiltrating cellular tumor; 3, highly cellular infiltrating tumor involving more than 75% of the tissue. Tumor cells were identified based on morphologic features including cytologic atypia, enlarged nuclear-to-cytoplasmic volume ratio, and hyperchromasia. Cellular proliferation was quantified on sections stained for Ki-67 by use of a standardized proliferation index.9⇓–11 We quantified the degree of microvascular hyperplasia, hypoxia, and architectural disruption by using immunohistochemical-stained sections for Factor VIII, carbonic anhydrase-9, and SMI-31, respectively, on a 4-tier ordinal scale (0, no immunoreactivity; 1, mild; 2, strong; or 3, intense) within 3 high-power fields at a magnification of 200. An attending neuropathologist (J.J.P., with more than 10 years of experience), who was blinded to the imaging results, performed all histopathologic assessments.
Statistical Analysis
We investigated the separate comparison of imaging and histopathologic variables by using a generalized linear model, treating all ordinal variables as continuous and considering subject effects. Logistic regression was used to assess for differences in mean and relative diffusion measurements between tumor specimen sites on the basis of low and high aggressive histopathologic features (CE, Ki-67 >6%, cellular density >143, tumor score >1, microvascular hyperplasia score >1, CA-9 score >1, or SMI-31 score >1).9 Pearson correlation was used to analyze relationships between imaging and histologic parameters. A P value of .05 was used as a threshold of significance, adjusted for multiple comparisons by use of the false discovery rate method.
Results
Patient Population
On-line Table 1 summarizes patient demographics, anatomic MR imaging characteristics, and TDI parameters for each tumor specimen. A total of 43 tumor specimens were obtained: 24 from CE, 12 from NE, and 7 from centrally necrotic regions.
Track Density Measurements within Normal-Appearing White Matter
Track density and FA values were obtained from normal-appearing white matter tracts of the brain. The splenium (mean [SD]: track density, 33.2 [9.1]; FA, 0.132 [0.102]) and genu (mean [SD]: track density, 25.9 [7.2]; FA, 0.126 [0.091]) of the corpus callosum demonstrated significantly higher diffusion-related measurements compared with centrum semiovale white matter (mean [SD]: track density, 18.9 [4.1]; FA, 0.059 [0.037]; P < .01; On-line Fig 1). No difference was observed between FA values in the genu and splenium (P = .83; On-line Fig 1). No correlation was observed between normal-appearing white matter FA and track density values (P > .38).
Comparison of DWI and Histopathologic Characteristics Based on Contrast-Enhancing Morphologic Features of Tumor Specimens
No statistically significant regional difference among the 3 anatomically distinct tumor specimen regions (CE, NE, and central necrosis; based on standard anatomic MR imaging) was noted between track density or relative track density values (P > .14; On-line Table 2). FA and relative FA values were found to be significantly elevated within CE regions compared with NE or centrally necrotic regions (P < .05).
All tissue specimens demonstrated the presence of tumor on histopathologic analysis. None of the histopathologic features examined was found to be differentially expressed among the 3 tumor specimen regions (P > .16; On-line Table 3).
Track Density and ADC Values Predictive of Aggressive Histopathologic Features Irrespective of Presence of Contrast Enhancement
Because track density and histopathologic features of GBM did not differ significantly among CE, NE, or centrally necrotic regions, we investigated whether track density and ADC measurements of tumor specimens corresponded to low or high aggressive histopathologic features irrespective of the presence of contrast enhancement. Mean track density and relative track density were more likely to be elevated within tumor specimens, with higher scores for histopathologic features of hypoxia (relative TDI/CA-9: odds ratio, 3.52; P = .01), architectural disruption (relative TDI/SMI-31: odds ratio, 3.49; P = .03), and cellular proliferation (track density/Ki-67: odds ratio, 1.22; P = .05; (relative track density/Ki-67: odds ratio, 1.70; P = .05).
Relative ADC was more likely to be reduced within tumor specimens, with higher scores for histopathologic features of architectural disruption (SMI-31: odds ratio, 0.20; P = .03), tumor (odds ratio, 0.04; P = .02), microvascular hyperplasia (odds ratio, 0.28; P = .05), and cellular proliferation (Ki-67: odds ratio, 0.30; P = .05). FA and relative FA were not significantly different in regions with high and low histopathologic scores. The presence of contrast enhancement was not a determinant of DWI measurements.
Correlation between TDI and Histopathologic Features of GBM
Because track density values were more likely to be altered within regions having histopathologic features of GBM aggressiveness, we investigated these associations among all tumor specimens (Table 1). A strong positive correlation between relative track density and histopathologic measurements of tumor, microvascular hyperplasia (Factor VIII), hypoxia (CA-9), architectural disruption (SMI-31), and cellular proliferation (Ki-67) was observed (P < .05). In addition, a strong inverse correlation was found between ADC and histopathologic measurements of tumor (ADC/tumor: r = −0.48, P = .01; relative ADC/tumor: r = −0.54, P = .01), architectural disruption (relative ADC/SMI-31: r = −0.30, P = .05), and cellular proliferation (ADC/Ki-67: r = −0.62, P = .01; Ki-67/tumor: r = −0.56, P = .01). No significant correlation was found between FA or relative FA values and any of the histopathologic variables studied (P > .08). These findings remained statistically significant when correction for multiple comparisons was performed.
Correlation between DWI and GBM cellular characteristics
Correlation analysis of TDI measurements with histopathologic characteristics stratified by CE morphologic features of tumor specimens (CE or NE) is presented in Table 2. A significant positive correlation was observed between relative track density and cellular hypoxia (CA-9) in both CE and NE regions. Within NE regions, relative track density was found to correlate positively with architectural disruption (SMI-31) (P < .05; Fig 1). Within CE regions, relative track density was found to correlate positively with microvascular hyperplasia (Factor VIII) and cellular proliferation (Ki-67) (P < .05; Fig 2). Within NE regions, correlation analysis between track density and microvascular hyperplasia (Factor VIII) and cellular proliferation (Ki-67) was not performed, as these are not typical biologic features observed within these regions.9
Regional correlation of DWI and GBM cellular characteristics

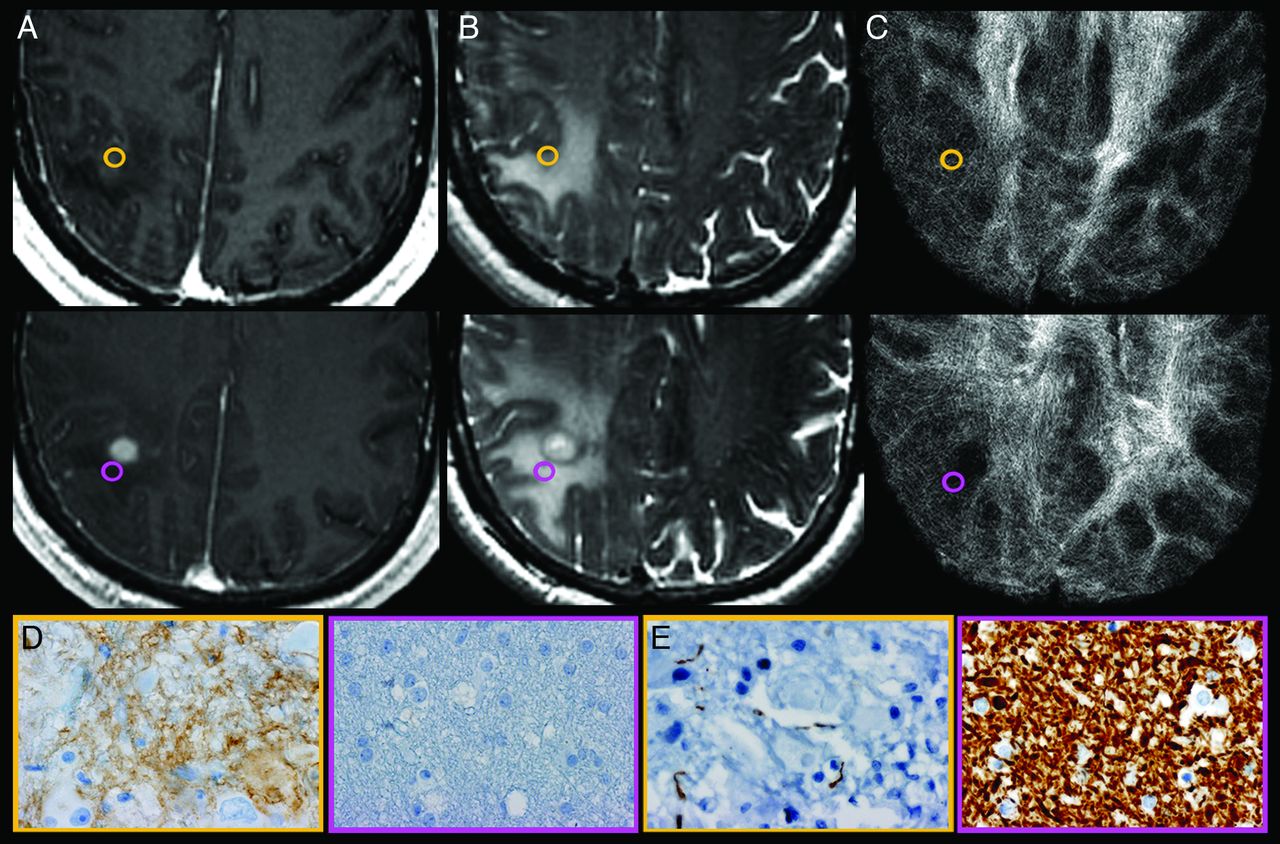
Correlation of track density imaging with histopathologic features of GBM obtained from NE tumor specimens. A, Axial CE T1-weighted spoiled gradient-recalled and (B) FSE-T2 coregistered with (C) TDI shows the preoperatively selected tumor regions from patient 7. Gold-and-purple tumor specimens obtained from similar-appearing NE sites demonstrate the regional correlation between relative track density, cellular hypoxia (CA-9), and architectural disruption (SMI-31). Tissue specimens stained for CA-9 (D) and SMI-31 (E) show elevated cellular hypoxia (brown stain; gold, 3) vs low cellular hypoxia (purple, 0) and architectural disruption (decreased brown stain; increased tumor infiltration in gold, 3) vs no tumor infiltration (purple, 0) within regions of elevated relative track density (gold, 2.07) vs less elevated (purple, 1.38). Despite the similar morphologic appearance on anatomic MR imaging, the 2 NE tumor sites demonstrate markedly different histopathologic features that correlate with relative track density measurements. This correlation suggests that TDI provides unique information that complements standard MR imaging sequences by noninvasively identifying regions of aggressive biologic histologic features, thereby facilitating the identification of NE sites significantly infiltrated with tumor.

Track density imaging correlation with histopathologic measures of GBM obtained from stereotactic tumor tissue specimens from CE regions. A, Axial CE T1-weighted spoiled gradient-recalled and (B) FSE-T2 coregistered with (C) TDI shows the preoperatively selected tumor regions from patient 7. Green-and-pink tissue samples obtained from similar-appearing CE regions demonstrate the regional correlation between relative track density and microvascular hyperplasia (Factor VIII). No correlation between relative track density and architectural disruption (SMI-31) was observed within the CE regions. Tissue specimens stained for Factor VIII (D) and SMI-31 (E) show elevated microvascular hyperplasia (brown stain; green, 2) vs lower vascular hyperplasia (pink, 1) and similar architectural disruption (green and pink, 1) within regions of elevated relative track density (gold, 1.59) vs decreased values (purple, 0.43). Despite the similar morphologic appearance on anatomic MR imaging, the 2 CE tumor tissue sites demonstrate markedly different measures of microvascular hyperplasia, which correlate with relative track density measurements. This correlation suggests that the degree of vascular hyperplasia exerts a greater biologic influence on TDI than architectural disruption, which is in contrast to the observed biologic effects on TDI within NE regions.
Discussion
In our study, we collected multiple tumor samples from patients with treatment-naïve GBM using stereotactic MR image–guided neurosurgical techniques to investigate the relationship between histopathologic features and quantitative track density values derived from high-angular-resolution diffusion imaging. We observed a significant positive correlation between characteristic of histopathologic features of GBM and relative track density values, regardless of whether the tumor specimen was acquired from a CE or NE region. We found that higher relative track density values of the tumor location yielded a higher likelihood of increased tumor proliferation, greater architectural disruption, and microvascular hyperplasia.
The inability to noninvasively delineate the extent of biologically active tumor from surrounding normal brain parenchyma has led to the standard practice for management of GBM, with initial attempt at “gross total” surgical resection of the CE tumor followed by external beam radiation therapy and adjuvant chemotherapy. In practice, the highly infiltrative growth pattern of GBM results in a biologically active tumor outside of the CE region, and the presence of a residual invasive tumor within the NE component results in the inevitable development of locally recurrent disease.12,13 In our study, relative track density values correlated significantly with histopathologic features of GBM within NE tumor specimens. The positive correlation between relative track density, hypoxia, and architectural disruption suggests that TDI may capture biologically based information not demonstrated by standard anatomic MR imaging sequences. Within the enhancing tumor core, white matter is overtly disrupted, and relative track density decreases. However, the histologic features within the surrounding NE parenchyma are complex and include a variety of tissue changes such as edema, microscopic hemorrhage, and necrosis, which are interspersed among invading glioma cells disseminating along mostly intact white matter tracts. In this context, it is important to emphasize that track “density” is a mathematical construct that does not directly measure neuropil physical density, glial cell density, or neuronal density. We speculate that the positive, rather than negative, correlation between GBM biologic aggressiveness and relative track density reflects a locally infiltrative tumor in which glioma cells have spread among white matter tracts, thereby paradoxically augmenting the tractography algorithm.
Our study provides evidence of the correlation between the cellular microenvironment of GBM and TDI, signifying that the combined evaluation of anatomic MR imaging and TDI may yield additional information about the presence of tumor within NE regions of the brain. The ability to assess for GBM infiltration within NE tissues could have a significant effect on patient treatment. A major flaw of current anatomic imaging methods is the inability of these methods to identify areas of increased biologic aggressiveness within NE regions. The results of our study suggest that TDI may help to improve patient outcomes by helping to guide individualized therapeutic strategies, such as targeted irradiation or convention-enhanced delivery of chemotherapeutics to tissues of altered track density.
In our study, track density and FA values demonstrated differential regional measurements. In contrast to track density, a wide range of overlapping FA values was observed within CE, NE, and centrally necrotic regions. We believe that this finding has both a biologic and imaging basis. Enhancement within the brain on MR imaging physiologically reflects the disruption of the blood-brain barrier. The presence of contrast enhancement within the glioma has previously been used as a marker of aggressive tumor biology; however, prior investigations have shown a significant degree of cellular heterogeneity within and between regions of contrast enhancement and nonenhancement.14⇓–16 That histopathologic features of GBM, track density values, and ADC measurements did not regionally differ reinforces that the presence of CE alone does not always delineate regions of biologically aggressive tissue.
The findings presented in this investigation represent the initial preliminary step toward the in vivo characterization of the cellular topography of tumor captured on TDI. In particular, histopathologic features within treatment-naïve GBM significantly influence the unique contrast mechanism and submillimeter spatial resolution of white matter fibers that are captured by track density imaging. Our initial clinical experience suggests that TDI may eventually play an important role in the characterization of the extent of the primary tumor core as well as in the diffuse infiltrative growth pattern of GBM that may or may not be apparent on standard anatomic imaging.
The inclusion of NE T2 signal abnormality in criteria for tumor progression and response proposed by the Response Assessment in Neuro-Oncology working group represents a first-effort basis on anatomic imaging to account for tumor in the absence of enhancement.17 The heterogeneity of pathologic changes that occur in these areas—reflecting tumor, vasogenic edema, and/or gliosis—underscores the need to develop improved imaging markers of GBM biologic aggressiveness to develop more effective tools for the early identification of tumor recurrence. The results presented in our study demonstrate the feasibility of TDI in the assessment of regional biologic aggressiveness within treatment-naïve GBM. Additional prospective studies using TDI methodology in conjunction with other modalities—such as MR spectroscopic, T2* dynamic susceptibility-weighted perfusion imaging, arterial spin-labeling, or [18F]luorodeoxyglucose–positron-emission tomography—are merited to determine whether this technique may also be useful for tumor detection in treated patients.
Our study had several important limitations. The immunohistochemistry techniques used in this study, though commonly used in clinical practice, focused on tumor cellular features and may not represent the full complement of biologic information captured by TDI. We postulate that information depicted on TDI may be further assessed by histopathologic and molecular analysis of the tumor microenvironment. Prior investigation has demonstrated that the tumor extracellular matrix is variable in GBM and may play a pivotal role in invasive tumor growth.18⇓⇓⇓⇓⇓⇓–25 Future investigations will include a direct correlative study between the characteristics of tumor microenvironment, especially the status of the extracellular matrix and presence of inflammatory cells, in GBM and alterations in white matter integrity. Second, we did not directly examine tissue from NE T2 isointense regions about the tumor core because of the risk of removing tissue from regions of normal-appearing brain. Given that TDI correlates positively with the presence of biologically active tumor within CE and NE regions, one could theoretically extrapolate this finding to the normal-appearing brain around the tumor regions. However, it would be pragmatic for future studies to investigate invasive GBM within normal-appearing brain with TDI using animal models. Finally, inherent asymmetries in track density between contralateral homologous regions of white matter were not directly considered in our analysis, though the magnitude of any asymmetry was likely very small and was comparable to minute differences in perfusion observed on dynamic susceptibility-weighted CE MR imaging.
Conclusions
Our study suggests that track density imaging noninvasively reveals unique biologic features of GBM. We found that relative track density correlates with aggressive histopathologic characteristics in treatment-naïve GBM. We speculate that these measurements reflect microscopic alterations in neuropil architecture. Further prospective studies will be required to determine whether this technique may be clinically useful in identification of regions of tumor infiltration within both enhancing and NE components of the tumor.
Acknowledgments
The authors thank Alvin Au, King Chiu, Cynthia Cowdrey, and Bethany Barajas for their tissue-processing assistance and helpful comments regarding this study.
Footnotes
Disclosures: Christopher Hess—RELATED: Grant: GE-AUR Radiology Research Academic Fellowship;* UNRELATED: Grants/Grants Pending: NIH.* Susan Chang—RELATED: Grant: NIH.* Sarah Nelson—RELATED: Grant: NCI,* Comments: Grant. Mitchel Berger—RELATED: Grant: NIH,* Comments: NIH P01 CA11816–01A2, NS045013, and TL1 RR024129–01. (*Money paid to institution.)
This work was supported by the National Institutes of Health (NIH) P01 CA11816–01A2, NS045013, and TL1 RR024129–01 from the National Center for Research Resources, a component of the NIH and NIH Roadmap for Medical Research. C.P.H. is supported in part by a grant from the GE Radiology Research Academic Fellowship (GERRAF) program.
Paper previously presented at: Annual Meeting of the Radiological Society of North America, November 27-December 2, 2011; Chicago, Illinois.
Indicates open access to non-subscribers at www.ajnr.org
REFERENCES
- Received May 20, 2012.
- Accepted after revision September 6, 2012.
- © 2013 by American Journal of Neuroradiology


