
Abstract
BACKGROUND AND PURPOSE: Pretherapeutic determination of tumor grade and genotype in grade II and III oligodendroglial tumors is clinically important but is still challenging. Tumor grade and 1p/19q status are currently the 2 most important factors in therapeutic decision making for patients with these tumors. Histopathology and cMRI studies are still limited in some cases. In the present study, we were interested in determining whether the combination of PWI, DWI, and MR spectroscopy could help distinguish oligodendroglial tumors according to their histopathologic grade and genotype.
MATERIALS AND METHODS: We retrospectively reviewed 50 adult patients with grade II and III oligodendrogliomas and oligoastrocytomas who had DWI, PWI, and MR spectroscopy at short and long TE data and known 1p/19q status. Univariate analyses and multivariate random forest models were performed to determine which criteria could differentiate between grades and genotypes.
RESULTS: ADC, rCBV, rCBF, and rK2 were significantly different between grade II and III oligodendroglial tumors. DWI, PWI, and MR spectroscopy showed no significant difference between tumors with and without 1p/19q loss. Separation between tumor grades and genotypes with cMRI alone showed 31% and 48% misclassification rates, respectively. Multimodal MR imaging helps to determine tumor grade and 1p/19q genotype more accurately (misclassification rates of 17% and 40%, respectively).
CONCLUSIONS: Although multimodal investigation of oligodendroglial tumors has a lower contribution to 1p/19q genotyping compared with cMRI alone, it greatly improves the accuracy of grading of these neoplasms. Use of multimodal MR imaging could thus provide valuable information that may assist clinicians in patient preoperative management and treatment decision making.
ABBREVIATIONS:
- cMRI
- conventional MRI
- Glx
- complex glutamine/glutamate
- K2
- permeability index
- WHO
- World Health Organization
Pretherapeutic differentiation of WHO grade II and grade III oligodendroglial tumors is clinically important for establishing an appropriate therapy scheme and for patient management. Thus, grade II tumors may be treated with either radiation therapy or chemotherapy alone, whereas grade III tumors are generally treated more aggressively with a regimen of chemotherapy and/or radiation therapy with this depending on their 1p/19q status. This genetic alteration, related to an unbalanced reciprocal translocation t(1;19)(q10;p10),1 has been shown to predict better prognosis and response to radiotherapy and chemotherapy, in addition to longer survival duration for patients.2,3 Although histopathology examination remains the reference standard method for the diagnosis and classification of brain tumors, variations in tissue sampling for these heterogeneous neoplasms and restrictions on surgical accessibility make it difficult to be certain that the samples analyzed are really representative of the entire tumor.4
Nowadays, cMRI is considered the reference standard for pretherapeutic noninvasive diagnosis and for providing helpful information for treatment decision making in brain tumors. However, its ability to differentiate between oligodendroglial tumor genotypes and grades is limited and can result in ambiguous (Fig. 1) or misleading results in some cases, because both grade II and grade III tumors may present similar clinical and MR imaging features.5,6 Moreover, cMRI does not provide information on angiogenesis, metabolism, or cellularity, which are important parameters in tumor studies.

Confounding examples of grade II and grade III oligodendrogliomas and oligoastrocytomas by cMRI.
Diffusion-weighted imaging, perfusion-weighted imaging, and MR spectroscopy are increasingly used in the investigation ofgliomas6⇓⇓–9 because of their ability to sample not only the lesion but also the adjacent brain tissue for physiologic and metabolic alterations. Several studies7,10⇓⇓⇓–14 have managed to characterize and distinguish the molecular genotypes of gliomas by using conventional and/or advanced MR imaging techniques. However, to the best of our knowledge, no study has combined all of these MR imaging techniques to distinguish molecular features of grade II and grade III oligodendroglial tumors.
Thus, the aim of this study was to determine whether the combination of conventional and parametric MR imaging methods, obtained through routine pretherapy MR imaging examinations, could help classify oligodendroglial tumors according to their grade and genotype.
Materials and Methods
Study Population
We retrospectively reviewed all adult patients who had been referred for an intracranial tumor between 2006 and 2010. From a total of 270 patients, we included all who fulfilled the following criteria: 1) histologic diagnosis of grade II or III gliomas15; 2) MR imaging scans performed at initial diagnosis, before any intervention and including short and long TE MR spectroscopy, DWI, and PWI; and 3) known 1p/19q codeletion status. Overall, 50 patients (25 women and 25 men; median age, 43.0 ± 15.6 years; age range, 18–82 years) met these criteria and were included in this study. In this population, 24 grade II tumors (10 oligodendrogliomas and 14 oligoastrocytomas) and 26 grade III tumors (12 oligodendrogliomas and 14 oligoastrocytomas) were identified. No pure astrocytomas fulfilled the inclusion criteria.
Histopathology and Molecular Genetics Studies
The histopathologic diagnosis for each patient was made according to the latest WHO guidelines.15 Chromosomal arms 1p and 19q copy numbers were determined by fluorescence in situ hybridization with locus-specific probes for 1p36 and 19q13, as described elsewhere.16 No individual investigation of 1p or 19q was considered.
MR Imaging Protocol
MR imaging was performed on a 1.5T scanner (Symphony; Siemens, Erlangen, Germany) equipped with an 8-channel phased-array head coil. Pretherapeutic cMRI protocol included the following sequences: sagittal flash gradient-echo T1 (TR, 376 ms; TE, 4.48 ms; section thickness, 4 mm; FOV, 300 mm), axial turbo spin-echo T2 (TR, 7240 ms; TE, 124 ms; section thickness, 4 mm; FOV, 240 mm), axial gradient-echo T2* (TR, 1000 ms; TE, 17 ms; section thickness, 5 mm; FOV, 240 mm), coronal fluid-attenuated inversion recovery (TR, 8220 ms; TE, 112 ms; section thickness, 4.5 mm; FOV, 230 mm), and 3D T1 postcontrast (TR, 1880 ms; TE, 2.62 ms; section thickness, 1 mm; FOV, 256 mm).
We obtained diffusion-weighted images by using an axial echo-planar spin-echo sequence (TR, 3500; TE, 101 ms; section thickness, 5 mm; FOV, 254 mm). Diffusion was measured in 3 orthogonal directions by use of 3 b-values (0, 500, and 1000 s/mm2).
We obtained monovoxel MR spectroscopy data from all patients by using a volume of interest of 8 cm3 (20 × 20 × 20 mm) that was centered in the bulk of the tumor, away from the scalp and the temporal bone. Spectra were acquired with a point-resolved spectroscopy sequence with short (30 ms) and long (135 ms) TE (TR, 1500 ms). An H2O signal was acquired for quantification purposes, at the same location.
Dynamic susceptibility contrast echo-planar gradient-echo images were acquired in all patients (TR, 1480 ms; TE, 30 ms; section thickness, 5 mm; FOV, 281 mm; 50 time points). A single standard dose (0.1 mmol/kg of body weight) of gadolinium (Dotarem, Guerbet, France) followed by 20 mL of saline solution was rapidly administered intravenously through a power injector at 6 mL/s.
Postprocessing and Data Analysis
Two investigators, blinded to molecular and histologic data, evaluated the MR images by consensus. Necrosis, hemorrhage, and vasogenic edema were binary coded (0 when absent and 1 when present). Tumor border score was 0 or 1 (indistinct vs sharp) and was determined on T1 and T2 images. Contrast enhancement was coded with a score from 0 to 4—indicating absent, blurry, nodular, and ringlike, respectively. Tumor location was coded as frontal, temporal, insular (when involving the frontal and/or parietal lobes and the insula), temporoinsular, parietal, and thalamic.
Postprocessing of MR spectroscopy data was performed by use of the AMARES (advanced method for accurate, robust, and efficient spectral fitting) code17 included in CSIAPO,18 a homemade software package developed under the IDL environment (Research System, Boulder, Colorado). N-acetylaspartate (2.02 ppm), choline (3.22 ppm), creatine (3.03 ppm), and lactate (1.35 ppm) peaks were identified on the long and/or short echo time spectra. In addition, myo-inositol (3.56 ppm), lipids (0.85 and 1.70 ppm), and the Glx (2.16 and 2.28 ppm) peaks were determined on the MR spectra at short TE. MR spectroscopy relative quantification consisted of normalizing each metabolite by the water signal. The metabolite ratios NAA/Cho, Cho/Cr, NAA/Cr, and myo-inositol/Cr at long and/or short TE were also calculated.
The constructor console was used to generate apparent diffusion coefficient maps on a pixel-by-pixel basis. We conducted postprocessing using PerfScape and NeuroScape software packages (Olea Medical, La Ciotat, France). CBF, corrected CBV, and K2 maps were generated after verification of the automatically detected arterial input function.
Multiple tumor regions of interest were manually drawn on the most representative section for both DWI and PWI modalities, and a single circular region of interest was placed over the mirrored normal brain in the contralateral hemisphere to obtain control values. Evaluation of ADC maps was carried out as follows: several ROIs were drawn inside of the tumor; cystic, necrotic, and hemorrhagic components were avoided whenever possible. The lowest ADC value, believed to represent high cellularity, was used to compare between grades and between genotypes. A similar method was used to investigate relative cerebral blood volume (rCBV), relative cerebral blood flow (rCBF), and rK2 maps. Tumor ROIs were placed over the tumor areas with the highest blood volume, a method which has been shown to give the best interobserver and intraobserver reproducibility.19 These ROIs were automatically replicated on rCBF and rK2 maps. In a similar fashion, the region of interest with the highest rCBV value was selected to represent the tumor. We then obtained diffusion and perfusion relative quantification by normalizing the tumor value of each parameter (CBF, CBV, and K2) by the corresponding contralateral value to obtain relative data (rCBF, rCBV, and rK2, respectively).
Statistical Analysis
We performed univariate statistical analyses using JMP9 software (SAS Institute, Cary, North Carolina). Differences in ADC between tumor grades (grade II vs grade III) and tumor genotypes (1p/19q codeletion vs wild type) were assessed with the Student t test. When normality could not be verified, the nonparametric Wilcoxon test was used to evaluate differences in perfusion and spectroscopic quantitative parameters among groups. The 2-tailed Fisher exact test (when 1 subgroup was n < 5) and the Pearson χ2 test were used to evaluate the significance of correlations between grade or genotype and cMRI parameters, genotype and histopathology findings, and genotype and tumor grade. A P value <.05 was chosen to indicate a statistically significant difference.
Multivariate analyses were performed by random forest,20 a learning classifier, to predict group membership either for tumor grade or for genotype, with the 6 variables for cMRI or with the 19 variables for multimodal MR imaging as predictors (randomforest Package from R software v.2.13.0, http://www.r-project.org/).
A random forest is a collection of trees constructed over bootstrap samples of the original dataset. For each forest, we used the following values for the tuning parameters. Each tree was grown up to 1 observation per leaf (minimum size = 1). The splits of every node in a tree were optimized over mtry =
For a new observation, the final prediction of a random forest is given by a majority vote from all individually trained trees. To assess the accuracy of the forest, we randomly split the data into 2 disjointed samples: the learning sample and the test sample (two-thirds of the data for learning the model and the rest of the data for assessing its performance). The performance of the forest was assessed with use of the average of the misclassification error, more than 100 test samples. This was done for both models estimated by the cMRI and multimodal MR imaging variables.
The misclassification error rate, sensitivity, specificity, and the positive and negative predictive values of cMRI and multimodal MR imaging were defined on the basis of prediction results of the random forest to quantify the performance of the classification.
Results
The main histopathologic and cMRI characteristics of the tumors are summarized in Table 1. Most of the lesions were infiltrating and were located in the frontal lobe followed by the insula, the temporoinsular lobe, and the temporal lobe. More than half of the tumors were enhanced after injection of a contrast agent. Loss of 1p/19q was found in 38% of patients. Data from DWI, PWI, and MR spectroscopy are summarized in Table 2.
Histopathologic and cMRI features of the tumors
DWI, PWI, and MRS measurements in grade II and grade III oligodendroglial tumors and genotypes according to grade
Grade II vs Grade III
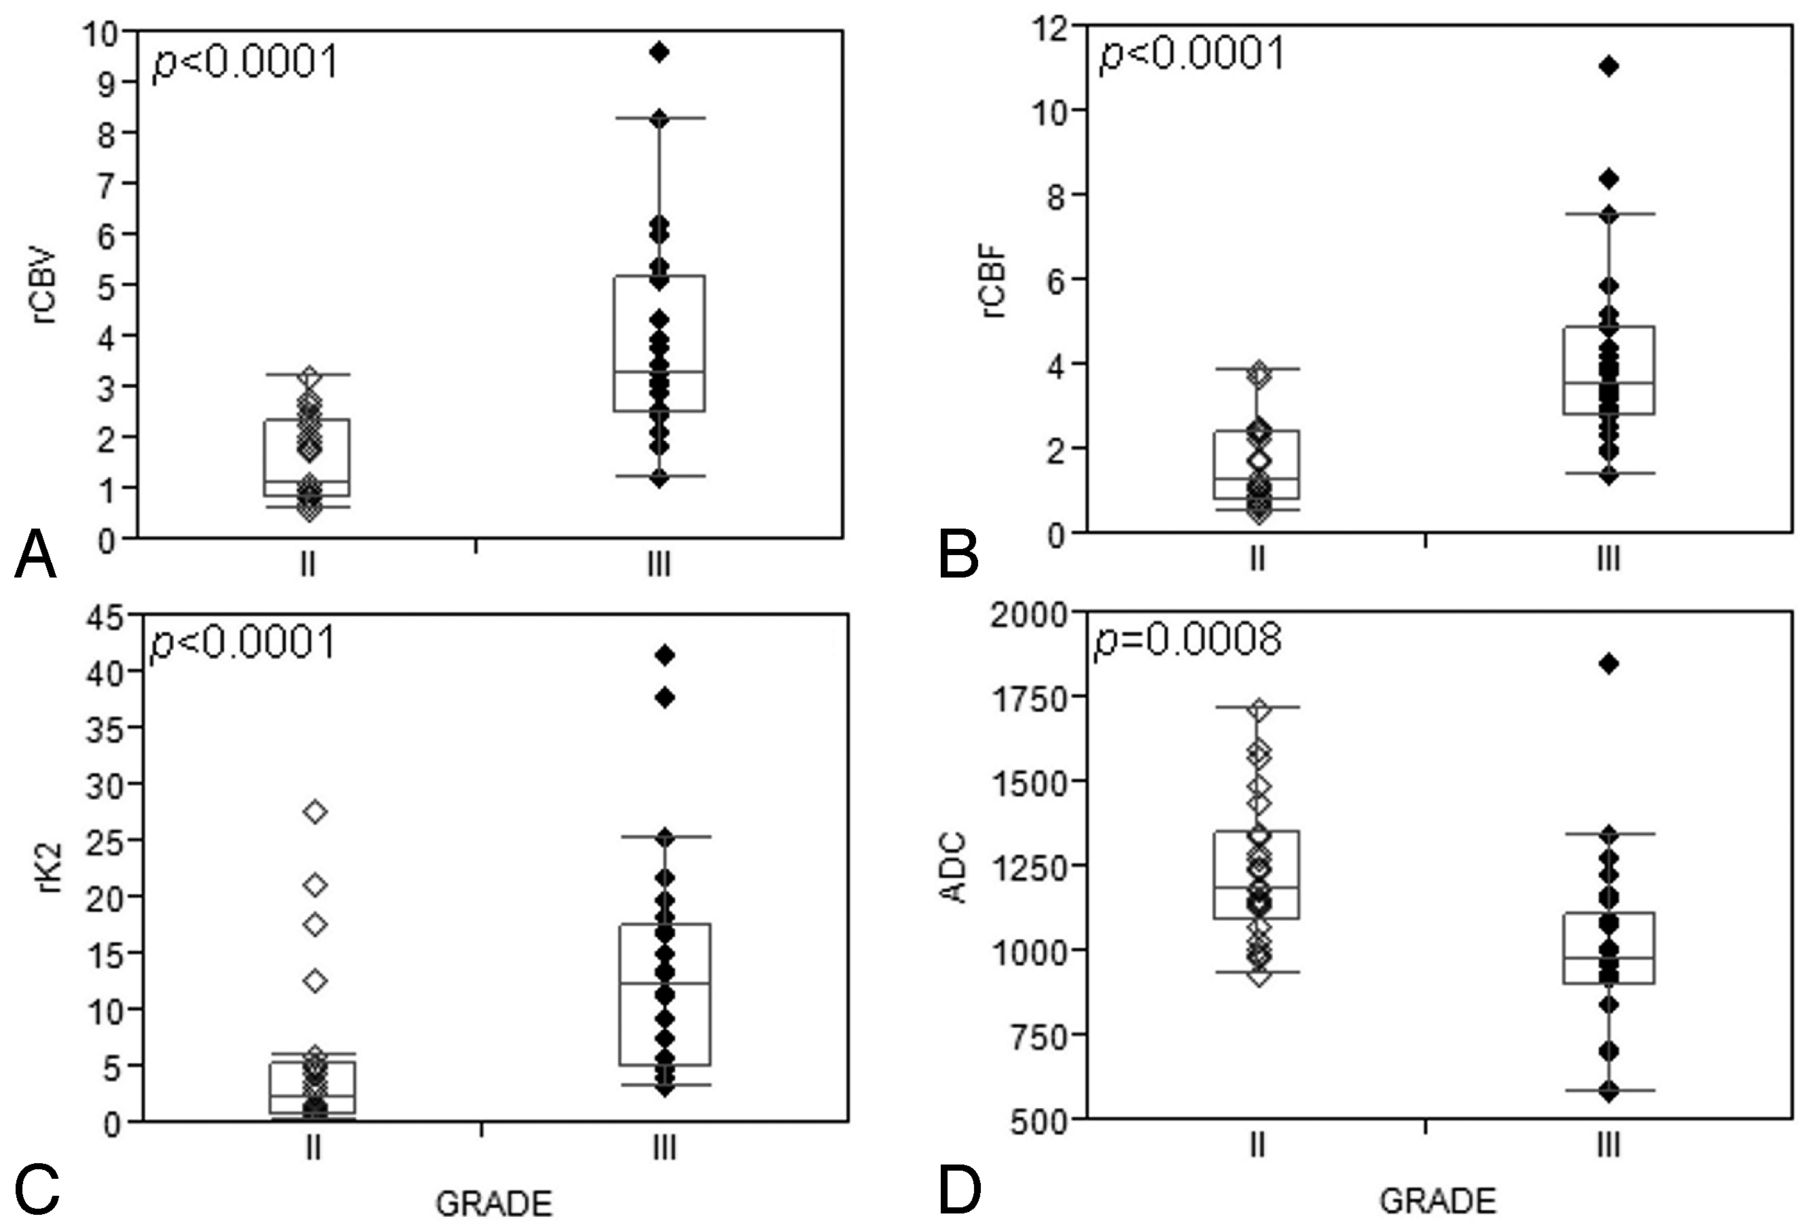
Hemorrhage was found in 5 patients with grade III tumors, but hemorrhage was absent in all patients with grade II tumors (P = .023). Contrast enhancement was usually absent in grade II (15/24) compared with grade III neoplasms (3/26; P = .0004). Ringlike enhancement was seen exclusively in grade III oligodendroglial tumors (7/26). ADC values were significantly higher in grade II compared with grade III tumors (P = .0008), whereas rCBV, rCBF, and rK2 were lower in grade II tumors (P < .0001 for all 3 measurements; Fig. 2, Table 2). NAA/H2O and NAA/Cho ratios at short TE were significantly higher in grade II tumors, but the Cho/Cr ratio was significantly higher in grade III tumors (P = .023; P = .034; and P = .020, respectively). However, no cutoff value was found with DWI, PWI, and MR spectroscopy to accurately discriminate grade II from grade III oligodendroglial tumors.

Boxplots show significant differences in rCBV, rCBF, rK2, and ADC between grade II and grade III oligodendroglial tumors: (A) rCBV, (B) rCBF, and (C) rK2 are significantly higher in grade III compared with grade II tumors, whereas (D) ADC is significantly increased in grade II tumors.
1p/19q Codeletion vs 1p/19q Intact
Tumors with intact 1p/19q were mostly located in the temporal, insular, and temporoinsular regions (20/31), whereas those presenting with 1p/19q codeletion were more likely to be frontal (9/19; results not statistically significant). None of the oligodendroglial tumors with 1p/19q codeletion was located in the temporoinsular region. Nevertheless, 9 of 31 tumors with intact 1p/19q were located in the frontal lobe, and 6 of 19 tumors with 1p/19q loss were found in the insular area.
Neoplasms with 1p/19q codeletion were associated with the oligodendroglioma histologic type (15/19; P = .0001) and grade II tumors (13/19; P = .023), whereas nondeleted tumors correlated with oligoastrocytoma (24/31; P = .0001) and grade III tumors (20/31; P = .023). All grade III oligoastrocytomas had intact 1p/19q. Independent of tumor histologic grade, there was no significant difference in ADC, rCBV, rCBF, rK2, and metabolite ratios between tumors with 1p/19q loss and those with intact 1p/19q (P > .05). This finding was also true when grade III tumors alone were considered. However, when only grade II oligodendroglial tumors were selected, rCBV and rCBF values were statistically higher in tumors presenting with 1p/19q codeletion compared with tumors without the deletions (Fig. 3; P = .0009 and P = .0007, respectively). Statistical analysis of MR spectroscopy data showed no significant difference between tumors with the 1p/19q genotype and those with intact 1p/19q.

Boxplots show that grade II tumors with 1p/19q codeletion have significantly higher rCBV and rCBF than tumors with intact 1p/19q. No significant difference could be observed between genotypes in grade III oligodendroglial tumors.
Multivariate Analysis
Table 3 shows the sensitivity, specificity, positive and negative predictive values, as well as misclassification error rates of cMRI and multimodal MR imaging in the prediction of tumor grade and genotype. Random forest analysis with cMRI alone, including contrast enhancement, tumor location, necrosis, hemorrhage, edema, and tumor borders, showed a high misclassification error rate of 31% for tumor grading. A better classification of the patients according to tumor grade was obtained when combining cMRI, DWI, PWI, and MR spectroscopy at short TE with a 17% misclassification error rate (Table 3).
Sensitivity, specificity, PPV, NPV, and misclassification error rate in the differentiation of tumor grades and genotypes
In a similar fashion, when cMRI alone was considered, 48% of patients could not be classified according to 1p/19q genotype (deleted vs intact 1p/19q). A slightly better discrimination was obtained by multimodal MR imaging with 40% misclassification error (Table 3).
When both tumor grade and genotype were combined (ie, 4 groups: grade II with 1p19q loss, grade II with 1p19q intact, grade III with 1p19q loss, and grade III with 1p19q intact), the random forest analysis performed by multimodal MR imaging showed an increased classification accuracy (61%) compared with results obtained with cMRI alone (45%).
Discussion
Although treatment strategy for grade II and grade III oligodendrogliomas and oligoastrocytomas is currently evolving, the optimal management of these tumors has yet to be defined. Tumor genetic profile and histologic grade are currently the 2 most important factors in therapeutic decision making for patients with these neoplasms. In our present study, we were interested in determining whether the combination of PWI, DWI, and single-voxel MR spectroscopy with cMRI could help classify oligodendroglial tumors according to their histopathologic grade and genotype.
Indeed, radiologic grading of tumors with cMRI is not always accurate, with a sensitivity in identifying high-grade gliomas ranging from 55% to 83%.5,6,21 It is even more challenging to differentiate grade III from grade II oligodendroglial tumors by using cMRI, as also observed in our study (sensitivity, 65%). However, a combination of cMRI, diffusion, perfusion, and short TE MR spectroscopy data greatly helped to grade oligodendroglial tumors (sensitivity, 82%). Although anaplastic tumors generally tend to enhance after injection of contrast medium, contrast enhancement is not specific enough and does not correlate with tumor grade12,14,22 or molecular profile.12,23 As seen in this study, oligodendroglial tumors located in the insular and the temporoinsular regions were more likely to harbor intact 1p/19q. However, unlike previous reports,16,24 no significant correlation between tumor location and 1p/19q status has been found.
Although ADC values were significantly higher in grade II compared with grade III tumors, as previously reported,25 no significant association between ADC and 1p/19q status was found. These results differ from those published by Jenkinson et al10 in a study of 17 gliomas in which the authors reported no statistically significant difference between grade II and III tumors and showed that tumors with 1p/19q loss were more likely to have lower maximal ADC and mean histogram ADC compared with those with intact 1p/19q. This disparity in results could be explained by the variations in the number of patients included (50 in our study vs 17 in the Jenkinson et al study) and by different diffusion parameters assessed in our study and the Jenkinson et al study.
Our results demonstrated a significantly higher rCBV in grade III compared with grade II oligodendroglial tumors. These findings are in concordance with those reported in several,14,26,27 but not all,7,25,28 studies. Unlike the aforementioned studies, in which the authors reported no significant difference in rCBV between grade II and III gliomas, our patient population was more equally distributed. Moreover, our data show that increased rCBV is associated with 1p/19q codeletion in grade II, but not grade III, tumors—an observation that has been reported in few studies.14,26 This finding implies that tumor vascularity is not always predictive of high malignancy, especially in oligodendrogliomas and oligoastrocytomas. Although vascular permeability and blood flow were rarely investigated in previous series of gliomas,8,29 our study shows that rCBV, rCBF, and rK2 from PWI could be significantly different between grade II and III oligodendroglial tumors and between genotypes when only grade II tumors are considered (rCBV and rCBF).
Single-voxel and multi-voxel proton MR spectroscopy have already been used for assessment and grading of gliomas.6,9,27,30 Single-voxel MR spectroscopy could be a disadvantage compared with multi-voxel MR spectroscopy in the exploration of oligodendroglial tumors, particularly because of the heterogeneity of these neoplasms in which it would be very interesting to investigate the entire lesion. However, multi-voxel MR spectroscopy would require longer acquisition time; robust sequence would have to be available (with accurate saturation band to avoid peripheral fat contamination); and more complex postprocessing is required, which is not always consistent with clinical settings. As previously reported,9,27 Cho/Cr and Cho/NAA ratios were significantly higher in grade III compared with grade II oligodendroglial tumors. Elevated Cho levels indicate increased membrane synthesis and increased cellularity,31,32 which are characteristics of high-grade gliomas.15 Oligodendroglial tumors with or without 1p/19q deletions could not be distinguished by metabolite ratios, which suggests that investigated metabolites do not contribute to the differences in clinical behavior.13
Finally, in our study, random forest statistical analysis has shown that multimodal MR imaging (17% misclassification error and 82% sensitivity to distinguish grade III from grade II) could notably improve the classification accuracy of patients with oligodendroglial tumors according to tumor grade compared with cMRI alone (31% misclassification error and 65% sensitivity to distinguish grade III from grade II). This improvement in classification accuracy between multimodal MR imaging and cMRI was less marked in genotyping (40% misclassification error, and 79% sensitivity for multimodal MR imaging vs 48% misclassification error, and 70% sensitivity to separate 1p/19q intact from 1p/19q codeletion genotype for cMRI). This finding could be explained by absence of significant correlations between the 1p/19q molecular profile and the DWI, PWI (except rCBV and rCBF when only grade II tumors were considered), and MR spectroscopy parameters evaluated in this study and by the strong influence of tumor location on the genotyping accuracy.
Although random forest analysis could be used prospectively to give statistical prediction of grade or genotype, we do not intend to suggest its use for therapeutic decisions. Here, rather we aimed to evaluate the potential contribution of noninvasive multimodal MR techniques to the grading and genotyping of oligodendroglial tumors compared with cMRI. Multimodal MR imaging could also help in the preoperative treatment of patients, when complete resection cannot be performed, by guiding the biopsy to the more aggressive part of the tumor. However, for now, MR imaging is not intended to replace histopathologic examination, and any therapeutic decisions will be made after such examination. It is important to note that no additional contribution was found when we added long TE MR spectroscopy data to the analysis. Thus, when available scan time is limited, MR spectroscopy data at short TE should be acquired preferably to better differentiate between tumor grades and genotypes.
Conclusions
Nowadays, histopathology examination is still the reference standard for grading and classifying brain tumors. Our method showed that combining perfusion, diffusion, and spectroscopy measurements with cMRI data, in pretherapeutic MR imaging scans, could improve the accuracy to discriminate grade III from grade II oligodendroglial tumors with a sensitivity and specificity of 82% and 84%, respectively, but this multimodal investigation has a lower contribution to genotyping these tumors compared with cMRI alone. However, adding some advanced MR imaging techniques to cMRI could noninvasively provide valuable information that may assist clinicians in patient preoperative management and treatment decision making.
Acknowledgments
The authors express their gratitude to Patrick Viout for his great work on MR spectroscopy data postprocessing and Yann Le Fur for software development.
Footnotes
Disclosures: Olivier Chinot—UNRELATED: Consultancy: Roche; Payment for Lectures (including service on speakers bureaus): MSD; Patents (planned, pending, or issued): in the field of predictive markers or targeted therapies; Travel/Accommodations/Meeting Expenses Unrelated to Activities Listed: for Congress. Nadine Girard—RELATED: Support for Travel to Meetings for the Study or Other Purposes: Olea Medical, Comments: the money is not paid directly to me; UNRELATED: Consultancy: Olea Medical, Comments: the money is not paid directly to me; travel expenses and hotel accommodations for scientific meetings.
Paper previously presented at: Annual Meeting of the International Society for Magnetic Resonance in Medicine, May 7, 2012; Melbourne, Australia.
REFERENCES
- Received June 1, 2012.
- Accepted after revision August 12, 2012.
- © 2013 by American Journal of Neuroradiology
In this issue


Jump to section
Related Articles
Cited By...
- Molecular Subtype Classification in Lower-Grade Glioma with Accelerated DTI
- Neuroimaging-Based Classification Algorithm for Predicting 1p/19q-Codeletion Status in IDH-Mutant Lower Grade Gliomas
- Prediction of IDH1-Mutation and 1p/19q-Codeletion Status Using Preoperative MR Imaging Phenotypes in Lower Grade Gliomas
- 3D Pseudocontinuous Arterial Spin-Labeling MR Imaging in the Preoperative Evaluation of Gliomas
- Genetically Defined Oligodendroglioma Is Characterized by Indistinct Tumor Borders at MRI
- Molecular imaging of 1p/19q deletion in oligodendroglial tumours with 11C-methionine positron emission tomography
- Magnetic resonance spectroscopy of paragangliomas: new insights into in vivo metabolomics