
Abstract
BACKGROUND AND PURPOSE: ADC provides a measure of water molecule diffusion in tissue. The aim of this study was to evaluate whether the fractional change in ADC during therapy can be used as a valid predictive indicator of treatment response in head and neck squamous cell carcinoma treated with chemoradiotherapy.
MATERIALS AND METHODS: Forty patients underwent DWI at pretreatment and 3 weeks after the start of treatment. The pretreatment ADC, fractional change in ADC, tumor regression rate, and other clinical variables were compared with locoregional control and locoregional failure and were analyzed by using logistic regression analysis and receiver operating characteristic analysis. Furthermore, progression-free survival curves divided by the corresponding threshold value were compared by means of the log-rank test.
RESULTS: The fractional change in ADCprimary, the fractional change in ADCnode, primary tumor volume, nodal volume, tumor regression ratenode, N stage, and tumor location revealed significant differences between locoregional failure and locoregional control (P < .05). In univariate analysis, the fractional change in ADCprimary, fractional change in ADCnode, tumor regression ratenode, N stage, and tumor location showed significant association with locoregional control (P < .05). In multivariate analysis, however, only the fractional change in ADCprimary was identified as a significant and independent predictor of locoregional control (P = .04). A threshold fractional change in ADCprimary of 0.24 revealed a sensitivity of 100%, specificity of 78.7%, and overall accuracy of 84.8% for the prediction of locoregional control. Progression-free survival of the 2 groups divided by the fractional change in ADCprimary at 0.24 showed a significant difference (P < .05).
CONCLUSIONS: The results suggest that the fractional change in ADCprimary is a valid imaging biomarker for predicting treatment response in head and neck squamous cell carcinoma treated with chemoradiotherapy.
ABBREVIATIONS:
- ΔADC
- fractional change in ADC
- HNSCC
- head and neck squamous cell carcinoma
- ΔTV
- tumor regression rate
- LRC
- locoregional control
- LRF
- locoregional failure
Approximately two-thirds of patients with head and neck squamous cell carcinoma (HNSCC) present with advanced-stage disease, and regional lymph node involvement is common.1 Surgery with or without adjuvant chemotherapy and/or radiation therapy remains a mainstay of treatment in advanced HNSCC, but radical radiation therapy alone or concurrent chemoradiotherapy as a definitive treatment has become a standard management option for many patients with HNSCC to improve the patient's quality of life via organ preservation. Despite these rigorous treatment methods, however, locoregional disease failure occurs in as many as 30%–40% of cases.2,3 Therefore, if a reliable indicator of response to radiation therapy or chemoradiotherapy before or at an early stage of treatment could be found, patients whose prognoses are likely to be unfavorable with current approaches might be selected for alternative strategies, improving their chances of success and sparing them from ineffective treatment with unnecessary toxicity. It has been impossible, however, to reliably predict early individual treatment response despite careful evaluation by using traditional clinical predictors such as tumor size, clinical stage, tumor location, and lymph node involvement.4
DWI extracts information from the diffusion of water molecules in tissue. Water molecule diffusion motion can be quantified by using the ADC. In general, highly cellular cancers have more restricted diffusion, resulting in lower ADC values, while cancer treatments causing cell death increase water diffusion and lead to a rise in ADC.5
In HNSCC, recent clinical studies have applied DWI to the prediction of treatment response to neoadjuvant chemotherapy, radiation therapy, or chemoradiotherapy before or at an early stage of treatment, revealing that pretreatment ADC correlates with treatment response and that ADC changes at 1, 2, and 4 weeks after the start of treatment can predict treatment response.6⇓⇓–9 In addition, it has been reported that ADC changes at 3 weeks posttreatment can predict treatment response with higher accuracy than morphologic imaging assessment.10 Studies evaluating the predictive value of DWI for treatment response post-radiation therapy and/or chemotherapy are limited, however, and the optimal timing of the evaluation of the DWI and ADC analysis method for predicting the treatment response has not been established, to our knowledge.
The aim of this study was to evaluate the usefulness of the fractional change in ADC (ΔADC) during therapy for prediction of treatment response in patients with HNSCC treated with chemoradiotherapy compared with the other clinical variables and to identify whether the ΔADC during therapy can be used as a valid imaging biomarker for prediction of treatment response.
Materials and Methods
Patient Population
This prospective study was approved by the Committee on Clinical Study at our institution, and written informed consent was obtained from all patients. The study population consisted of patients with histologically confirmed primary HNSCC who were treated with chemoradiotherapy between January 2008 and September 2012 at our institution. Patient selection was performed according to the inclusion and exclusion criteria for this study, summarized in Fig 1. Forty patients who met these criteria were enrolled in this study. Five patients were excluded from the data analysis: 2 who refused the proposed treatment, 2 for whom the MR image quality was poor due to a low signal-to-noise ratio or artifacts, and 1 who died within 3 months after therapy with unknown disease status. Eventually, 35 patients were eligible for the present analysis. Patient characteristics are displayed in Table 1. All tumors were staged according to the 2002 Union for International Cancer Control Tumor, Node, Metastasis staging system.

Patient selection criteria.
Patient characteristics
Treatment and Follow-Up
All patients underwent concurrent chemoradiotherapy. External radiation therapy was administered in 2-Gy daily standard fractions by using 4-MV x-ray, and CT-based 3D conformal radiation therapy was mandatory. The gross tumor volume and the bulky lymph nodes were treated with up to 60–70 Gy (median, 68.4 Gy). A prophylactic nodal area was irradiated with up to 40–50 Gy (median, 44.6 Gy). Patients received concurrent chemotherapy by using S-1 and cisplatin: S-1 at the dose of 60 mg/m2 for 3 weeks followed by 1 week of rest plus weekly cisplatin at the dose of 30 mg/m2 for 3 weeks followed by 1 week of rest (n = 25) or cisplatin, 100 mg/m2, at weeks 1 and 4 (n = 10). Chemotherapy was repeated every 4 weeks for 2 courses.
Pretreatment diagnostic examinations included contrast-enhanced CT in all patients, [18F]FDG-PET/CT in 20 patients, and panendoscopy with biopsy in all patients. For routine pretreatment examinations, MR imaging with DWI was performed in all patients. Pretreatment MR imaging with DWI was performed from 1 to 10 days before the start of treatment, and a second MR imaging with DWI was performed at 3 weeks after the start of treatment. In the previous study of the usefulness of DWI in predicting the response to neoadjuvant chemoradiotherapy forHNSCC, a significant ADC change to predict the treatment response was obtained at a cumulative dose of 30 Gy.11 Therefore, in this study, the second MR imaging with DWI was performed at 3 weeks after the start of treatment, reaching a cumulative dose of 30 Gy to the primary tumors and metastatic nodes. After the treatment, patients were followed to evaluate locoregional control (LRC) by clinical examination and a panendoscopy, followed by biopsy in cases of suspected residual disease.
In addition, routine follow-up contrast-enhanced CT and MR imaging were performed every 6 months during the follow-up period. The follow-up period was designated as the total time of follow-up starting at treatment completion and ending with either tumor recurrence or at the last patient contact without tumor recurrence. Tumor recurrence was defined at primary and nodal sites by a persistent or recurrent mass with either histopathologic proof or an increase in lesion size on serial CT or MR imaging examinations. A time line describing the consecutive methodologic steps in this study is shown in Fig 2. The progression-free survival period was defined as the time between assignment and disease progression, death, or last known follow-up. The median follow-up period for all patients was 30.8 months (range, 7–56 months); the median follow-up in survivors (no evidence of disease) was 37.6 months (range, 24–56 months).

Time line illustrating the consecutive methodologic steps in this study.
MR Imaging and Imaging Analysis
Diffusion-Weighted MR Imaging.
MR imaging was performed by using a 1.5T system (Avanto; Siemens, Erlangen, Germany) with a neck coil or a neurovascular coil. All sequences extended from the skull base to the thoracic outlet. The imaging protocol consisted of the following: T2-weighted axial and coronal images acquired by using a turbo spin-echo sequence (TR/TE = 4000/90 ms, 512 × 256 matrix), and T1-weighted axial images acquired by using a gradient recalled-echo sequence (TR/TE = 630/12 ms, 512 × 256 matrix). DWI was performed with a single-shot spin-echo echo-planar imaging sequence by using a short inversion recovery time for fat suppression (TR/TE/TI = 4000/68/180 ms, 512 × 256 matrix). The sequence was repeated for 3 values of the motion-probing gradients (b=0, 90, and 800 s/mm2). The motion-probing gradients were placed on the 3 directions with the same strength. The FOV was 25 cm, and the section thickness was 6 mm with an intersection gap of 3 mm. The ADC map was reconstructed for each pixel by the b-values of 90 and 800 s/mm2 by using the standard software on the console (syngo; Siemens).
Imaging Analysis.
All primary tumors and lymph nodes diagnosed as metastatic nodes on pretreatment clinical and imaging assessment were evaluated on MR imaging with DWI performed from 1 to 10 days before the start of treatment and MR imaging with DWI performed at 3 weeks after the start of treatment, respectively. Because the images of HNSCC are subject to artifacts induced by continuous physiologic motion such as breathing and swallowing as well as susceptibility artifacts, automated evaluation of serial changes in ADC, such as a histogram-based or voxelwise approach incorporating registered image datasets between treatment interval examinations, may be needed to decrease interpretation error. Therefore, in this study, the mean value of ADC of the whole tumor and the mean change in ADC during treatment were used. ROIs were independently placed over all targeted lesions on every section of the ADC map, and the ADC values for the sections were averaged to obtain the mean value of ADC of the whole tumor for each of the patients at each measurement time point. For region-of-interest placements in the lesions, care was taken to include the solid portions of the lesions and to exclude any obviously cystic or necrotic areas in reference to the T2WI. In addition, these ROIs were used to measure the whole tumor volume. In each primary tumor and metastatic node, whole tumor volume was calculated by multiplying each cross-sectional area by the section thickness. These procedures were performed separately and independently by 2 observers (M.M. and Y.K., with 15 and 20 years of experience in head and neck MR imaging, respectively) who were blinded to the information regarding local failure or control. All ADC and tumor volume measurements were performed twice by each observer.
The ΔADC at 3 weeks for each primary tumor and metastatic node was calculated on the basis of the ADC values at pretreatment and 3 weeks after the start of treatment by using the formula
 where ADCpre represents the pretreatment ADC values and ADC3W represents the ADC values at 3 weeks after the start of treatment.
In addition, the tumor regression rate (ΔTV) for each primary tumor and metastatic node was calculated on the basis of the tumor volume at pretreatment and 3 weeks after the start of treatment by using the formula
 where TVpre represents the pretreatment tumor volume and TV3W represents the tumor volume at 3 weeks after the start of treatment.
Statistical Analysis
The intraobserver and interobserver variability of region-of-interest placement for the measurement of ADC and tumor volume of primary tumors and metastatic nodes was analyzed by calculating the interclass correlation coefficient for single measurements (0–0.20 is considered poor; 0.21–0.40, as fair; 0.41–0.60, as moderate; 0.61–0.80, as good; and 0.81–1.00, as excellent correlation). The pretreatment ADC; ΔADC; primary tumor volume; primary nodal volume; ΔTV; and the other clinical variables such as age, T stage (T1–2 versus T3–4), N stage (N0–1 versus N2–3), and tumor location (hypopharynx or oral cavity versus others) were compared with LRC and locoregional failure (LRF) by using a Mann-Whitney U test. The univariate/multivariate nominal logistic analysis was used to assess the correlation between LRC and the same variables described above. Then, a receiver operating characteristic analysis with the area under the curve was used to investigate the discriminatory capability of the significant predictive value of LRC. For calculation of the sensitivity, specificity, and accuracy of the significant predictive value of LRC, the optimal threshold was determined by giving equal weighting to sensitivity and specificity on the receiver operating characteristic curve.
Finally, to determine the usefulness of ΔADC for the prediction of prognosis after chemoradiotherapy, we compared progression-free survival for the 2 groups divided by the optimal threshold value by using the Kaplan-Meier method followed by the log-rank test.
Statistical calculations were performed by using statistical analysis software (Statistical Package for the Social Sciences, Version 15.0; IBM, Armonk, New York), and P values < .05 were considered statistically significant.
Results
Treatment Outcome
During the follow-up period, complete LRC was achieved in 21 of 35 patients (60%). Four of 35 patients (11.4%) developed an isolated local recurrence. Five of 35 patients (14.3%) developed a regional recurrence without primary tumor recurrence. Five of 35 patients (14.3%) developed a simultaneous locoregional tumor recurrence. Patients with locoregional recurrence were treated with salvage surgery and/or neck dissection with or without adjuvant chemotherapy. In patients whose tumors were inoperable, only chemotherapy was performed. Three of 35 patients (8.6%) died during the follow-up period because of the extent of local recurrent tumor.
Observer Agreement
The intraobserver and interobserver agreement for the ADC measurement was 0.81 and 0.73 on primary tumors and 0.91 and 0.82 on metastatic nodes, respectively. The intraobserver and interobserver agreement for the tumor volume measurement was 0.80 and 0.70 on primary tumors and 0.92 and 0.83 on metastatic nodes, respectively.
Analysis of Variables for Treatment Response
All DWI examinations of eligible patients for the present analysis were performed successfully. A representative case is shown in Fig 3.

A 68-year-old man with hypopharyngeal cancer (poorly differentiated squamous cell carcinoma). A, Pretreatment transverse T2-weighted MR image shows a primary hypopharyngeal cancer (arrow). B, The pretreatment ADC map derived from the DWI shows that the corresponding ADC value was 1.11 × 10⁻³ mm2/s for the manually placed region of interest covering the tumor. C, At 3 weeks after the start of treatment, the T2-weighted MR image shows a mass with marked regression (arrow). D, The ΔADCprimary at 3 weeks of treatment is 0.69.
Comparison of variables in LRC and LRF and univariate and multivariate analysis of variables in association with LRC are summarized in Table 2. The ΔADCprimary, ΔADCnode, primary tumor volume, primary nodal volume, ΔTVnode, N stage, and tumor location revealed significant differences between LRC and LRF; however, there was no significant difference in ADCprimary, ADCnode, ΔTVprimary, age, and T stage. In univariate logistic analysis, ΔADCprimary, ΔADCnode, ΔTVnode, N stage, and tumor location showed significant association with LRC. Primary tumor volume and primary nodal volume showed no significant association. In multivariate logistic analysis after variable selection with the use of the forward stepwise method, only ΔADCprimary was identified as a significant and independent predictor of LRC.
Comparison of variables in LRC and LRF/univariate and multivariate analysis of variables in association with LRC
The receiver operating characteristic analysis resulted in a threshold ΔADCprimary of 0.24 and an area under the curve of 0.9. The 2-by-2 contingency table based on a ΔADCprimary of 0.24 revealed a sensitivity of 100%, specificity of 78.7%, positive predictive value of 76.7%, negative predictive value of 100%, and overall accuracy of 84.8% for the prediction of LRC.
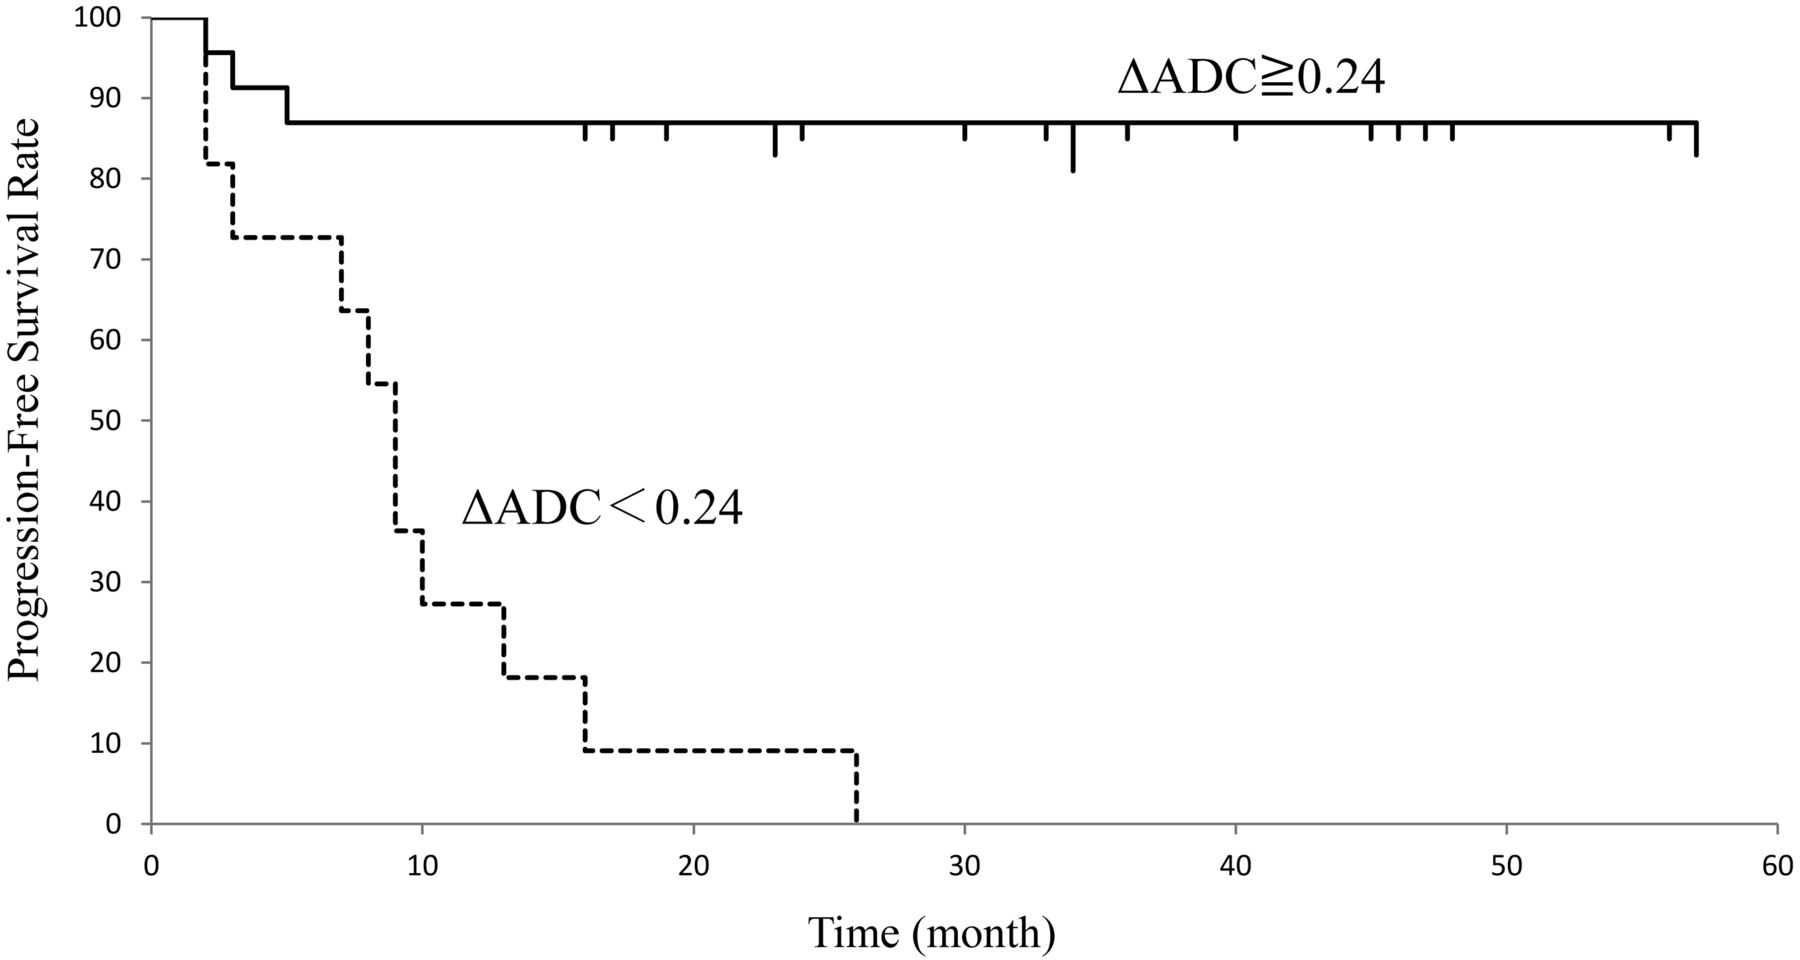
The progression-free survival curves in patients with ΔADCprimary ≥ 0.24 and ΔADCprimary < 0.24 are shown in Fig 4. The median progression-free survival period of patients with ΔADCprimary < 0.24 was 11.5 ± 7.6 and that of patients with ΔADCprimary ≥ 0.24 was 32.8 ± 8.2. The difference in progression-free survival between the 2 groups divided by the threshold value of ΔADCprimary was significant (P < .05).

Progression-free survival of patients with head and neck squamous cell carcinoma assessed by ΔADC. The graph shows that the median progression-free survival period of patients with ΔADC ≧ 0.24 was significantly longer than that of patients with ΔADC < 0.24 (P < .05).
Discussion
In previous clinical studies evaluating the use of DWI to predict treatment response to radiation therapy or chemoradiotherapy in HNSCC, 2 ADC parameters—namely, pretreatment ADC and the change in ADC during or early after treatment—have been shown to be useful. Kim et al6 reported the usefulness of pretreatment ADC for predicting the treatment response of neck lymph nodes at the end of treatment. In addition, Hatakenaka et al7 reported the usefulness of pretreatment ADC for predicting local failure during follow-up after chemoradiotherapy or radiation therapy. On the other hand, Vandecaveye et al8 reported that the change in ADC at 2 and 4 weeks of treatment correlated significantly with the LRC and was more accurate than volumetric changes for the prediction of treatment outcome. In addition, King et al9 reported that a strong significant correlation was found between LRF and serial change in ADC. Thus, the optimal timing of the evaluation of ADC and its analysis method for predicting the treatment response to chemotherapy or chemoradiotherapy in HNSCC have not been established.
In the current study, the ΔADCprimary at 3 weeks of treatment was significantly lower for lesions with LRF than for those with LRC, and in the multivariate analysis, only ΔADCprimary revealed a significant association with LRC. By contrast, pretreatment ADCprimary was not statistically correlated with LRC. In addition, the ΔADCprimary threshold value of 0.24 resulted in 100% sensitivity and 100% negative predictive value for the prediction of LRC. The high negative predictive value of ΔADCprimary may help to predict patients with LRF of chemoradiotherapy at the early phase of treatment. Furthermore, in comparison of progression-free survival by using the ΔADCprimary threshold value of 0.24 for distinguishing the LRC group from the LRF group, the patients with ΔADCprimary ≥ 0.24 showed better prognosis than those with ΔADCprimary < 0.24. Therefore, our results indicate that ΔADCprimary is a potential predictive indicator of treatment response to chemoradiotherapy but that pretreatment ADCprimary is not. However, further studies that prospectively use the thresholds obtained in this study are necessary to determine the real significance of ΔADCprimary for prediction and management of patients with HNSCC treated with chemoradiotherapy.
In many previous clinical and animal model studies, tumors showing a rise in the ADC at an early phase of treatment showed a better treatment response than those with little or no ADC rise.12,13 Although the mechanism of rise in the ADC at an early phase of treatment following cytotoxic and radiation treatment in experimental and human tumors is not fully understood, it has been speculated that a rise in ADC might be attributed to an increase in the fractional volume and diffusion of water molecules in the extracellular space that occurs with the disorganized microstructure in necrosis and apoptosis in response to treatment.14 Therefore, ΔADC at an early phase of treatment seems to reflect the degree of tumor cell damage resulting from the treatment. However, because the treatment response may be attributed to differences in tumor aggressiveness, the treatment method, or the intensity of treatment, the use of only a single ADC measurement at pretreatment appears to be inadequate for the prediction of treatment response. Therefore, evaluating the ΔADC may be necessary for the prediction of treatment response.
The induction of tiny regions of liquefaction necrosis at the early phase of treatment may interfere with ADC measurement.15 For this reason, there may be a misleading and misrepresentative rise in ADC despite the persistence of viable tumor components. In the ADC measurement in our study, it may have been difficult to distinguish tiny liquefaction necrosis from lesions at 3 weeks of treatment because the lesions were visually associated on the ADC map in reference to T2WI for tumor heterogeneity. Therefore, we used the mean value of ADC of the whole tumor and the mean change in ADC during treatment. The use of the mean change in ADC may be explained by the fact that the specificity and positive predictive value of ΔADC were low in the current study. In brain tumor, quantification of diffusion changes has evolved from the mean change in ADC to a voxel-by-voxel approach, termed the “functional diffusion map,” as a biomarker for treatment response.16 In the functional diffusion map, treatment response is evaluated on the basis of the fractional volume of significantly increased ADC within tumor. In the study by Galbán et al17 of the functional diffusion map of HNSCC, the change in ADC assessed by the functional diffusion map was superior to the percentage change of the mean ADC in prediction of disease control after chemoradiotherapy. Therefore, in the future, more automated evaluations, such as a voxel-by-voxel approach, may be needed to estimate the change in ADC during treatment more accurately. However, it may be difficult to implement it in routine examinations for organs outside the brain due to differences in the orientation of images and artifacts induced by continuous physiologic motion.
In many previous studies that used DWI to examine the treatment response in HNSCC, a maximum b-value of 1000 s/mm2 was used.6⇓⇓⇓–10 Preferentially, a standardized ADC calculation by using at least 3 b-values, including a maximum b-value exceeding 500 s/mm2, should be performed.18 In the current study, a maximum b-value of 800 s/mm2 was used to limit the possible effects of distortion due to susceptibility artifacts and to reduce the signal-to-noise ratio on the ADC value; such factors are problems at high b-values. In this study, only 2 patients were excluded from this study due to a low signal-to-noise ratio or artifacts of DWI. The merit of ADC values differs with b-values because they are influenced by tissue perfusion and T2 time, and it may be desirable for accurate ADC measurement that 1 of the b values not be zero. Therefore, in this study, ADC values were calculated from b-values of 90 and 800 s/mm2, and DWI with a b-value of zero was used for image registration.
With regard to the relationship between the ADC of metastatic nodes and treatment response, Kim et al6 reported that the change in ADC of metastatic nodes within the first week of chemoradiotherapy was more useful for predicting treatment response than pretreatment ADC. In addition, Vandecaveye et al8 reported that the change in the ADC of metastatic nodes at 2 and 4 weeks after the start of treatment correlated significantly with 2-year LRC. In this study, ΔADCnode revealed a significant difference between LRC and LRF and showed a significant association with LRC in univariate analysis. Therefore, our results were comparable with theirs, and it was suggested that the change in ADC of metastatic nodes during treatment may be useful for the prediction of treatment response and/or LRC. The primary sites of HNSCC are generally located at the air-tissue interface and in areas prone to motion artifacts induced by physiologic motion such as breathing and swallowing. Therefore, in DWI, the primary sites seem to be more influenced by physiologic motion and susceptibility artifacts than cervical lymph nodes. In addition, in variability analysis of region-of-interest placement for measurements of ADC, intraobserver and interobserver agreement of the metastatic nodes tended to be higher than those of the primary tumors in this study. Therefore, although only the ΔADCprimary was identified as a significant and independent predictor of LRC in this study, the possibility that ADC values from the metastatic nodes may predict LRC in patients with HNSCC treated with chemoradiotherapy was thought to have great clinical significance.
The value of the primary tumor volume and T stage as a prognostic factor in HNSCC has been reported in published studies for multiple subsites and different treatment modalities.7,19 However, in the current study, primary tumor volume and T stage did not show a significant correlation with LRC. Most previously published studies included patients treated with single-technique therapy (radiation therapy or surgery alone). However, in this study, all patients were treated with definitive concurrent chemoradiotherapy. There have been many reports that definitive concurrent chemoradiotherapy leads to better clinical outcome than single-technique therapy in HNSCC.20 Therefore, it was speculated that clinical outcome after definitive concurrent chemoradiotherapy might not be significantly influenced by primary tumor volume or T stage.
In patients with HNSCC treated with chemoradiotherapy, controversies remain concerning the role of neck dissection for the management of the neck with bulky lymph node involvement.21 There is no consensus on the treatment of patients with a complete regional response after treatment. With regard to the regional recurrence after chemoradiotherapy, it has been reported that lymph node residual size and the regression rate of nodal maximal diameter or nodal volume after treatment might be useful for the prediction of regional recurrence.22,23 In this study, we evaluated the usefulness of the tumor regression ratio at 3 weeks after the start of chemoradiotherapy for prediction of LRC. As a result, ΔTVnode revealed a significant difference between LRC and LRF and showed significant association with LRC in univariate analysis. Therefore, if prediction of regional recurrence is possible by the tumor regression rate of metastatic nodes during treatment, it has great clinical significance. In the future, it would be interesting to evaluate whether ΔTVnode may be a useful criterion to guide clinical decisions regarding neck dissection after chemoradiotherapy.
There are limitations to our study. First, the patient population was relatively small and heterogeneous, including those with tumors from various head and neck sites. Also in this study, patients with oral cavity cancer were included. Surgery is usually the preferred treatment option in patients with oral cavity carcinoma, but these patients whose disease was considered inoperable because of tumor extent and/or medical reasons were enrolled in this study. Therefore, further studies with a large number of patients without potential selection bias are needed because direct comparison among DWI and other predictive or prognostic factors is necessary to show the actual clinical significance of our findings. Second, the biologic differences in squamous cell carcinomas due to differences in smoking and alcohol use as well as molecular markers such as epidermal growth factor receptor expression and human papillomavirus infection have been suggested as prognostic factors.24 In particular, human papillomavirus–positive oropharyngeal carcinoma has emerged as a new entity with an excellent overall survival rate, but the patients in this study were not tested for human papillomavirus infection.
Conclusions
DWI provides information that may be used as a predictive imaging biomarker of LRC in patients with HNSCC treated by chemoradiotherapy. The ΔADCprimary at 3 weeks during treatment is a valid predictive clinical factor, showing a significant association with LRC. Thus, sequential DWI may help to avoid ineffective treatment and unnecessary toxicity, allowing chemoradiotherapy to be selectively used for appropriate patients.
References
- Received February 17, 2013.
- Accepted after revision May 17, 2013.
- © 2014 by American Journal of Neuroradiology


Jump to section
Related Articles
Cited By...
- In Vivo Test-retest Quantitative Characterization of Echo Planar Imaging Apparent Diffusion Coefficient Reproducibility for Head and Neck Cancers on a 1.5T MR-Linac Platform: Technical Validation using QIBA Metrology
- Longitudinal diffusion and volumetric kinetics of head and neck cancer magnetic resonance on a 1.5T MR-Linear accelerator hybrid system: A prospective R-IDEAL Stage 2a imaging biomarker characterization/ pre-qualification study
- Prospective validation of diffusion-weighted MRI as a biomarker of tumor response and oncologic outcomes in head and neck cancer: Results from an observational biomarker pre-qualification study
- The Predictive Value of Early Assessment After 1 Cycle of Induction Chemotherapy with 18F-FDG PET/CT and Diffusion-Weighted MRI for Response to Radical Chemoradiotherapy in Head and Neck Squamous Cell Carcinoma
- Diffusion-Weighted Imaging of Nasopharyngeal Carcinoma: Can Pretreatment DWI Predict Local Failure Based on Long-Term Outcome?