
Abstract
BACKGROUND AND PURPOSE: MR plaque imaging is used to evaluate the risk of embolic complications during carotid endarterectomy and carotid artery stent placement. However, its performance for characterizing intraplaque components has varied across studies and is generally suboptimal. Hence, we correlated MR imaging results with histologic findings to determine whether a combination of high-contrast T1-weighted imaging and quantitative image analysis could readily determine plaque characteristics.
MATERIALS AND METHODS: We prospectively examined 40 consecutive patients before carotid endarterectomy by using a 1.5T scanner and axial T1-weighted spin-echo images under optimized scanning conditions. The percentage areas of intraplaque fibrous tissue, lipid/necrosis, and hemorrhage were calculated automatically by using the software with previously reported cutoff values and were compared with those of the specimens. The thickness of the fibrous cap was also measured manually.
RESULTS: The percentage areas of fibrous, lipid/necrotic, and hemorrhagic components were 5.7%–98.7%, 1.3%–65.7%, and 0%–82.0%, respectively, as determined by the MR images, whereas the corresponding values were 4.8%–92.3%, 7.0%–93.8%, and 0%–70.4%, respectively, as determined by histologic examination. Significant positive correlation and agreement were observed between MR images and histologic specimens (r = 0.92, 0.79, and 0.92; intraclass correlation coefficients = 0.91, 0.67, and 0.89; respectively). Thickness of the fibrous caps on MR images (0.21–0.87 mm) and in the specimens (0.14–0.83 mm) also showed positive correlation and agreement (r = 0.61, intraclass correlation coefficient = 0.59).
CONCLUSIONS: Quantitative analysis of high-contrast T1-weighted images can accurately evaluate the composition of carotid plaques in carotid endarterectomy candidates.
ABBREVIATIONS:
- ICC
- intraclass correlation coefficient
- SE
- spin-echo
Estimation of the composition of carotid plaques is important to help identify the risk of embolic events during carotid endarterectomy or carotid artery stent placement. Ultrasonography has commonly been used for this purpose, but it is not useful in cases of extensive calcification or if the plaque is in a higher location; furthermore, ultrasonography lacks reliable and versatile quantitative metrics.1⇓⇓–4 Thus, as a complement to ultrasonography, MR plaque imaging is now widely used to estimate plaque composition. However, plaque characterization remains unsatisfactory, presumably owing to the deterioration of image contrast, secondary to inappropriate scanning techniques and/or protocols.5 Recently, a nongated T1-weighted spin-echo (SE) technique with appropriately fixed scanning parameters was reported to improve and stabilize intraplaque contrast, compared with a cardiac-gated black-blood fast spin-echo technique in which T1-weighting tended to be attenuated and fluctuated according to a heart-rate-dependent setting of the TR.6 The nongated T1-weighted spin-echo method has been found to allow accurate estimation of the main plaque components with minimal overlap,7 suggesting potential advantages over other imaging modalities in terms of plaque characterization. However, quantitative evaluation of intraplaque composition has not been achieved by this method. Hence, in the present study, we used a quantitative color-coded image-analysis software to characterize intraplaque distribution by percentage area of fibrous, lipid/necrotic, and hemorrhagic tissues and to determine the accuracy of this method for predicting plaque characteristics by correlating the results with histologic findings from the carotid endarterectomy specimens.
Materials and Methods
Patients
From April 2009 to July 2010, we prospectively examined 40 consecutive male patients (age range, 59–82 years; mean age, 69.5 years) with stenosis of the cervical internal carotid artery, all of whom underwent carotid endarterectomy. Of these patients, 30 had symptomatic stenosis of ≥70%, and 10 others had asymptomatic stenosis of ≥80%. The clinical profiles of the patients included hypertension in 38 patients, hyperlipidemia in 22, and diabetes mellitus in 13. All of the study examinations were carried out after obtaining approval from the institutional review board and written informed consent from the patients.
Imaging Protocol
Axial 2D SE T1-weighted images of the affected carotid bifurcation were obtained by using a 1.5T MR imaging scanner (Echelon Vega; Hitachi Medical, Tokyo, Japan) and an 8-channel neurovascular coil. The pulse sequence parameters were as follows: TR/ TE, 500 /12 ms; FOV, 18 cm; section thickness, 4.0 mm with an intersection gap of 1 mm; number of sections, 9; and NEX, 2. A radial k-space acquisition technique with self-navigation, which is similar to the periodically rotated overlapping parallel lines with enhanced reconstruction method, was used for motion correction.8 In this technique, 40 radially rotating blades with 10 parallel phase-encoding lines and readout encoding of 256 steps, which caused oversampling at the center of the k-space, were obtained (acquisition time: 6 minutes 46 seconds), and mutual phase corrections among the blades were performed as a self-navigation for compensating nonrigid motions. After rebinning to Cartesian coordinates with zero-fill interpolation, images with a matrix size of 512 × 512 (apparent pixel size, 0.35 × 0.35 mm) were obtained. Chemical shift selective saturation pulses within the planes and nonselective saturation pulses at the superior and inferior sides were used as fat-suppression and black-blood techniques, respectively. The section direction was carefully set in a plane perpendicular to the long axis of the carotid bifurcation on sagittal 2D phase-contrast MR angiographic images.
Histologic Preparation
Specimens excised en bloc from the affected carotid arteries were submitted for histologic evaluation. The specimens were fixed in formaldehyde, and transverse sections of the carotid bifurcations that were carefully cut to correspond in direction and position to those of the MR images were obtained. During histologic preparation, hematoxylin-eosin, Masson trichrome, and antiglycophorin-A stains were applied to paraffin-embedded 7-μm-thick sections.
Data Processing and Statistical Analyses
Data processing was performed by one of the authors (S.N.) who was blinded to the clinical and imaging findings. The MR image data the from the DICOM files for the sections of the maximum plaque size were transferred to the plaque analysis software package (PlaqueViewer; Hitachi Medical), which automatically divided internal areas of the plaques into 3 color-coded components (ie, fibrous tissue, green; lipid/necrosis, yellow; and hemorrhage, red) according to the contrast ratios of the plaques to the adjacent muscle, with the cutoff values of 1.17 (fibrous versus lipid/necrosis) and 1.55 (lipid/necrosis versus hemorrhage) that were obtained in a previous study.7 Next, the percentage areas of each component were automatically calculated. In addition, in patients with yellow and/or red areas within the plaques suggesting lipid/necrotic and/or hemorrhagic components, the thickness of the fibrous cap, shown as the green area between the yellow/red area and the adjacent arterial lumen, was manually measured on the color-coded images 3 times by using a linear cursor and the values were averaged.
On the specimen sections that corresponded to the MR images, the same blinded operator measured areas of fibrous, lipid/necrotic, and hemorrhagic tissue as well as the thicknesses of fibrous caps 3 times through a manual tracing method by using a software package (ImageJ, Version 1.44; National Institutes of Health, Bethesda, Maryland), and the values were averaged.
For statistical analyses, Pearson correlation coefficients (r) and intraclass correlation coefficients (ICCs) were assessed to determine correlation and agreement between the percentage areas of each component and the thickness of the fibrous caps in the color-coded MR images and the specimens. The ICC was also used to determine intraoperator agreements for the manual measurements.
Results
Six patients were excluded because of substantial motion artifacts, and the remaining 34 patients (mean age, 70.2 years) were eligible for further analysis. The ICCs of manual measurements for MR images and histologic specimens were 0.99 and 0.99, respectively, indicating excellent intraoperator agreements.
The percentage areas of fibrous tissue, lipid/necrosis, and hemorrhage on the color-coded MR images ranged from 5.7% to 98.7% (median, 24.7%), 1.3% to 65.7% (22.2%), and 0% to 82.0% (41.0%), respectively, while those on the histologic specimens ranged from 4.8% to 92.3% (21.0%), 7.0% to 93.8% (33.8%), and 0% to 70.4% (35.8%), respectively. Excellent or good positive correlation and agreement were observed between the color-coded maps and the specimens (r = 0.92, 0.79, and 0.92; ICC = 0.91, 0.67, and 0.89, respectively) (Table and Figs 1 and 2).
Percentage of areas of intraplaque components and fibrous cap thicknesses on color-coded MR images and histologic specimensa

Correlation and agreement between percentage area of intraplaque components and fibrous cap thickness observed in MR images and histologic specimens. Excellent positive correlation and agreement were observed between the percentage areas of the fibrous tissue and hemorrhagic areas within the plaque determined on MR images and histologic specimens. Percentage areas of lipid/necrosis and thickness of the fibrous cap also showed good correlation and agreement. r indicates the Pearson correlation coefficient.

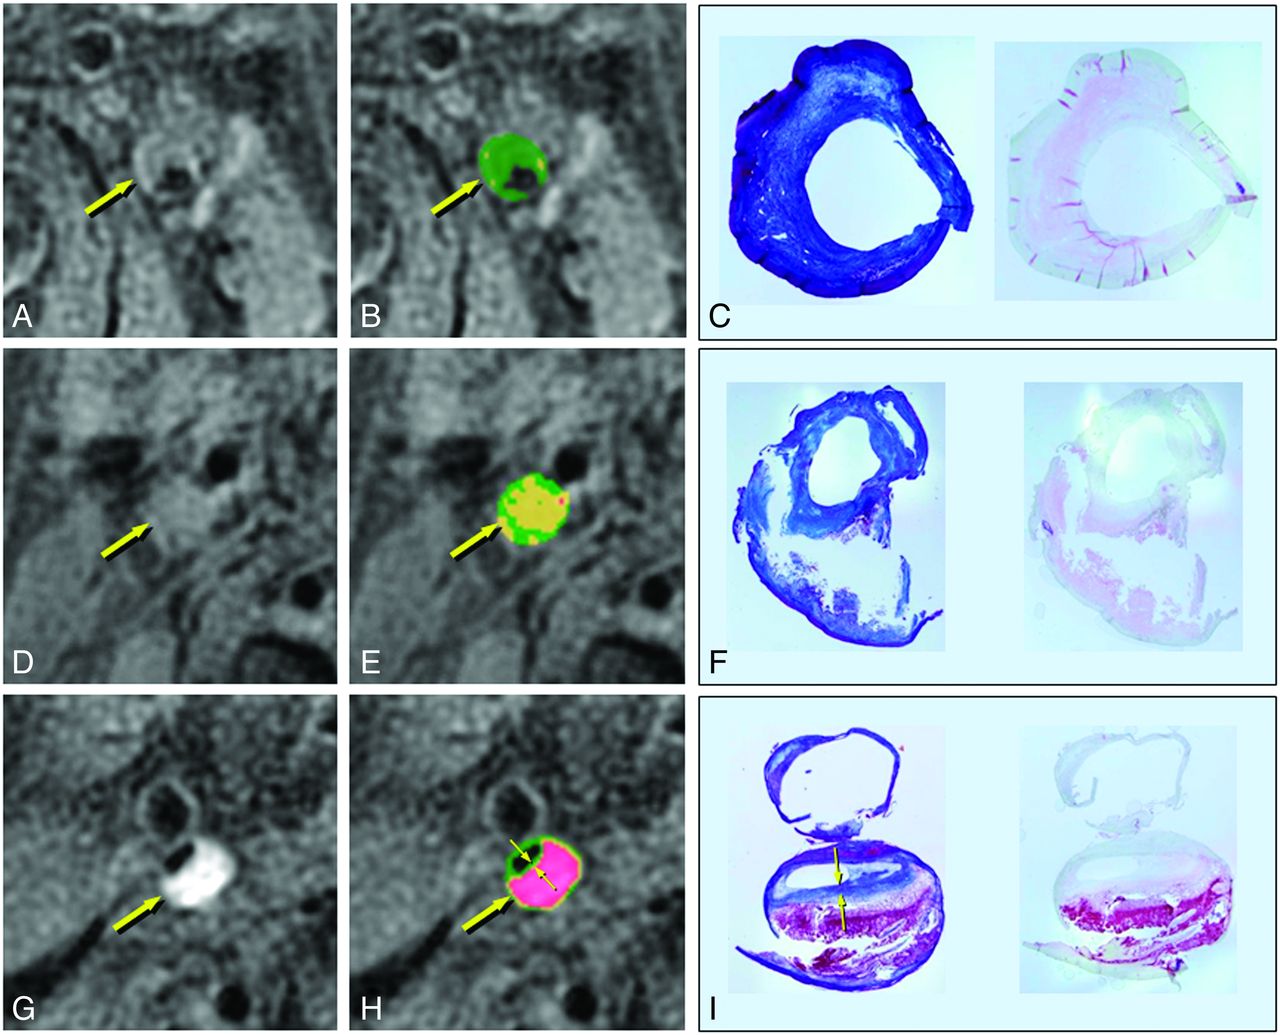
MR imaging and histologic findings of the carotid plaques. A, D, G, T1-weighted images. B, E, H, Color-coded maps. C, F, I, Corresponding histologic specimens (left, Masson trichrome staining; right, antiglycophorin-A staining). A–C, Left carotid stenosis in a 70-year-old man. The plaque shows isointensity to adjacent muscle on the T1-weighted image (A, arrow) and is mainly green on the color-coded map (B, arrow), suggesting a fibrous composition. On histologic examination, the corresponding plaque specimens consist mainly of thick fibrous tissue (C and D). The percentage areas of the fibrous, lipid/necrotic, and hemorrhagic components are 97%, 3%, and 0%, respectively, on MR images and 85%, 15%, and 0%, respectively, in the histologic specimens. D–F, Right carotid stenosis in a 68-year-old man. The plaque shows slight hyperintensity on the T1-weighted image (D, arrow) and is mainly yellow on the color map (E, arrow), suggesting a lipid-rich plaque. The corresponding plaque specimens contained lipid and necrotic tissue that flowed out of the specimen during the tissue preparation (F). The percentage areas of the fibrous, lipid/necrotic, and hemorrhagic components are 35%, 64%, and 1%, respectively, on the MR images, and 33%, 66%, and 1%, respectively, in the corresponding specimens. G–I, Right carotid stenosis in a 74-year-old man. The plaque shows marked hyperintensity on the T1-weighted image (G, arrow) and red on the color map (H, arrow), suggesting intraplaque hemorrhage. In the corresponding pathology specimens, the plaque contains massive hemorrhage with a thin fibrous cap (I). The percentage areas of fibrous, lipid/necrotic, and hemorrhagic components are 17%, 13%, and 70%, respectively, on MR imaging, and 15%, 33%, and 52%, respectively, in the specimens. The fibrous cap thicknesses on the MR images (H, small arrows) and in the specimen (I, small arrows) are 0.47 and 0.39 mm, respectively. (C,F, and I, 3x magnification.)
The thickness of the fibrous caps on MR images was measurable in 25 patients and ranged from 0.21 to 0.87 mm (median, 0.47 mm), while that in the corresponding histologic specimens was 0.14–0.83 mm (0.45 mm), and these results also showed positive correlation and agreement (r = 0.61, ICC = 0.59) (Table and Figs 1 and 2).
Discussion
Unstable (or vulnerable) plaques are usually defined as plaques mainly consisting of lipid/necrosis or hemorrhage with a thin fibrous cap because plaque rupture and subsequent release of embolic materials into distal blood flow can more easily occur in these plaques than in more stable plaques consisting mainly of fibrous tissue.9⇓–11 Several imaging modalities have been used to detect unstable plaques by characterizing intraplaque features. Unstable plaques are characterized by mobility and/or low echogenicity on ultrasonography, low attenuation on CT, and hyperintensity on MR imaging.1⇓⇓⇓⇓⇓–7,11⇓⇓⇓–15 However, the diagnostic performance of all of these modalities varies considerably and remains imperfect.
In this study, we used SE T1-weighted MR images as the source data for quantitative evaluation of carotid plaques. Various imaging protocols and techniques have been applied in MR plaque imaging, and the results in previous reports have varied.5,7,10⇓⇓–13,16,17 Of these protocols, an electrocardiograph-gated 2D fast SE technique with a black-blood method is commonly applied.10,16 However, this method is generally complicated and time-consuming and can obtain only a few sections of imaging. In this method, moreover, the heart rate of patients forces the TR to be inappropriate, resulting in deterioration of image contrast.6,7,17 A magnetization-prepared rapid acquisition of gradient echo technique has also been widely used.18,19 In this technique, however, an inversion pulse for suppressing the blood signal is nonspecific and can attenuate the signal of the lipid/necrotic component that has T1 relaxation times similar to those of blood.
Source images of 3D time-of-flight MR angiography have also been used in several studies.10,17,20,21 This technique can provide stable T1-related contrast but no black-blood effects, suggesting that it would be unsuitable for quantitative analysis based on signal intensity. Recently, a direct comparison of the 4 techniques revealed that the T1-weighted SE technique showed excellent intraplaque contrast and could accurately characterize the main intraplaque components.17 Furthermore, the T1-weighted SE technique combined with the quantitative color map software package is reported to allow clinicians to monitor changes in intraplaque components during medical treatment.22 Hence, we selected a T1-weighted SE technique from among the various MR imaging options to obtain source images for automated quantitative analysis of intraplaque composition. We believe this choice is one of the factors that allowed this study to achieve good correlation and agreement of MR imaging and histologic findings, and these results are comparable with those of previous studies in which multicontrast MR images were used.16,17
In addition to automated estimation of intraplaque components, we attempted to measure the thickness of the fibrous caps because the caps are also considered important for predicting vulnerability of carotid plaques. As a rule, ruptured plaques tend to have thin fibrous caps compared with unruptured plaques.23⇓–25 In previous studies, high-resolution source images of 3D time-of-flight MR angiography or contrast-enhanced T1-weighted images have been evaluated to estimate fibrous cap thickness and have provided good correlation and agreement with histologic findings26; compared with the findings of these studies, our results were unsatisfactory, presumably owing to limited contrast between lipid/necrotic and fibrous tissues and low spatial resolution. Nonetheless, the method was noninvasive and simple.
This study has several limitations. First, only a nongated T1-weighted SE sequence was used for the quantitative analyses, because this sequence showed the best performances to characterize intraplaque components compared with other various T1-weighted, proton-attenuation-weighted, and T2-weighted sequences and was eligible for quantitative analyses in the previous studies.6,7,17,22 On T1-weighted images, the contrast between fibrous and hemorrhagic components is evident because the latter usually has very short T1 relaxation times. In contrast, even when using the most appropriate sequence, the difference in signal intensity between fibrous and lipid/necrotic components tends to be subtle because the T1 relaxation times of these components are similar. This phenomenon can lead to underestimation of the extent of lipid/necrotic tissue and, presumably, is the reason for diminished correlation and agreement for lipid/necrotic areas between MR images and histology specimens in the present study. This issue might be resolved by combining T1-weighted images with other images (eg, T2-weighted images) on which lipid and necrosis show marked hyperintensity compared with fibrous tissues.5,7 For this purpose, a sophisticated program that can handle multiple source data is needed, which we are now developing.
Second, we did not assess the calcific component, which is said to be one of the stable components, of the plaques because calcific regions are barely visualized on MR images by the SE technique used in this study, which is known to be insensitive to calcification; furthermore, the histologic specimens were decalcified during preparation. This limitation may lead to substantial error in the automated analyses applied in this study. To overcome this limitation, susceptibility-sensitive MR imaging techniques such as T2*-weighted imaging, as well as tissue preparation without decalcification, will be needed.
Another limitation involves a technical issue. In this study, 2D images with relatively low spatial resolution were obtained by using the 1.5T scanner and a standard neurovascular coil, and this could have caused substantial errors in quantitative analysis and manual measurement owing to partial volume effects and spatial mismatches with the histologic sections of the specimen. To improve the precision of quantitative analysis of plaque composition and fibrous cap thickness as well as the spatial correspondence between the MR and histologic images, high-field MR imaging scanners and sophisticated 3D imaging techniques with excellent contrast (eg, 3D-T1-weighted FSE), which we are planning to use, are required.27 Finally, we did not investigate whether the quantitative imaging findings correlate with stroke or other adverse events during or after carotid endarterectomy or whether these findings are different between symptomatic or asymptomatic patients because these issues are beyond the scope of this study. Hence, this study provided no direct evidence for prediction of stroke events and perisurgical complications, though the results suggest that the method we used is promising for this purpose. A prospective study to investigate this issue is now ongoing with a larger cohort and the similar imaging protocols.
Conclusions
Quantitative color-coded analyses applying nongated T1-weighted SE images can readily predict the composition of carotid plaques, particularly the percent areas of fibrous and hemorrhagic components, in patients who are carotid endarterectomy candidates.
Footnotes
Disclosures: Shinsuke Narumi—RELATED: Grant: Grant-in-Aid for Strategic Medical Science Research and Grants-in-Aid for Science Research (22890169) from the Ministry of Education, Culture, Sports, Science and Technology of Japan.* Makoto Sasaki—RELATED: Grant: Grant-in-Aid for Strategic Medical Science Research from the Ministry of Education, Culture, Sports, Science and Technology of Japan,* Consulting Fee or Honorarium: Hitachi Medical, Comments: M.S. is a consultant for Hitachi Medical Corporation and has received honoraria from them, UNRELATED: Consultancy: Lundbek, Payment for Lectures (including service on Speakers Bureaus): GE Healthcare, Daiichi, Mitsubishi, Ohtsuka, Sanofi, Johnson & Johnson, Ezai. Jiro Hitomi—UNRELATED: Grants/Grants Pending: Japanese Ministry of Health, Labour, and Welfare,* Comments: projects for the promotion of the indigenous creation and development of innovative medical devices in the Tohoku area. Tetsuhiko Takahashi—UNRELATED: Employment: Hitachi Medical Corporation. Yasuo Terayama—UNRELATED: Grants/Grants Pending: Grant-in-Aid for Scientific Research,* Health Labour Sciences Research Grant,* Payment for Lectures (including service on Speakers Bureaus): Sanofi K.K., Otsuka Pharmaceutical. Hiryuki Itagaki is an employee of Hitachi Medical Corporation. *Money paid to the institution.
This work was partly supported by a Grant-in-Aid for Strategic Medical Science Research from the Ministry of Education, Culture, Sports, Science and Technology of Japan.
Indicates open access to non-subscribers at www.ajnr.org
References
- Received April 23, 2013.
- Accepted after revision July 27, 2013.
- © 2014 by American Journal of Neuroradiology


Jump to section
Related Articles
Cited By...
- Optimal MR Plaque Imaging for Cervical Carotid Artery Stenosis in Predicting the Development of Microembolic Signals during Exposure of Carotid Arteries in Endarterectomy: Comparison of 4 T1-Weighted Imaging Techniques
- Imaging the Intracranial Atherosclerotic Vessel Wall Using 7T MRI: Initial Comparison with Histopathology
- Carotid Plaque Characterization Using 3D T1-Weighted MR Imaging with Histopathologic Validation: A Comparison with 2D Technique