
Abstract
BACKGROUND AND PURPOSE: Diffusion tensor metrics are potential in vivo quantitative neuroimaging biomarkers for the characterization of brain tumor subtype. This meta-analysis analyzes the ability of mean diffusivity and fractional anisotropy to distinguish low-grade from high-grade gliomas in the identifiable tumor core and the region of peripheral edema.
MATERIALS AND METHODS: A meta-analysis of articles with mean diffusivity and fractional anisotropy data for World Health Organization low-grade (I, II) and high-grade (III, IV) gliomas, between 2000 and 2013, was performed. Pooled data were analyzed by using the odds ratio and mean difference. Receiver operating characteristic analysis was performed for patient-level data.
RESULTS: The minimum mean diffusivity of high-grade gliomas was decreased compared with low-grade gliomas. High-grade gliomas had decreased average mean diffusivity values compared with low-grade gliomas in the tumor core and increased average mean diffusivity values in the peripheral region. High-grade gliomas had increased FA values compared with low-grade gliomas in the tumor core, decreased values in the peripheral region, and a decreased fractional anisotropy difference between the tumor core and peripheral region.
CONCLUSIONS: The minimum mean diffusivity differs significantly with respect to the World Health Organization grade of gliomas. Statistically significant effects of tumor grade on average mean diffusivity and fractional anisotropy were observed, supporting the concept that high-grade tumors are more destructive and infiltrative than low-grade tumors. Considerable heterogeneity within the literature may be due to systematic factors in addition to underlying lesion heterogeneity.
ABBREVIATIONS:
- ΔFA
- fractional anisotropy difference
- FA
- fractional anisotropy
- MD
- mean diffusivity
- minMD
- minimum mean diffusivity or minimum ADC
- ROC
- receiver operator characteristic
- WHO
- World Health Organization
Diffusion tensor imaging is an MR imaging technique that can quantify diffusion of water in the brain and characterize the structural integrity of white matter tracts.1⇓–3 Multiple studies have examined the ability of basic diffusion tensor metrics such as mean diffusivity (MD) or the apparent diffusion coefficient and fractional anisotropy (FA) to discriminate the tumor grade of gliomas. Disruption of normal white matter structural integrity by primary glial neoplasms should theoretically reduce fractional anisotropy and increase mean diffusivity.
Mean diffusivity is positively correlated with decreased tumor cellular density and increased patient survival, and significant effects are reported in several studies with respect to discriminating tumor grade specifically by using minimum mean diffusivity (minMD).4⇓⇓⇓⇓–9 In contradistinction, there is no definitive consensus on the ability of fractional anisotropy to assess tumor grade, cellular density, and parenchymal infiltration or to prognosticate patient survival.7,10⇓⇓⇓⇓⇓⇓⇓⇓⇓⇓–21 We performed a quantitative meta-analysis of the existing literature to determine the statistical consensus of mean diffusivity and fractional anisotropy in distinguishing tumor grade of gliomas, separately examining the identifiable tumor core and region of peripheral signal abnormality.
Materials and Methods
Articles were identified via PubMed and Science Citation Index query using the terms “diffusion” and “brain tumor.” This search produced 1657 articles from PubMed and 2158 articles from the Science Citation Index. Citations were imported into the EndNote citation manager (Thomson Reuters, New York, New York), which was used to remove duplicates, yielding 3128 citations. Articles were then restricted to those with publication dates between 2000 and 2013 and containing the word “glioma,” which yielded 377 articles. An additional restriction to articles containing the phrase “fractional anisotropy” resulted in 242 articles. All studies (377 for mean diffusivity, 242 for fractional anisotropy) were read for relevance. Only studies that reported data for adult patients with histologic confirmation of treatment-naïve lesions were included. We could not control for sampling error associated with histologic sampling; with the exception of a few studies that performed stereotactic biopsies, it is possible that some lesions were inappropriately classified.22 Case reports were excluded.
FA and MD values were tabulated as mean values and SDs. The SDs and number of patients were used for weighting in the pooled analysis. Two articles displayed data in chart rather than numeric format; the chart images were analyzed by superimposing a finely decimated grid, which intersected the chart axis in the PowerPoint image manager (Microsoft, Redmond, Washington) to extract numeric values.
The World Health Organization (WHO) tumor grade and the range of histologic tumor types included were tabulated. Information on whether each study was prospective and/or retrospective, the number of patients, and the mean patient age, if provided, were recorded. The technical specifications for the diffusion acquisition, including main magnetic field strength, number of noncollinear gradient directions, number of b-values, and maximum b-value, were recorded. The MR imaging vendor and software used for analysis were noted.
We only included studies that separated diffusion metrics in the tumor core and tumor periphery, with the exception of 2 studies that reported the minimum mean diffusivity and included the entire region of signal abnormality.7,23 Studies that reported central necrotic regions for either tumor grade were excluded. Some studies separated tumor core values for enhancing and nonenhancing components, and these were recorded. Studies that reported values for the region of signal abnormality peripheral to the tumor core as either “edematous” or “infiltrated” were grouped into the peripheral region category; this was equated to the region of T2-prolongation on long-TR images, such as T2-weighted or FLAIR images. Critically, the peripheral region was distinguished from the “intermediary” or “boundary” region between the tumor core and the peripheral region, reported in some studies in the neighborhood of 1–2 mm from the tumor core. Also relevant for low-grade lesions, data from studies that only reported the white matter adjacent to the region of signal abnormality were not included.24,25 Summary statistics for the studies are provided in the Table.
Study characteristics and technical factorsa
Equations relating MD, equivalent to the apparent diffusion coefficient, and FA are provided below in terms of the 3 principal eigenvalues (λ1, λ2, λ3).26 However, 3 noncollinear diffusion gradient directions suffice to calculate the mean diffusivity, without calculation of the individual eigenvalues. Adjustments were made if studies reported the trace instead of MD (trace = 3 MD).

 Statistical analysis was performed with R, Version 3.0.1 (http://www.r-project.org).27 The metafor package (http://cran.r-project.org/web/packages/metafor/index.html) was used to implement a random-effects model, calculate I2 as a measure of heterogeneity, perform meta-regression, and generate forest plots.28 Standardized mean differences of mean diffusivity and fractional anisotropy between high-grade and low-grade gliomas were converted to odds ratios to simplify interpretation.29 The mean difference was used to calculate the difference in fractional anisotropy (ΔFA) between the tumor core and peripheral region. The funnel plot asymmetry regression test was used to evaluate study sample size bias.30 Approximate permutation tests for P values used 1000 iterations.31 The pROC package (http://cran.r-project.org/web/packages/pROC/index.html) was used to generate receiver operating characteristic (ROC) curves and calculate area under the curve via bootstrapping (10,000 replicates) for patient-level data.32 The binormal method was used for ROC curve smoothing. Confidence intervals were calculated at the 95% significance level.
Results
Minimum MD
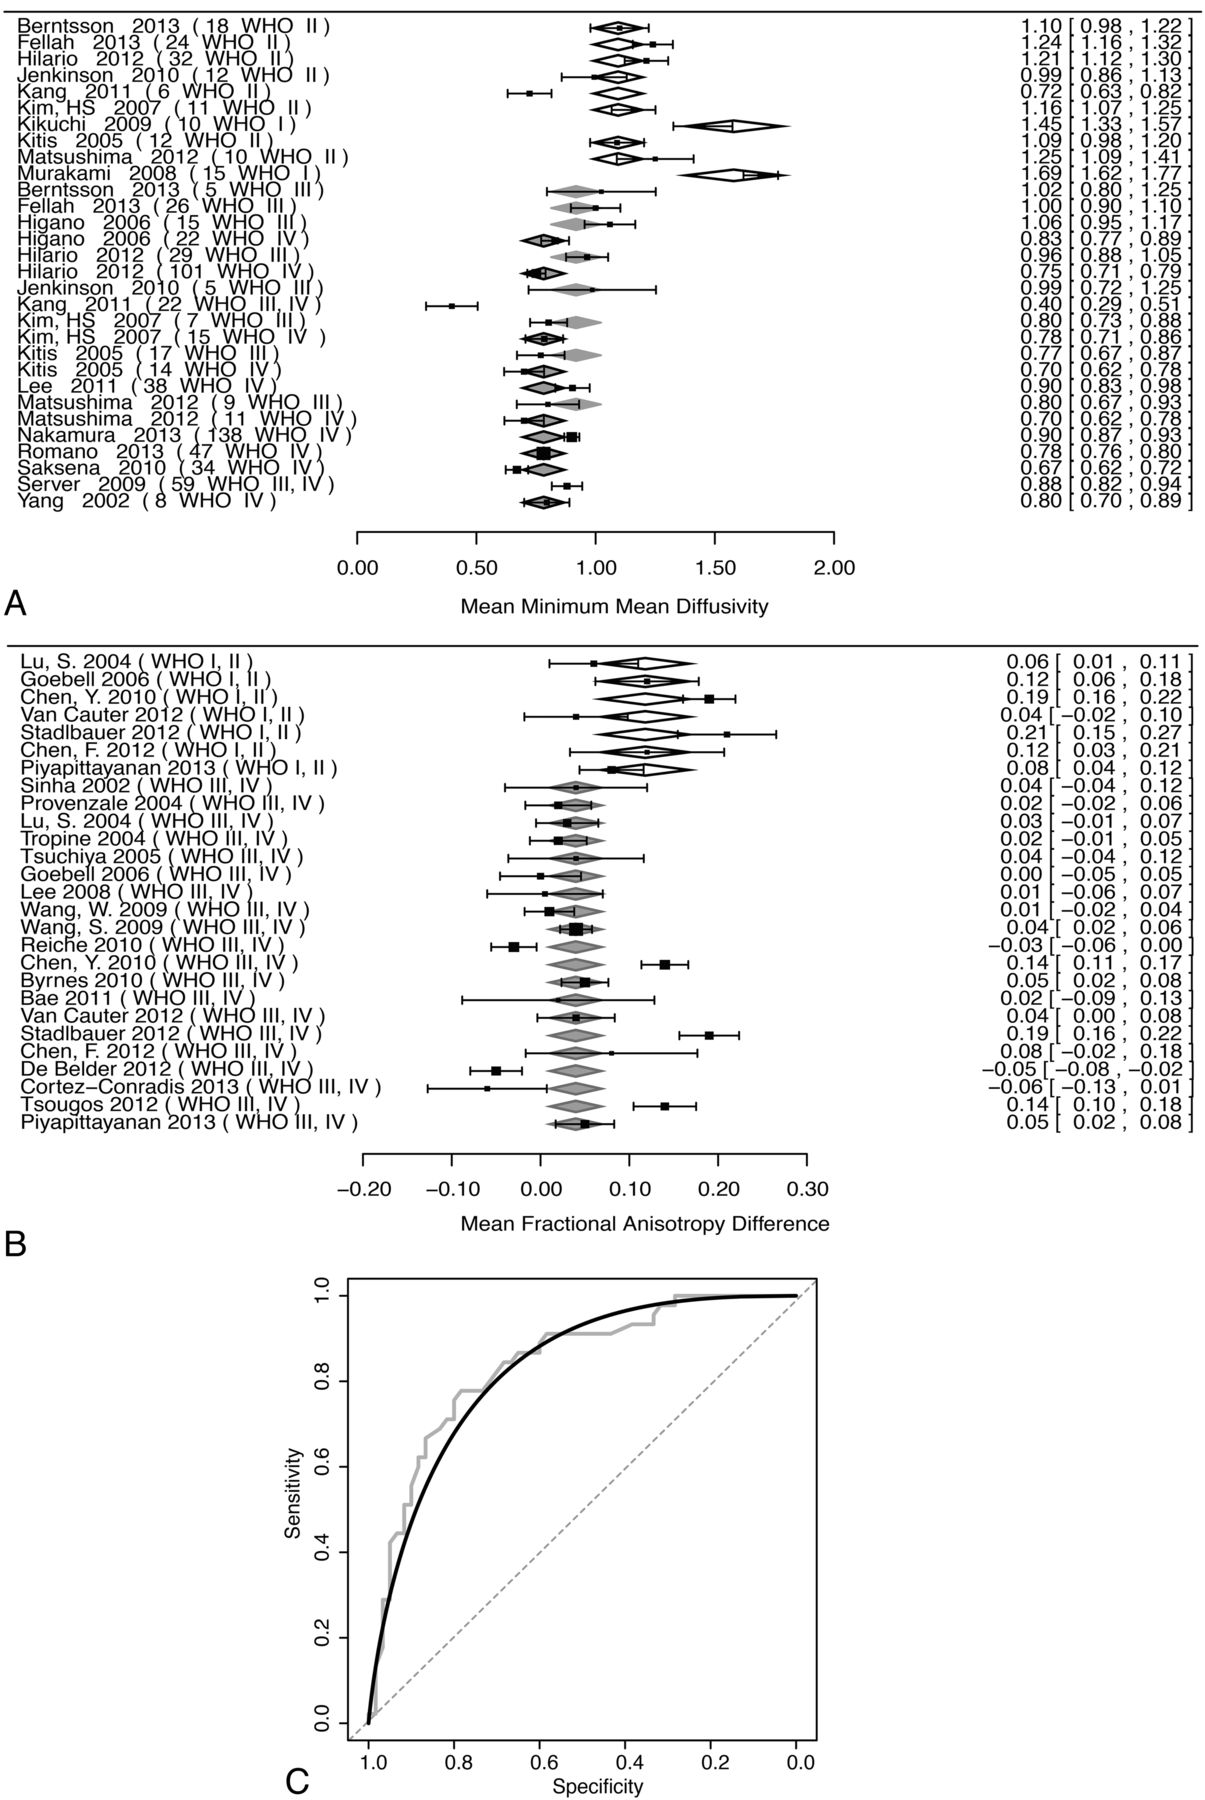
Pooled analysis of minimum mean diffusivity (minMD) with respect to tumor grade was performed in 17 unique studies (772 patients) (Fig 1A). There was a significant effect of tumor grade (WHO I and II, III and IV) on minMD, with the higher tumor grade resulting in decreased minMD values (P < .001). Funnel plot asymmetry was not significant (P = .96). Considerable heterogeneity was present (I2 = 93%). Meta-regression models showed no significant effects for patient age, year of publication, MR imaging vendor, and main magnetic field strength (P > .05). Dichotomizing into high-grade (WHO III and IV) and low-grade (WHO grade I and II) groups was significant (P < .001); the mean minMD of low-grade gliomas was 1.19 ± 0.06 mm2/s, and the difference between the low-grade and high-grade groups was 0.37 ± 0.07 mm2/s.

Effects of tumor grade on minimum mean diffusivity and Δ fractional anisotropy. Moderator analysis was performed (A and B) with respect to tumor grade. In forest plots (A and B), the left column indexes each study by lead author and publication year, with the WHO tumor grade of the lesions in parentheses. WHO grade category means are shown by diamonds, with relative width corresponding to the standard error. The right column provides numeric mean values, with confidence intervals in brackets for each study. Pooled random-effects values are provided at the bottom of each plot. A, The forest plot of minMD and effect of WHO tumor grade are shown. Open diamonds indicate WHO II; light-gray diamonds with gray borders, WHO III; dark gray diamonds with black borders, WHO IV. B, The forest plot of ΔFA is shown. Open diamonds indicate WHO I, II; light gray diamonds with gray borders, WHO III, IV. C, An ROC plot of patient-level data for minMD is shown. Gray step curve indicates actual data; black curve, binormal smoothed curve; dashed gray line, 50:50 line.
Patient-level data were available in 5 studies (105 patients) (Fig 1C). ROC analysis resulted in an area under the curve of 0.84 (95% CI, 0.76–0.91). The optimal threshold to distinguish low-grade and high-grade gliomas was minMD = 0.98 mm2/s, identified via the Youden Index. This threshold resulted in a specificity of 78.3% (95% CI, 66.7%–88.3%) and a sensitivity of 77.8% (95% CI, 64.4%–88.9%).
Average MD
Pooled analysis of average values of MD was also performed for determination of tumor grade in the tumor core (26 studies, 996 patients) and the peripheral region of signal abnormality (10 studies, 207 patients) (Fig 2A, -B). The analysis was restricted to studies that provided data for both low-grade and high-grade gliomas, to provide internal controls. The odds ratio for high-grade versus low-grade lesions was 0.3 (95% CI, 0.14–0.63; permutation P value < .001) in the tumor core and 4.32 (95% CI, 1.25–15.0; permutation P value =.044) in the peripheral region; raw mean differences between high-grade and low-grade were, however, small (−0.16 and 0.14, respectively). Considerable significant heterogeneity was present for the tumor core, I2 = 87.2% (95% CI, 80.3%–94.9%), less significantly in the peripheral region, I2 = 76.8% (95% CI, 48.3%–94.6%).

Forest plots of mean diffusivity and fractional anisotropy in the tumor core and peripheral region of signal abnormality, comparing differences between low-grade and high-grade categories (moderator analysis was not performed). The standardized mean difference between high-grade and low-grade lesions was converted to odds ratios as a measure of effect size. Mean diffusivity in the tumor core (A) and peripheral region (B) with fractional anisotropy in the tumor core (C) and peripheral region (D) are shown. For each forest plot, the left column indexes each study by lead author and publication year. The right column provides odds ratios, with confidence intervals in brackets for each study. Pooled random-effect odds ratios are provided at the bottom of each plot.
ΔFA
Pooled analysis of the difference in fractional anisotropy (ΔFA) between the peripheral region of signal abnormality and the tumor core was performed in 20 unique studies (391 patients) (Fig 1B). High-grade gliomas had a significantly decreased ΔFA compared with low-grade gliomas (P =.007). The raw difference estimate between the 2 groups was 0.08 ± 0.03 (estimated ΔFA of low-grade gliomas = 0.12 ± 0.03). The permutation P value remained significant (P = .02), and the funnel plot asymmetry was not significant (P = .6). Considerable heterogeneity was present, I2 = 91% (95% CI, 84.3%–95.1%). A meta-regression model incorporating MR imaging vendor type (GE Healthcare, Siemens, Philips Healthcare, Toshiba) was not significant (P =.078); models incorporating patient age, year of publication, number of noncollinear DTI directions, and main magnetic field strength were also not significant.
Average FA
Pooled analysis of average values of FA was performed for determination of tumor grade in the tumor core (21 studies, 734 patients) and the peripheral region of signal abnormality (7 studies, 180 patients) (Fig 2C, -D). The analysis was restricted to studies that provided data for both low-grade and high-grade gliomas, to provide internal controls. The odds ratio for high-grade versus low-grade lesions was 2.24 (95% CI, 1.23–4.08, permutation P value = .006) in the tumor core and 0.45 (95% CI, 0.26–0.81, permutation P value = .032) in the peripheral region; raw mean differences between high-grade and low-grade were, however, small (0.02 and −0.02, respectively). Modest heterogeneity was present for the tumor core, I2 = 74.9% (95% CI, 56.2%–88.2%), without significant heterogeneity in the peripheral region, I2 = 0% (95% CI, 0%–82.8%).
Discussion
We performed a meta-analysis to explore the validity and consensus in the utility of mean diffusivity and fractional anisotropy for distinguishing tumor grade in gliomas. Pooled analysis was restricted to studies that internally compared low-grade and high-grade lesions, thus providing internal controls. Significant effects were observed, adding support to generalizations regarding tumor biology, though the raw effect sizes were small and significant heterogeneity was present in some of the cohorts of studies. In the identifiable tumor core, high-grade gliomas had decreased MD and increased FA values compared with low-grade gliomas. In the peripheral region of signal abnormality, high-grade gliomas had increased MD and decreased FA values. These observations suggest that high-grade gliomas have a more destructive effect on white matter tracts than low-grade gliomas in the peripheral region. In the tumor core, high-grade gliomas are expected to have increased extracellular-space volume and increased microvascular proliferation and are not expected to preserve white mater architecture, to account for the relatively greater fractional anisotropy.33,34 Theoretically, this effect may be a consequence of initial growth along the scaffold of white matter tracts. Alternatively, high-grade gliomas may have a less defined transition between the tumor core and periphery than is suggested by structural imaging.
We further analyzed the FA difference between the tumor core and peripheral region to provide additional insight into tumor biology. High-grade gliomas have a ΔFA that is approximately 0.08 ± 0.03 smaller than that in low-grade gliomas. The result may suggest that high-grade gliomas are more infiltrative than low-grade gliomas, as expected from mathematic modeling.35 The results parallel those of Ferda et al,15 who observed that grade II gliomas have a sharper transition than grade III gliomas among the tumor core, intermediary region, and the peripheral region. We note, however, that their results also showed a sharp transition, presumably due to mass effect in grade IV gliomas, an observation that was not adequately testable in our meta-analysis.
The minMD was observed to be a significant diffusion imaging metric for distinguishing tumor grade in gliomas. While the minimum mean diffusivity is inherently subject to statistical noise and partial volume effects, it does not necessarily rely on precise lesion segmentation, thus eliminating a source of heterogeneity between studies. The ROC analysis of patient-level data suggested an optimal cutoff in minMD of 0.98 mm2/s; minMD lower than this value favors a high-grade glioma. This suggested cutoff is within the range of previously published values.4⇓–6 However, the lower bounds of the 95% CI for both sensitivity and specificity from our ROC analysis are approximately 65%, which limits clinical confidence in using this metric alone.
Several limitations of our study are inherent in its methods. First, more significant differences may not have been observed simply because mean diffusivity and fractional anisotropy are insufficient to discriminate tumor grade. Unfortunately, promising metrics such as diffusional kurtosis, p:q diffusion tensor decomposition, and maximum SD of FA were provided in too few studies to be accessible by meta-analysis.19,36,37
Considerable heterogeneity was observed in the cohort of studies for some of the metrics we tested. One source of heterogeneity was sampling error in pathologic specimens used for histologic grading. This error is expected to increase heterogeneity in the dataset because high-grade lesions may be mistakenly classified as low-grade lesions; unfortunately because most studies did not perform multiple biopsies, it is not possible to control for this source of heterogeneity. Variations in measurement precision are unavoidable, though in individual patients, measurements of the fractional anisotropy and mean diffusivity showed good reproducibility in at least 1 study.38 However, measurement accuracy is difficult to account for among all studies. Nevertheless, technical factors such as the main magnetic field strength, MR imaging vendor, number of noncollinear diffusion gradient directions (in the case of FA), and number of b-values used were not found to significantly account for the heterogeneity among studies.
Nonquantitative aspects specifically related to segmentation of brain tumor components on imaging could not be adequately accounted for in our study. Discrimination of tumor components primarily relies on the expert opinion of neuroradiologists. Specific challenges arise for lesions lacking well-defined tumor core and peripheral region boundaries. Increased interest in semiautomated computer segmentation in the analysis of brain tumors, coupled with validation, may circumvent some subjectivity in delineating the image-definable components of glial tumors.39 Standardization of segmentation techniques is expected to improve the utility of quantitative measurements.
Furthermore, in most studies, a range of values was observed among patients. Sources of this variation include different tumor locations and underlying patient-specific background tissue differences. However, there is likely additional heterogeneity within the low-grade and high-grade glioma groups. Within glioblastoma, 4 separate subtypes can be distinguished by molecular profiling, and these subtypes differ in the degree of infiltration.40⇓–42 For example, O6-methylguanine DNA methyltransferase promoter methylation has a significant effect on diffusion tensor metrics.43,44 WHO grade and single histologic designations are likely inadequate as sole descriptors of the biologic behavior of tumors.
Conclusions
Minimum mean diffusivity is an easily calculated diffusion tensor metric that differs significantly with respect to WHO tumor grade, though specific clinical recommendations cannot be made on the basis of this analysis. In the tumor core, high-grade gliomas have decreased MD and increased FA, while in the peripheral region high-grade gliomas have increased MD and decreased FA. However, considerable heterogeneity exists in the published literature, which is likely due to both systematic factors and the underlying biologic heterogeneity of gliomas. Standardization in terminology and segmentation of the regions of signal abnormality identifiable on imaging and standardization of DTI methodology are needed. However, to approach the underlying biologic heterogeneity of gliomas, future investigations may need to examine the correlation of diffusion tensor biomarkers with tumor genomic or expression profiles. Thus, diffusion tensor metrics can be tested as quantitative biomarkers for tumor subtype and can be potentially used to report subpopulations within a given tumor subtype.
Footnotes
Disclosures: Christopher G. Filippi—UNRELATED: Consultancy: Syntactx Corporation, Regeneration Pharmaceuticals, Comments: For both of these consultant jobs, I help them organize MR imaging protocols for clinical drug trials, and I interpret MR images; Grants/Grants Pending: Coinvestigator on National Institutes of Health/National Cancer Institute (1R01CA161404-01A) and National Institutes of Health/National Heart, Lung, and Blood Institute (2R01HL071944-06).
Paper previously presented at: Mini-Symposiums on Tumor and Stroke at the Annual Meeting of the American Society of Neuroradiology and the Foundation of the ASNR Symposium, May 17–22, 2014; Montreal, Quebec, Canada.
REFERENCES
- Received May 8, 2014.
- Accepted after revision July 17, 2014.
- © 2015 by American Journal of Neuroradiology


