
Abstract
BACKGROUND AND PURPOSE: Quantitative susceptibility mapping of the human brain has demonstrated strong potential in examining iron deposition, which may help in investigating possible brain pathology. This study assesses the reproducibility of quantitative susceptibility mapping across different imaging sites.
MATERIALS AND METHODS: In this study, the susceptibility values of 5 regions of interest in the human brain were measured on 9 healthy subjects following calibration by using phantom experiments. Each of the subjects was imaged 5 times on 1 scanner with the same procedure repeated on 3 different 3T systems so that both within-site and cross-site quantitative susceptibility mapping precision levels could be assessed. Two quantitative susceptibility mapping algorithms, similar in principle, one by using iterative regularization (iterative quantitative susceptibility mapping) and the other with analytic optimal solutions (deterministic quantitative susceptibility mapping), were implemented, and their performances were compared.
RESULTS: Results show that while deterministic quantitative susceptibility mapping had nearly 700 times faster computation speed, residual streaking artifacts seem to be more prominent compared with iterative quantitative susceptibility mapping. With quantitative susceptibility mapping, the putamen, globus pallidus, and caudate nucleus showed smaller imprecision on the order of 0.005 ppm, whereas the red nucleus and substantia nigra, closer to the skull base, had a somewhat larger imprecision of approximately 0.01 ppm. Cross-site errors were not significantly larger than within-site errors. Possible sources of estimation errors are discussed.
CONCLUSIONS: The reproducibility of quantitative susceptibility mapping in the human brain in vivo is regionally dependent, and the precision levels achieved with quantitative susceptibility mapping should allow longitudinal and multisite studies such as aging-related changes in brain tissue magnetic susceptibility.
ABBREVIATIONS:
- projection onto dipole fields
- QSM
- quantitative susceptibility mapping
- SHARP
- sophisticated harmonic artifact reduction for phase data
Quantitative susceptibility mapping (QSM) of the human brain has recently drawn increasing research interest because of its strong potential in neurologic applications.1⇓⇓⇓⇓⇓⇓⇓⇓⇓⇓–12 The magnetic susceptibility reflects the amount of induced magnetization in a certain tissue when placed in an external magnetic field such as that of an MR imaging scanner.11 As a result, measurements of magnetic susceptibility allow an examination of the difference in tissue ion content in the generally diamagnetic brain parenchyma. Previous reports by using QSM in the brain have demonstrated its capability to quantify cerebral iron deposition and, therefore, to assess brain pathology, including Parkinson disease and multiple sclerosis.2,13,14
The procedures to reconstruct the susceptibility maps comprise multiple data-processing steps, each of which could contribute to variations in the numeric results. For instance, the effectiveness of background gradient removal may be variable on different shimming conditions before image acquisition, and the convergence condition in the iterative regularization may be prone to parameter-selection bias. Consequently, it would be useful to assess the reproducibility and consistency of QSM results on a cross-site and within-subject basis so that the QSM approaches could be extended for longitudinal investigations of brain diseases with an increased patient pool.
In this study, we aimed to investigate the reproducibility of QSM within healthy adult subjects and the consistency of QSM among multiple sites in different brain regions. The results would provide implications regarding the precision levels of QSM before being widely applied in clinical brain studies. We compared results from both the iterative and deterministic methods, showing opportunities for higher computation efficiency by using fewer freely adjustable parameters, along with its possible limits. In all, this study is expected to increase the practicality of QSM for clinical neurologic applications, especially those in multisite and longitudinal studies.
Materials and methods
Phantom Experiment Validation
A cylindric phantom (diameter = 20 cm, height = 16 cm) containing water was made with 6 test tubes (diameter = 1.8 cm, height = 20 cm) inserted into the container. Gadolinium, gadopentetate dimeglumine solution (Magnevist; Bayer HealthCare, Wayne, New Jersey), was prepared at 0%, 0.25%, 0.5%, 0.75, 1%, and 1.25% of the raw solution. The test tubes were placed parallel to the main magnetic field in the cylindric container and were filled with gadolinium solution, generating susceptibility changes of 0, 0.41, 0.82, 1.22, 1.63, and 2.04 ppm, respectively.15
Phantom scans were performed on the 3T MR imaging scanners used for human subject experiments (to be detailed in the next section). Data were acquired by using multichannel head coils identical to those used in human experiments, with a 3D multiecho gradient-echo sequence (axial slices: matrix size = 224 × 216 × 92; voxel = 1 × 1 × 2 mm3; flip angle = 30°; TR = 30 ms; unipolar readout gradient, TE = 2.6, 6.6, 10.6, 14.6, 18.6, and 22.6 ms).
Human Subject Experiments
Nine healthy subjects (7 men, 2 women; age range, 23–37 years; mean, 28 ± 5 years) participated in the MR imaging brain scans of this study. Each subject underwent 15 QSM scans, with 5 scans in each of the three 3T scanners tested in this study. The 5 scans in each scanner were acquired in the same scan session for all subjects. For each subject, the time span to complete the scans at 3 sites ranged from 3 to 68 days. Subject scans were performed following an institutional review board protocol. One hundred thirty-five datasets were collected and analyzed.
Three 3T MR imaging scanners (site A and site B: Magnetom Skyra; Siemens, Erlangen, Germany; Site C: Discovery MR750; GE Healthcare, Milwaukee, Wisconsin) at 3 sites separated from one another by 40–350 km were used in this multisite study. Multiecho gradient-echo images (axial slices: matrix size = 256 × 256 × 64; FOV = 256 mm; slice thickness = 2 mm; TR/TE1 = 45/6 ms; echo spacing = 6 ms; 6 echoes with unipolar readout; flip angle = 5°; bandwidth = 31.25 KHz; 16-channel head coil at sites A and B; 8-channel head coil at site C) were acquired for QSM reconstruction. The scanning time for each single scan was approximately 12 minutes. Typical values of the signal-to-noise ratio for the first TE images were approximately 185, 165, and 260 for sites A, B, and C, respectively.
All datasets were first preprocessed and then went through the QSM computation algorithms. Susceptibility maps from iterative QSM and deterministic QSM were compared both in phantom and in human subject data. For region-of-interest analysis, 15 sets of susceptibility maps from each subject were registered in SPM8 software (http://www.fil.ion.ucl.ac.uk/spm/software/spm8). Five ROIs, including the caudate nucleus, putamen, globus pallidus, red nucleus, and substantia nigra, were then manually selected in all subjects to calculate the mean susceptibility values in each region of interest. Within-subject variability of the susceptibility values was then calculated with data from both a single site and 3 sites. As a result, 3 within-site variability values (each corresponding to the SD in a particular site) and 5 cross-site variability values (each corresponding to the SD from 1 of the 5 scans in 3 scanners) were obtained for each subject. Within-site and cross-site imprecision levels were calculated by averaging 3 within-site and 5 cross-site variability values, separately. Subsequently, within-site and cross-site imprecision levels were tested for significance of the difference in 5 ROIs by using paired Student t tests with a Bonferroni correction (P = .05/5 = .01).
In addition, susceptibility values in the 5 ROIs, with reference to those of the CSF in the lateral ventricles, were plotted versus ages of the recruited subjects. To examine whether the precision level of QSM allows an investigation of possible correlation of susceptibility values with age, we performed linear regression with average susceptibility values obtained from iterative QSM versus subject ages in each region of interest. One hundred thirty-five datasets were included.
Data-Preprocessing Procedures
Multiecho gradient-echo images were used for calculating quantitative susceptibility maps. In the data-preprocessing stage, 3D phase unwrapping was first applied for images obtained at each TE.16 Subsequently, magnetic field distribution was estimated by weighted least-squares fitting of the phase values versus the TE on a voxel-by-voxel basis.17 The background magnetic field was removed from the total magnetic field by using the projection onto dipole fields (PDF) method.18
Quantitative Susceptibility Mapping
In susceptibility mapping, a magnetic dipole model was used to model the magnetic field Blocal contributed from all tiny magnetic substances with susceptibility distribution of χlocal in a 3D space.2,15,19⇓⇓–22 An inverse problem was solved from the magnetic field Blocal by using a regularized equation to obtain the tissue susceptibility distribution χlocal. Two QSM methods, iterative and deterministic, by using similar regularized equations, were compared in this study.1,23
Iterative QSM
Regularization was applied so that the optimal solution converged under the constraint of consistency with the magnitude image as in the following equation1:
 where F is the Fourier transform operator, D is the matrix expression of the dipole model, Blocal denotes the local magnetic field obtained from the PDF method, λ is the associated regularization parameter; G represents a gradient operator; and We is a binary mask containing nonedge regions of the magnitude images, respectively. The minimization problem was solved by using the conjugate gradient method.
In equation 1, the first term ‖(FHDFχlocal − Blocal)‖22 was used to ensure the fidelity between the magnetic field generated from χlocal and the local magnetic field Blocal. To reduce streaking artifacts in χlocal maps, we added λ2‖WeGχlocal‖22 as the regularization term, in which edges in susceptibility maps (Gχlocal) were suppressed when appearing at nonedge regions of the magnitude image (We).
To determine the optimal λ value from a given range, for each λ, we recorded the fitted error ‖(FHDFχlocal − Blocal)‖22. The optimal λ was chosen so that the fitted error reached the expected noise variance.24
Deterministic QSM
In addition to the iterative method, a deterministic QSM method has been proposed to calculate the susceptibility maps with improved computational efficiency.23 Similar to the iterative QSM, the deterministic QSM involves minimization of the following equation:
 where F is the Fourier transform operator, D is the matrix expression of the dipole model, Blocal denotes the local magnetic field obtained from the PDF method, λ is the associated regularization parameter, and G represents a gradient operator, respectively. The minimization equation in deterministic QSM is similar to that of iterative QSM except that the edge information from magnitude images (ie, We of equation 1) is not included. Through mathematic derivation, when equation 2 is minimized, an analytic solution for χlocal can be obtained as in the following23:
 where Ex, Ey, and Ez are alternative forms of the gradient operator G in equation 2, expressed in 3 directions. Equation 3 shows that the optimal solution of χlocal can be calculated by using Fourier transform and matrix multiplication, which greatly reduce computation time compared with the iterative approach. The optimal λ was determined in a manner identical to that used in iterative QSM as stated above.
Minimization problems in iterative and deterministic QSM were solved by using Matlab (MathWorks, Natick, Massachusetts) R2012a (central processing unit: Intel i7–3930K; RAM 64GB; Microsoft Windows 7). The computation time for calculating susceptibility maps was recorded to compare the 2 QSM methods.
Results
Phantom Experiment
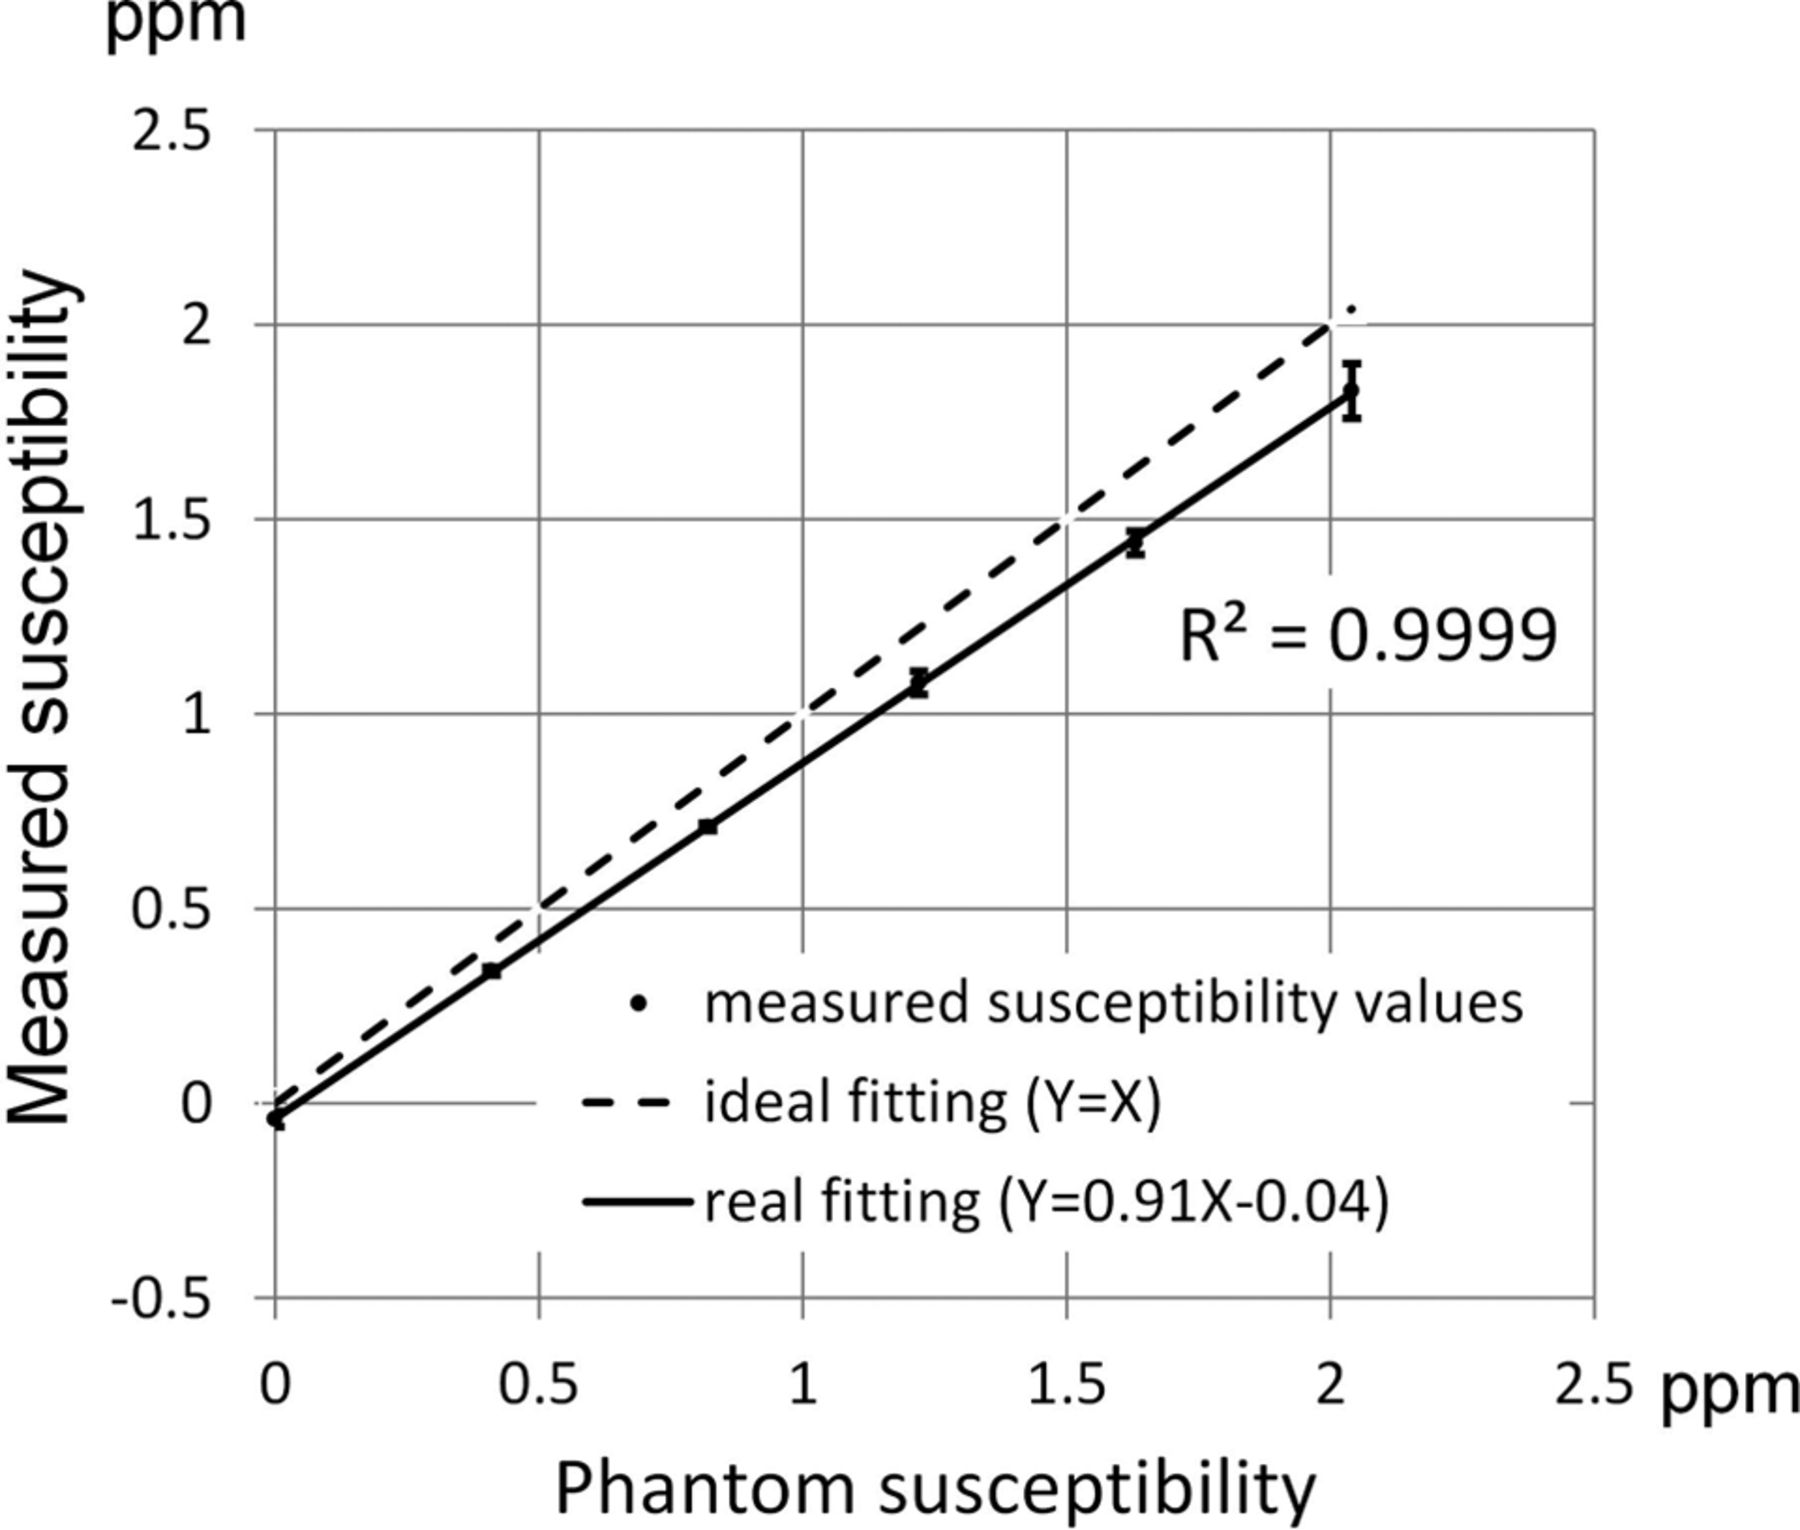
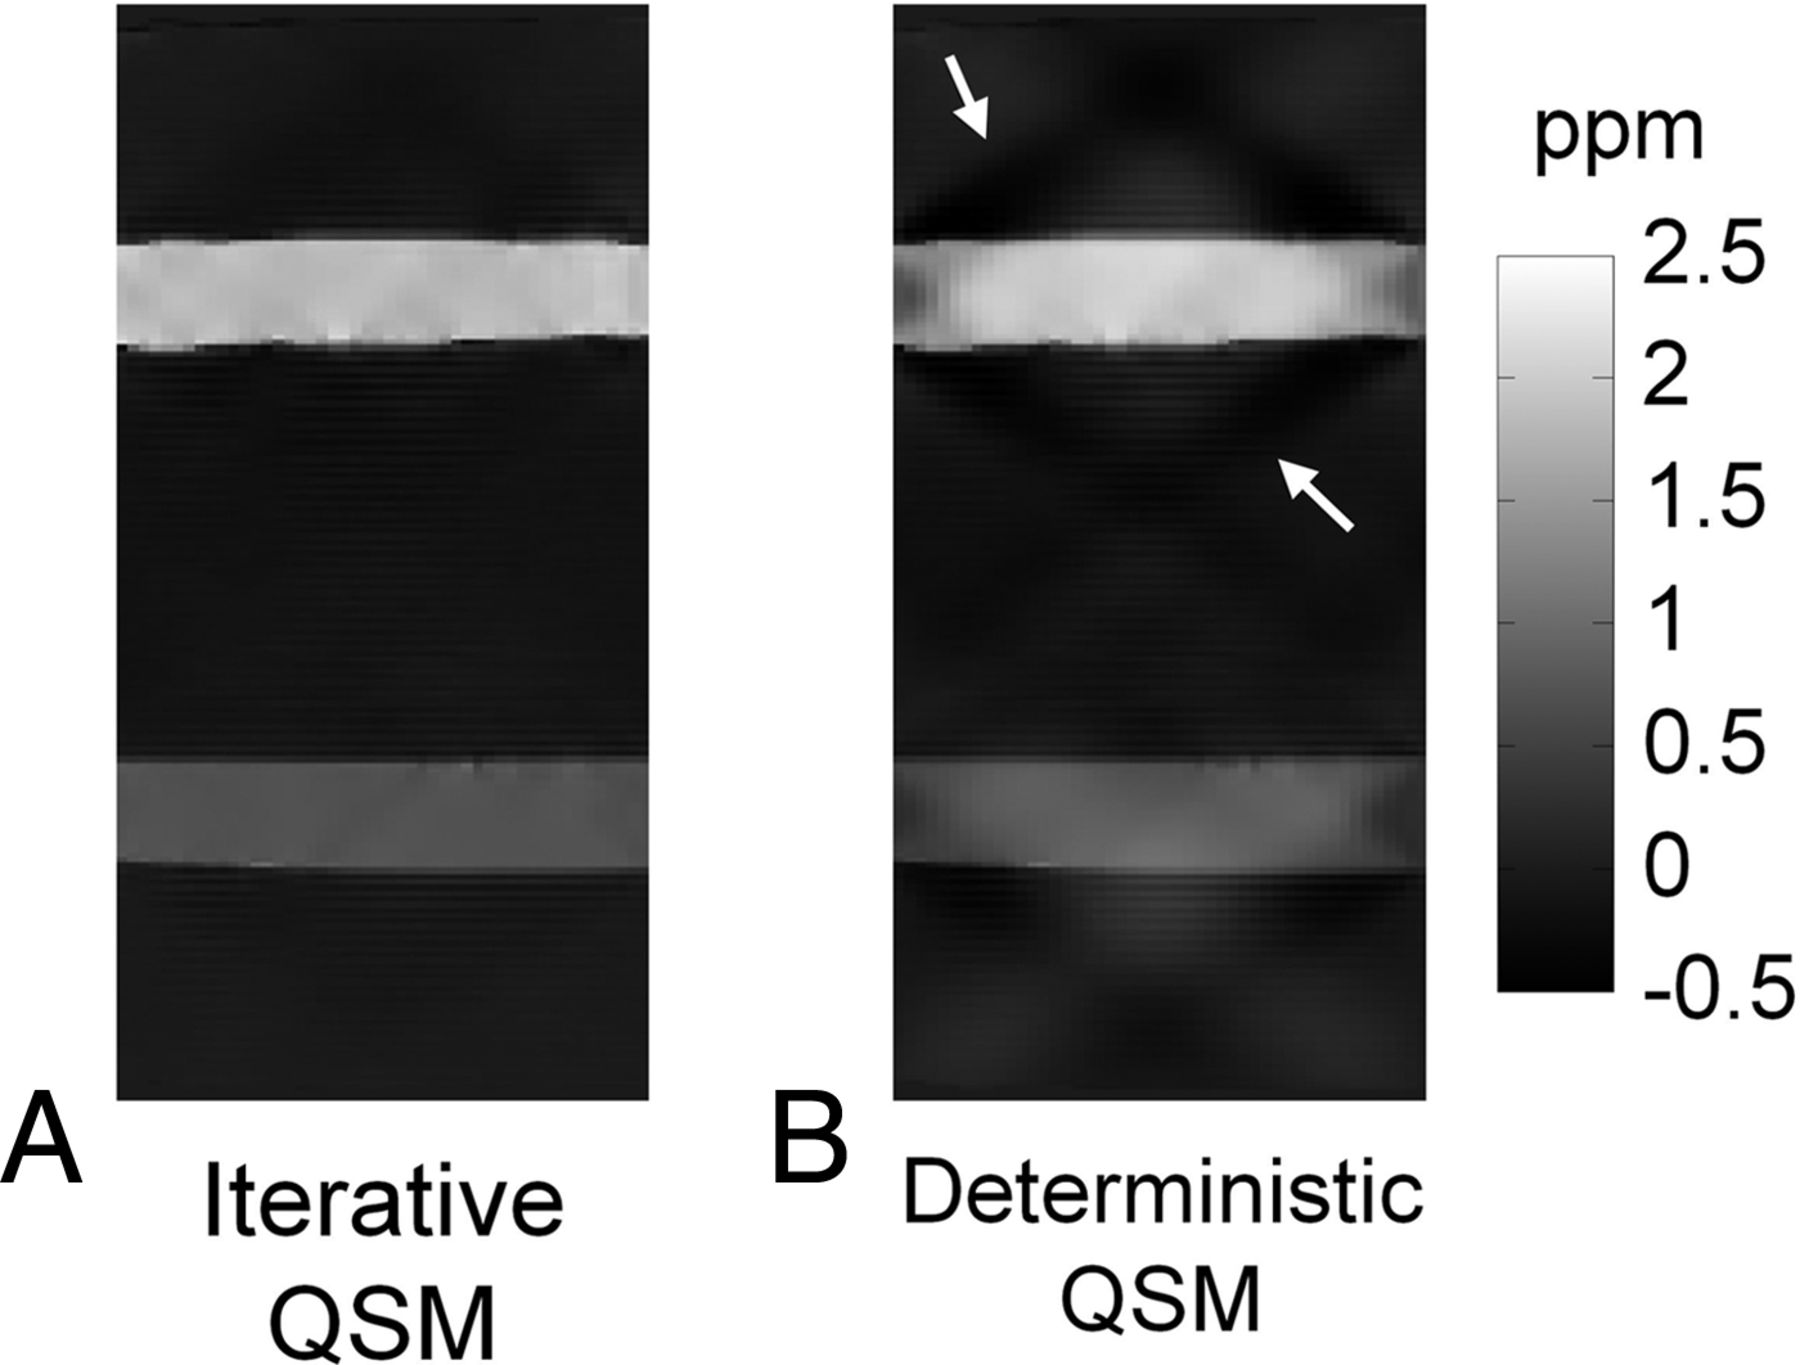
Results from the phantom scan comparing the experimental susceptibility values in the 6 tubes against the ideal susceptibility values predicted from the concentrations of the gadolinium solutions15 are shown in Fig 1. Good linearity exists between the measured susceptibility and the true values (R2 = 0.999). The fitted line between the 2 susceptibility values has a slope of 0.91 and an intercept of −0.04 ppm, respectively. Due to excellent linearity, the regression equation is used as calibration to adjust the susceptibility values obtained in subsequent in vivo studies. Figure 2 shows the susceptibility maps in a view plane covering the long axes of 2 tubes to compare the results from both the iterative (Fig 2A) and the deterministic (Fig 2B) QSM. The susceptibility map from deterministic QSM presents a visually higher level of streaking artifacts, as indicated by white arrows in Fig B, than that from the iterative QSM in Fig 2A. Further adjustments of the λ value in deterministic QSM show that the reconstructed susceptibility map exhibits either streaking at a small λ (under-regularized) or blurring at a large λ (over-regularized). At the λ value chosen in our study, the presence of both artifacts albeit at lower levels is visually discernible (not shown).

Measured susceptibility versus the phantom susceptibility values. Good linearity exists between measured susceptibility values and phantom susceptibility values in 6 test tubes of the phantom. The regression line has a slope of 0.91.

Comparison of iterative QSM and deterministic QSM in a sagittal view of the phantom. The susceptibility map from deterministic QSM presents a higher level of streaking artifacts as indicated by the white arrows.
Human Subject Experiments
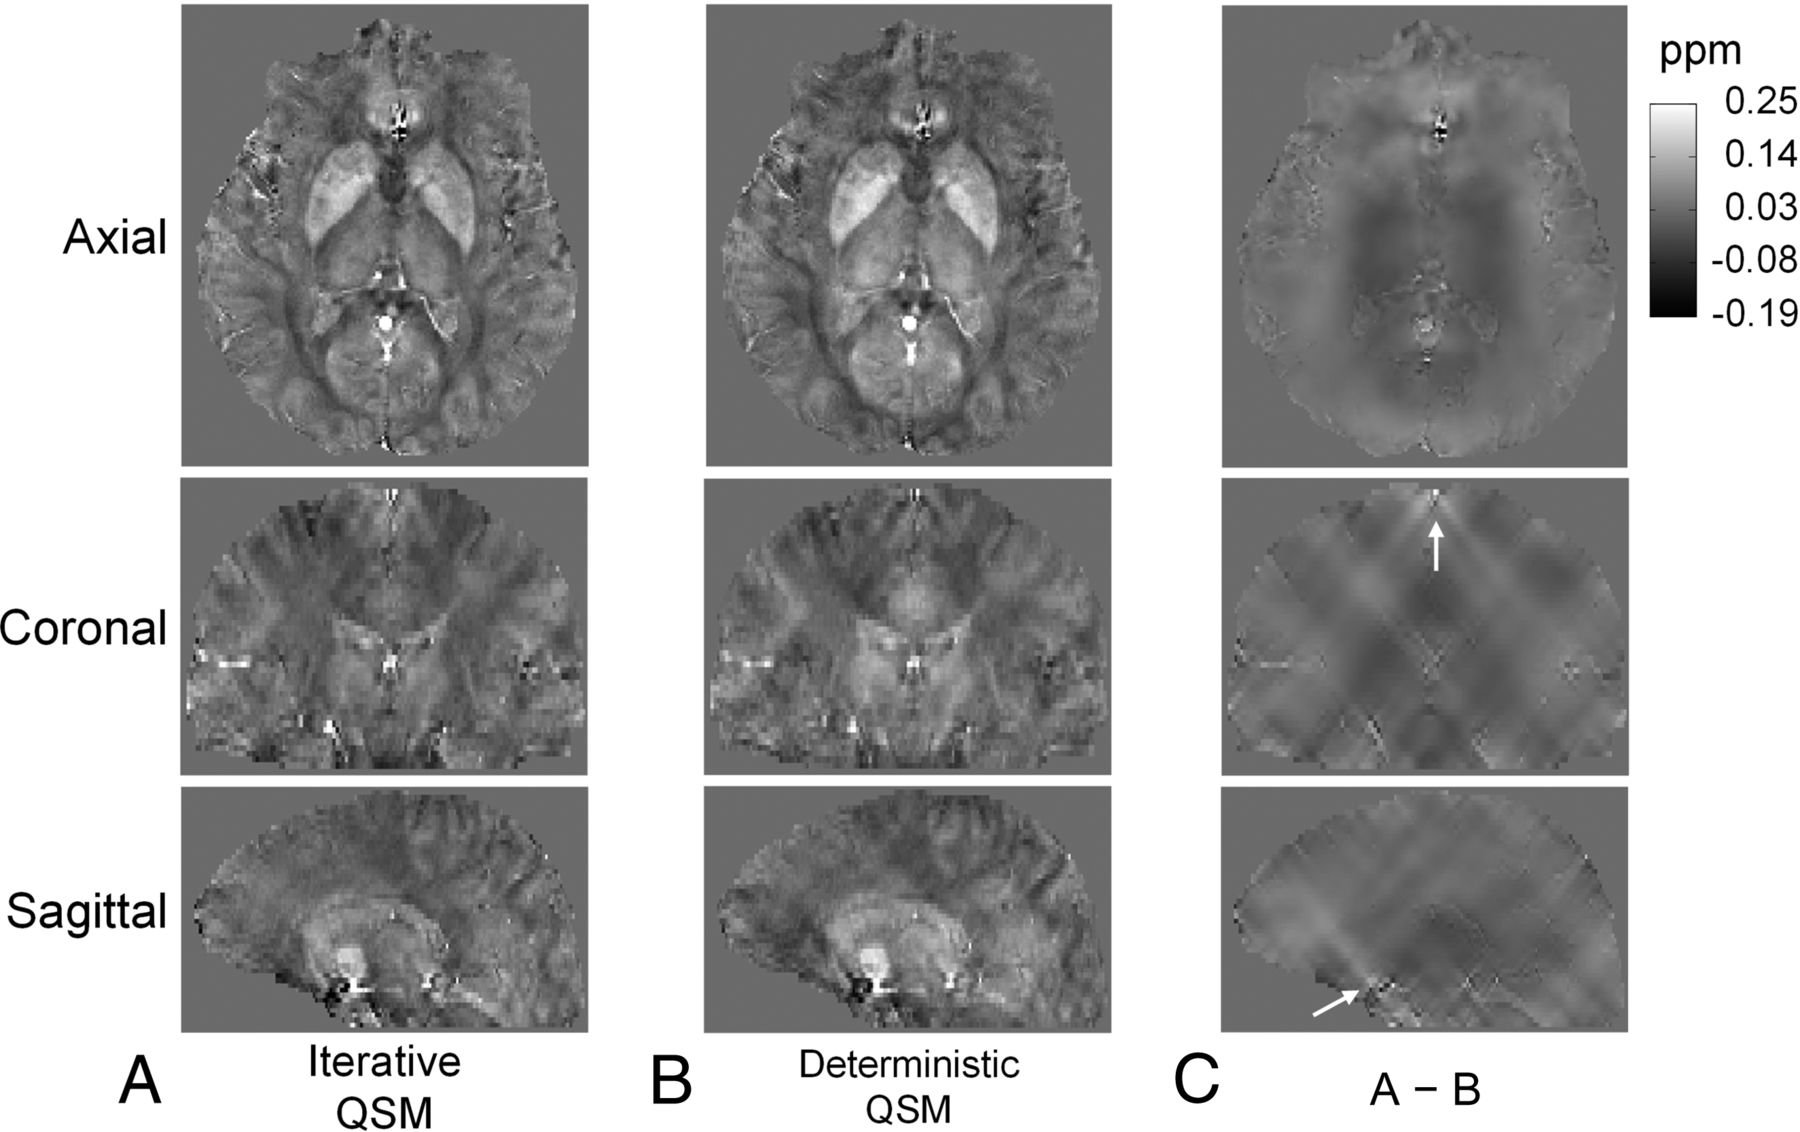
Susceptibility maps from a human subject reconstructed by iterative QSM and deterministic QSM are shown in Fig 3A, -B, respectively. In 3 displayed views, both image contrast and brain structures are very similar in the susceptibility maps of Fig 3A, -B, for which no visually prominent streaking artifacts are present. For examining the difference in susceptibility maps generated from the 2 QSM methods more closely, Fig 3C shows subtraction of Fig 3A, -B. Note that most of the streaking patterns are centered at locations with highly distinct susceptibility values from the vicinity, such as the superior sagittal sinus and regions close to the skull base, as indicated by white arrows. The average reconstruction durations for a dataset using iterative QSM and deterministic QSM are 123 seconds and 0.17 seconds, respectively.

Susceptibility maps reconstructed by iterative QSM (A) and deterministic QSM (B) in 3 different views. Susceptibility maps from both methods are very similar in contrast and brain structures. C, The difference images of A and B. Note that most streaking patterns in C are centered at locations with high susceptibility values, such as the sagittal sinus and regions close to the skull base, as indicated by white arrows.
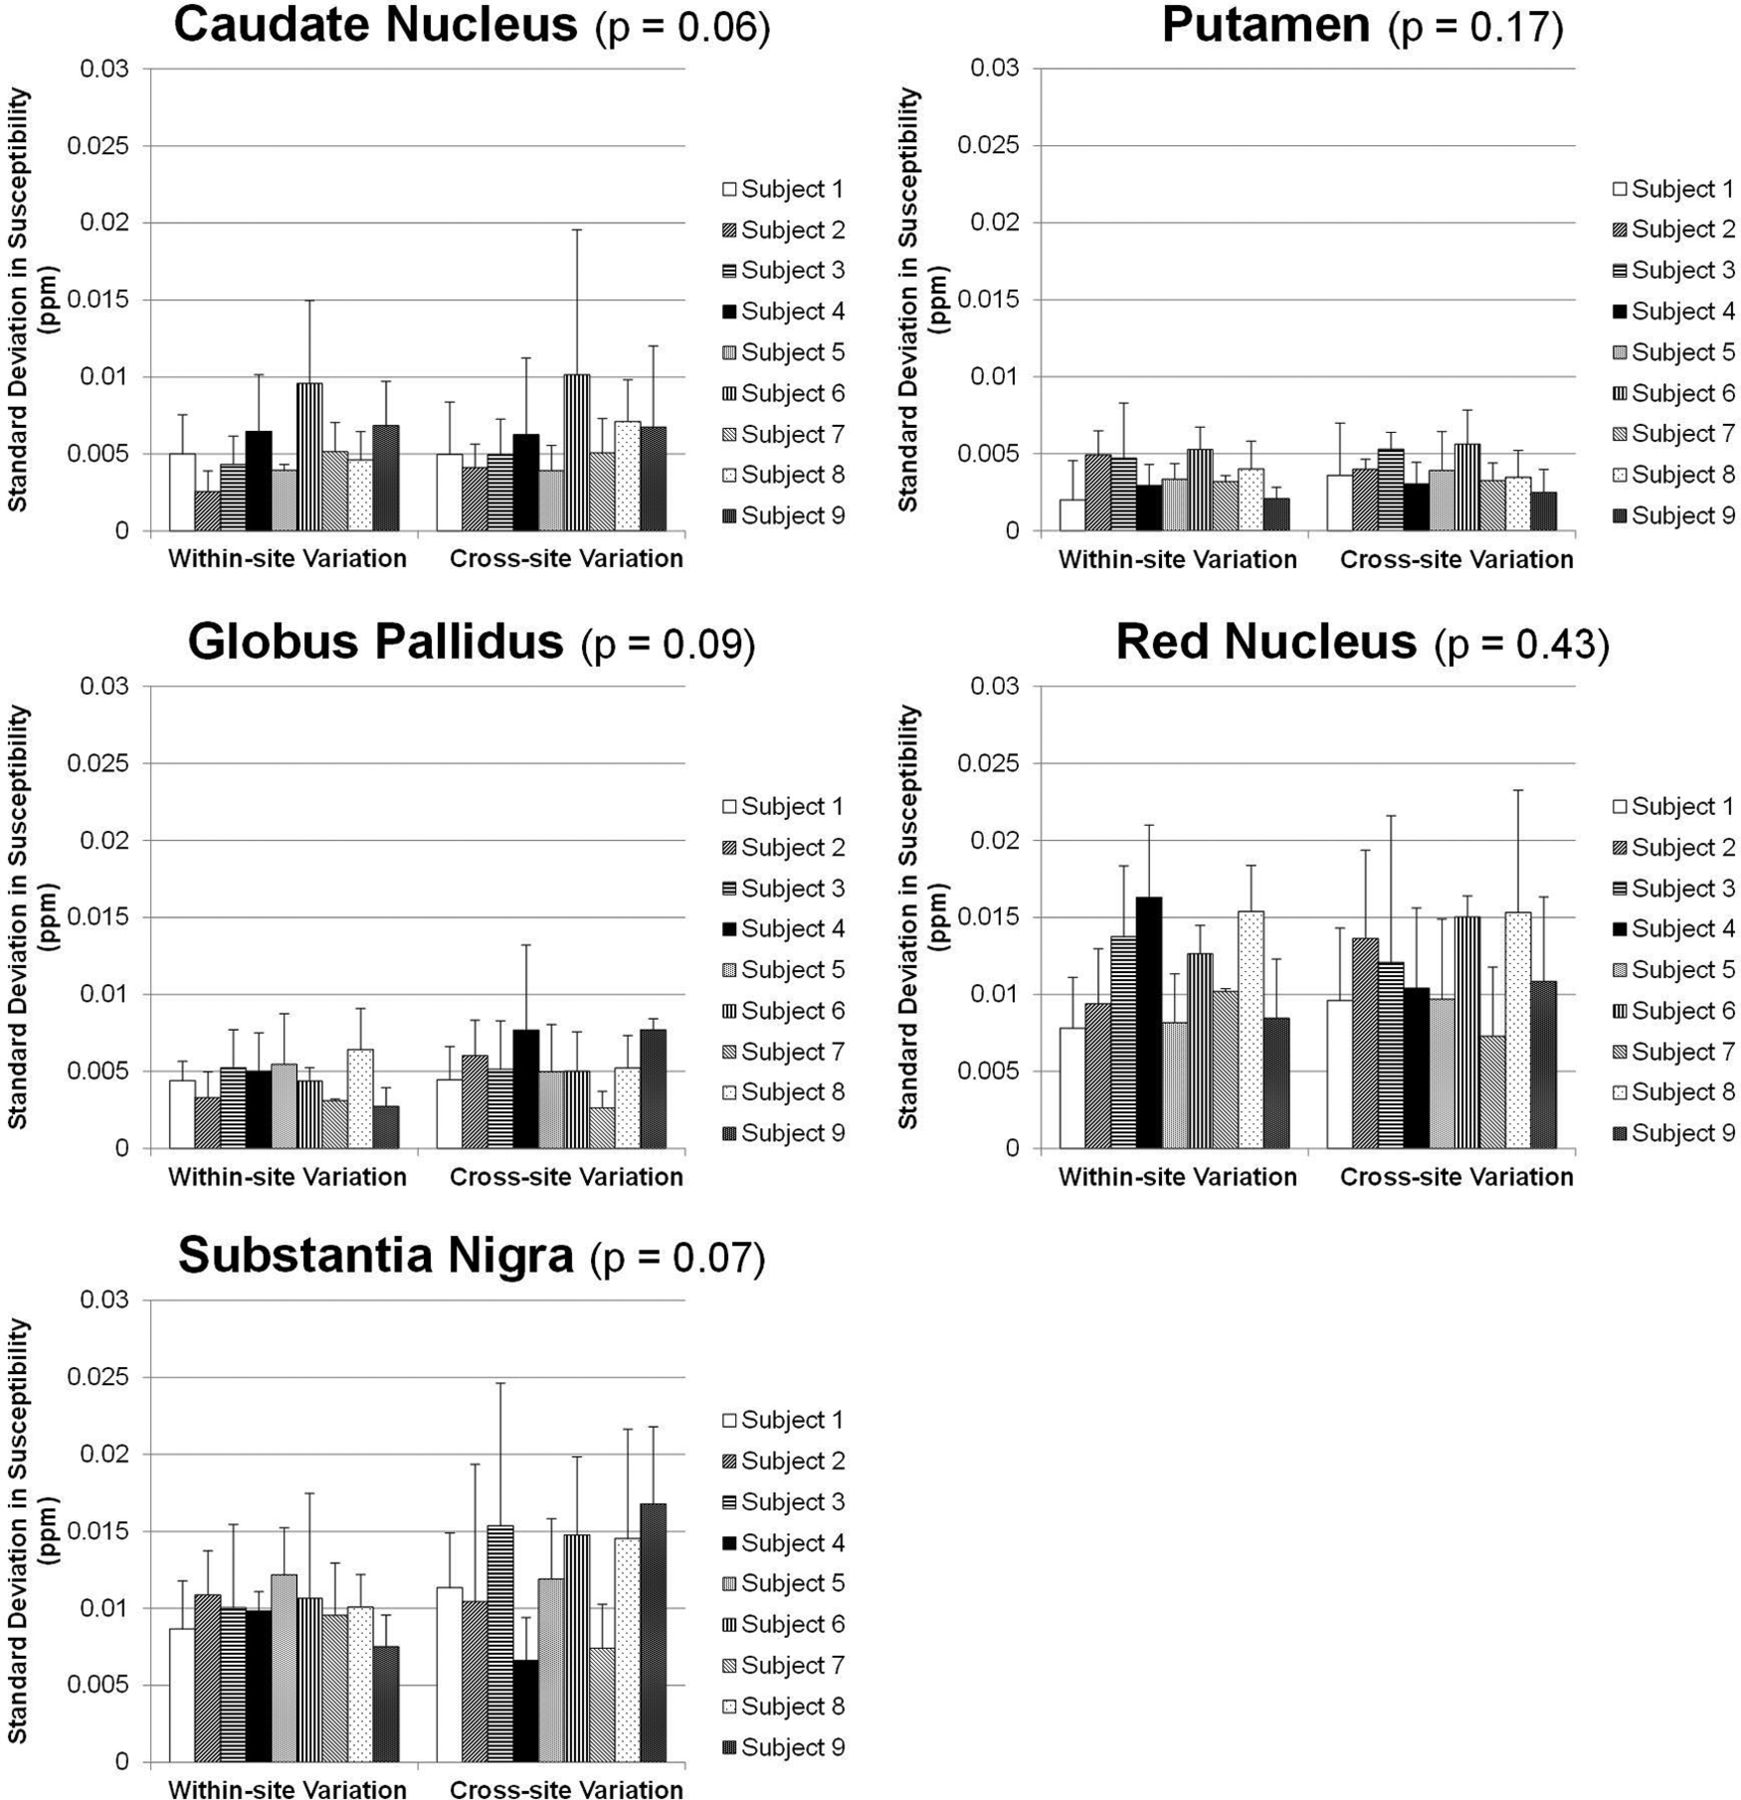
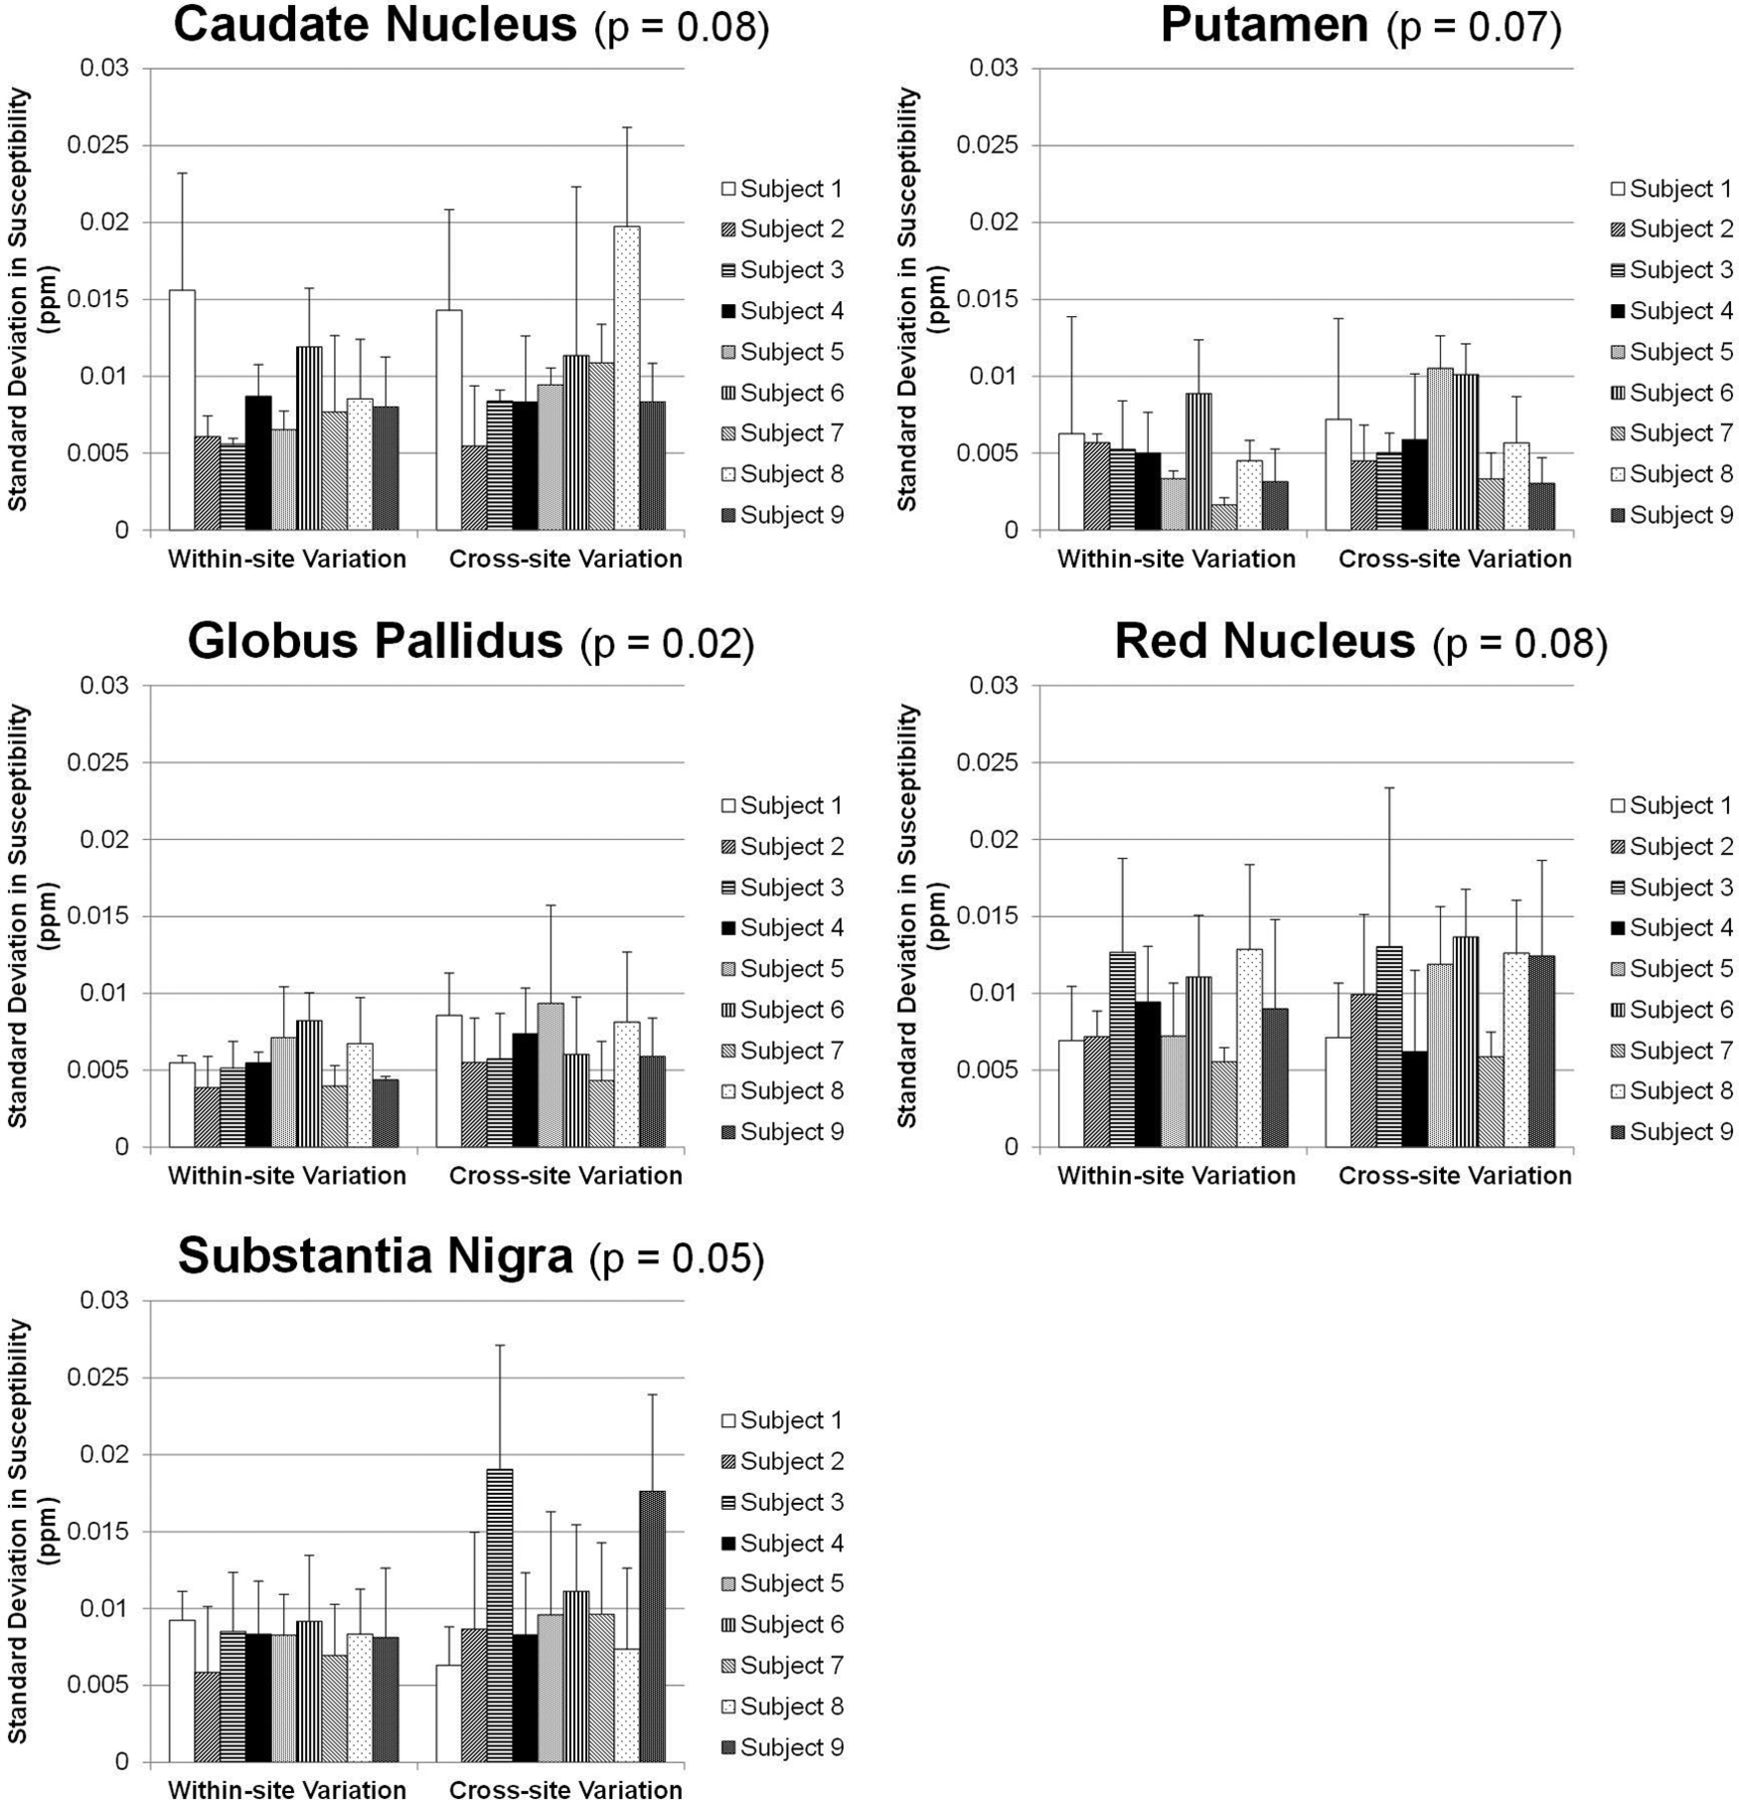
Data from multiple sites are also compared in all subjects. Figure 4 shows the susceptibility maps of another subject reconstructed with data from 3 tested scanners at sites A, B, and C by using iterative QSM. Figure 4 presents good consistency in brain structures and susceptibility values. Some difference can be observed at the frontal lobe as indicated by white arrows in Fig 4B, -C. Figures 5 and 6 show the region-of-interest analysis results from iterative QSM and deterministic QSM, respectively, of the within-site and cross-site variations for all 9 subjects. Among the 5 ROIs, the putamen and globus pallidus show comparably less imprecision in the susceptibility values, whereas the red nucleus and substantia nigra exhibit relatively larger imprecision (P < .001 for all pairs of comparison). Generally, for each subject, cross-site variation of susceptibility values is no larger than within-site variation in all ROIs statistically (P > .01 after Bonferroni correction). The Table summarizes results in Figs 5 and 6 by showing within-site and cross-site imprecisions averaged from 9 subjects. Iterative QSM and deterministic QSM perform equally well in these regions. The caudate nucleus is the only exception among the 5 ROIs, in which iterative QSM (0.0054 and 0.0059 ppm for within-site and cross-site imprecisions, respectively) is found to outperform deterministic QSM (0.0087 and 0.0107 ppm for within-site and cross-site imprecisions, respectively).

Susceptibility maps reconstructed by using iterative QSM with data from 3 scanners at sites A, B, and C. A–C, Good consistency in brain structures and susceptibility values is shown. Some difference is found at the frontal lobe as indicated by white arrows in B and C, likely due to different shimming conditions in this region.

Within-site (left) and cross-site (right) imprecisions shown as SDs from multiple measurements on the 9 subjects by using the iterative QSM algorithm. The P values shown in the subplot titles stand for the difference between within-site and cross-site precisions (paired Student t test). For all 5 regions, cross-site variations are not larger than within-site variations. The putamen and globus pallidus show the highest precision, followed by the caudate nucleus, red nucleus, and substantia nigra.

Within-site (left) and cross-site (right) imprecisions shown as SDs from multiple measurements on the 9 subjects by using the deterministic QSM algorithm. The P values shown in the subplot titles stand for the difference between within-site and cross-site precisions (paired Student t test). For all 5 regions, cross-site variations are not larger than within-site variations. The putamen and globus pallidus show the highest precision, followed by the caudate nucleus, red nucleus, and substantia nigra.
Within-site and cross-site imprecisions averaged from 9 subjects
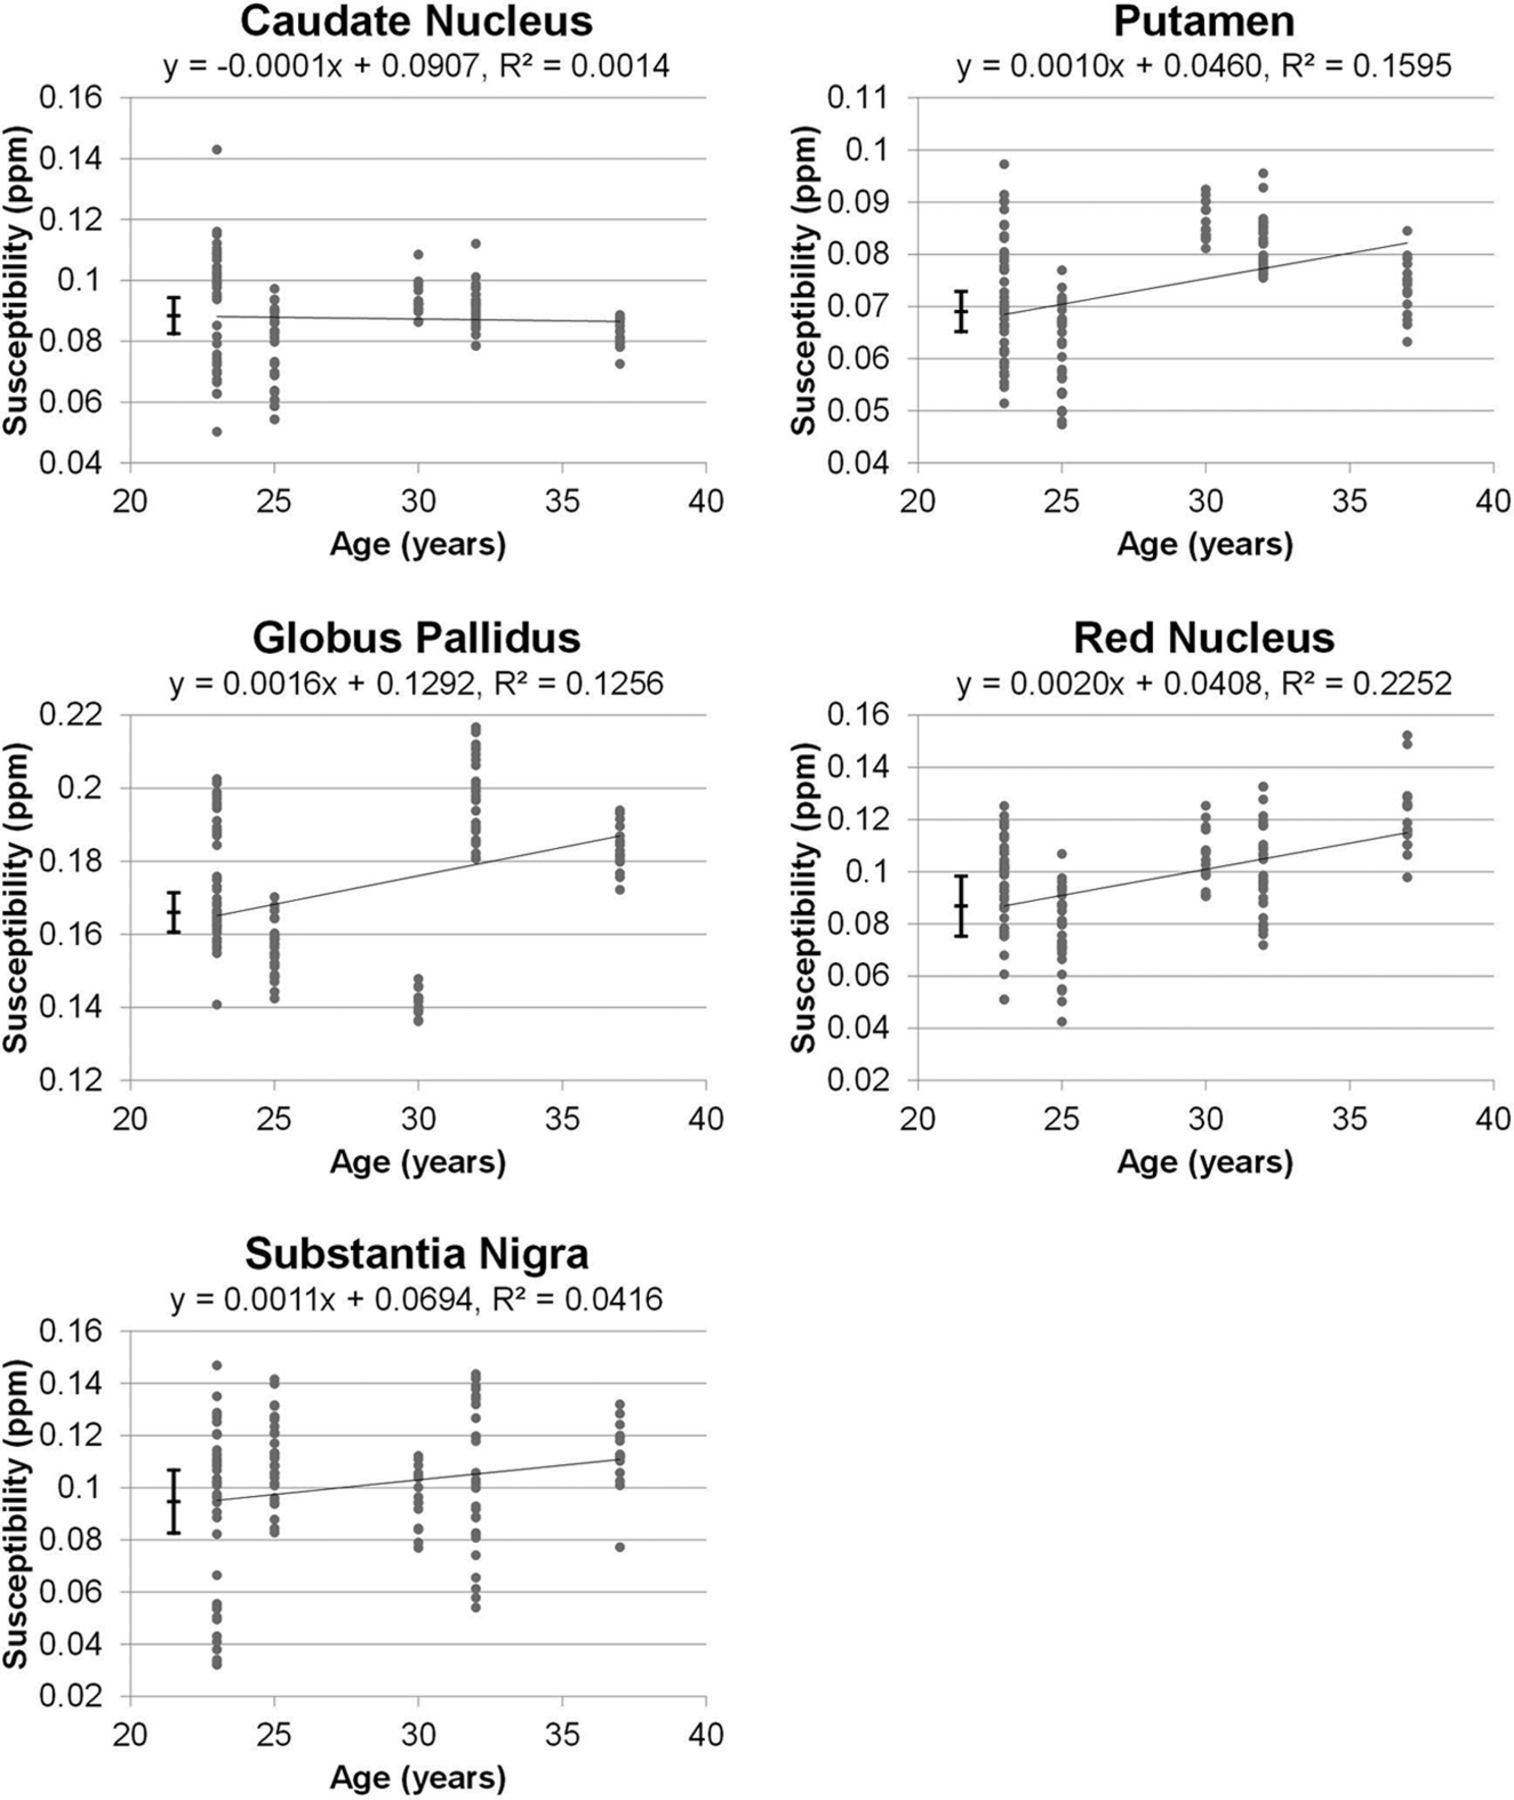
Figure 7 plots the susceptibility values versus age with the preliminary linear regression results. Among the 5 selected ROIs, the putamen, globus pallidus, and red nucleus present correlation coefficients of 0.40, 0.35, and 0.47 (P < .001), respectively, which reach statistical significance. The caudate nucleus, on the other hand, shows no age association (P > .5). The substantia nigra exhibits marginal association with age, showing a correlation coefficient of 0.20 and P = .02, which does not reach statistical significance after Bonferroni correction.

Linear regression results comparing susceptibility values versus age by using 135 datasets collected in this study. Among the 5 ROIs, the putamen, globus pallidus, and red nucleus present correlation coefficients of 0.40, 0.35, and 0.47, respectively (P < .001). The caudate nucleus shows no age association (P > .5), and the substantia nigra exhibits a marginal association that does not reach statistical significance after Bonferroni correction (P = .02). The vertical error bars shown on the left stand for the cross-site variability values of iterative QSM found for these regions.
Discussion
Quantitative susceptibility mapping provides an important opportunity for measuring pathologic changes in iron content to improve the diagnosis of brain diseases.25 Before one fully uses the potential of QSM, it should be understood that settings of the parameters in the data-preprocessing procedures and the susceptibility-mapping algorithms could both lead to variations in the quantitative results. Therefore, it is essential to establish the precision level of QSM in terms of both within-site and cross-site reproducibility before wide application of this technique to clinical studies.
The results from our study show that while within-site and cross-site yield similar reproducibility levels in general, the caudate nucleus, putamen, and globus pallidus show significantly higher precision in susceptibility values (average variations on the order of 0.005 ppm) than the red nucleus and substantia nigra (average variations on the order of 0.01 ppm) when computed by using iterative QSM. This regional dependency of QSM precision is anticipated to arise from the influences of air-tissue interfaces. In fact, the shimming condition is expected to alter in different scans particularly near the air-tissue interfaces, which in turn, could cause inconsistencies in background field removal via the PDF method. Moreover, the PDF approach, though relatively robust compared with the high-pass-filtering approach, is known to exhibit difficulties in the object boundaries, which also correspond to regions adjacent to the air cavities.18 Our experimental observation of the somewhat larger cross-site discrepancy in the frontal region, as shown in Fig 4, is also consistent with the inference that boundaries of large susceptibility changes remain the major challenging regions for QSM. The red nucleus and substantia nigra are 2 examples of tissues at the skull base level, hence exhibiting relatively lower precision than other regions investigated in this study.
One recent study reported aging-related increases in susceptibility values in healthy human subjects, with stronger statistical significance found in the putamen, globus pallidus, and red nucleus than in the substantia nigra, and insignificant changes in the caudate nucleus,7 all in very good agreement with findings from our study. In the study by Bilgic et al,7 the analysis was performed on 2 groups of subjects whose age ranges were far separated (21–29 years for the young population versus 64–86 years for the elderly population, respectively), as opposed to our preliminary investigation in which the subject age range was relatively narrow (23–37 years). Nevertheless, the ranges of the numeric values of the magnetic susceptibility found for these brain regions in our data are consistent with those in previous investigations.7,26 More important, with the levels of precision achieved in our study, future examinations of the aging-related susceptibility changes on the basis of regression analysis as opposed to categoric analysis should be highly feasible.
In the phantom experiment, the slope between measured and expected susceptibility values in Fig 1 is 0.91, which reveals 9% of the inaccuracy in QSM. The inaccuracy of QSM in this study was found to be at a level similar to that found in another study (Fig 2 in de Rochefort et al, slope = 0.93).1 Although the slope is found to deviate from the ideal value of unity, the R2 value of 0.9999 between measured and expected susceptibility values demonstrates the high linearity of susceptibility mapping within the range of 0–2.04 ppm. Thus, the precision and reproducibility are not affected, even if the nonunity slope currently remains an unsolved issue if absolute accuracy is required.
Comparison of iterative and deterministic QSM shows that both algorithms are capable of solving the inverse problem of susceptibility mapping with good consistency, at least for region-of-interest-based analysis. However, deterministic QSM may be more susceptible to streaking artifacts at regions surrounding strong susceptibility changes, as shown in the phantom images. This susceptibility could also explain the somewhat inferior reproducibility of deterministic QSM to iterative QSM in the caudate nucleus. An examination of equations 1 and 2 suggests that the inclusion of the edge mask from the magnitude image in the regularization term is the major cause for the difference in the performance for the 2 QSM algorithms. Most interesting, on human brain susceptibility maps obtained in vivo by using deterministic QSM, streaking artifacts are not as visually prominent as on the phantom images, where the possible presence of the streaking artifacts may have been masked by the texture of brain tissues. While for these human data, the comparative superiority of the 2 QSM algorithms cannot be assessed because no ground truth could be obtained for validation, causing difficulty in determining which of the 2 QSM methods gives a lower level of streaking artifacts in Fig 3, the phantom results are certainly in favor of iterative QSM. Consequently, although the deterministic QSM is found to be at least 700 times faster than iterative QSM and thus opening an opportunity for on-line reconstruction of susceptibility maps at the MR imaging console, for detailed quantitative analysis such as aging-related changes, the iterative QSM approach is still recommended.
In data preprocessing, the purpose of background field removal is to extract local magnetic field variation generated by brain tissues, which is subsequently used for QSM. The high-pass filtering method is not preferred for quantitative susceptibility mapping, even though it is one of the most frequently used methods for background field removal in MR imaging (eg, in susceptibility-weighted imaging). One of the major limitations of applying high-pass filtering in QSM is that part of the local field information could be mistakenly filtered out, because the distributions of spatial frequency in local field and in background field cannot be cleanly separated by a single high-pass-filtering kernel size. Therefore, new methods, including the PDF18 and the sophisticated harmonic artifact reduction for phase data (SHARP)22 methods, have been proposed for background field removal in QSM. The idea of both the PDF and the SHARP methods is to decompose local field and background field by using their physical properties. While the PDF method uses a projection theorem, the SHARP method applies the Laplace equation to separate background field. In previous studies, both the PDF and the SHARP methods have been demonstrated to be superior to the high-pass-filtering method for background field removal in QSM.18,22 From numeric simulation, we have also confirmed that local field obtained by the PDF method preserves subtle field changes from brain tissues better than that obtained by the high-pass-filtering method (data not shown). We, therefore, think that both the PDF and the SHARP methods are adequate for background field removal in QSM. The comparison between the PDF and the SHARP methods, however, is beyond the scope of this study.
This study is limited by the absence of flow compensation to reduce flow-related phase accumulations in vessels and the ventricles. Because our study used commercial 3D multiecho gradient-echo sequences on the tested scanners, full flow compensation for all echoes was unavailable at the time of this study. This scenario may have affected the reference susceptibility values calculated for the flowing CSF in the lateral ventricles. Nonetheless, this minor weakness influences only the absolute susceptibility values reported for the 5 ROIs and is relatively unimportant to our investigation focused on within-site and cross-site precision assessment. Some investigators used the splenium as a reference7 instead of using CSF.26 Yet in our experience, the regional variations of susceptibility in the splenium are no smaller than those found for the lateral ventricles. This potential limitation of uncertain susceptibility values for the CSF could be alleviated with pulse sequence modifications to include flow compensation for all echoes.17,27 As a last note, the statistical sensitivity of cross-site imprecisions may be somewhat limited by the derivation of SDs by using only 3 numbers. However, this limitation is because we could only access the three 3T scanners. Moreover, even with this statistical limitation, results from this study could still serve as a reference for the imprecision level to be expected in future multisite QSM studies.
Conclusions
In summary, quantitative susceptibility mapping is a technique of high potential to measure changes in iron content in human brain tissues. This study demonstrates that an average imprecision level of approximately 0.005–0.01 ppm, depending on the location within the brain, could be achieved at 3T for QSM when used with careful control, even on different scanners. Results from our study may further increase the practicality and applicability of QSM in longitudinal and cross-site human brain studies.
Acknowledgments
The authors thank the following institutions for their research support: Research Center for Mind, Brain & Learning, National Chengchi University; Mind Research and Imaging Center, National Cheng Kung University; and the Department of Radiology, Kaohsiung Veterans General Hospital.
Footnotes
Disclosures: Po-Yu Lin, Tzu-Cheng Chao, Ming-Long Wu—RELATED: Grant: This study was partially supported by research funding from the National Science Council, Taiwan; Support for Travel to Meetings for the Study or Other Purposes: National Science Council, Taiwan, Comments: The traveling expense among multiple MRI sites to collect data was supported by research grants from the National Science Council, Taiwan.
The authors were supported in part under grant Nos. NSC-101-2221-E-006-063-MY2 (P.-Y.L. and M.-L.W.), NSC-100-2218-E-006-038-MY2 (T.-C.C.), and MOST-102-2221-E-006-017 (T.-C.C.) from the National Science Council, Taiwan; and the Aim for the Top University Project to the National Cheng Kung University, Ministry of Education, Taiwan (M.-L.W.).
Indicates open access to non-subscribers at www.ajnr.org
REFERENCES
- Received March 19, 2014.
- Accepted after revision August 28, 2014.
- © 2015 by American Journal of Neuroradiology


Jump to section
Related Articles
Cited By...
- Iron Deposition and Distribution Across the Hippocampus Is Associated with Pattern Separation and Pattern Completion in Older Adults at Risk for Alzheimer's Disease
- Validation of Data Acquisition and Phase Estimation for Quantitative Susceptibility Mapping with a Rotating-Tube Phantom
- Multi-centre, multi-vendor reproducibility of 7T QSM and R2* in the human brain: results from the UK7T study
- In Vivo MRI Mapping of Brain Iron Deposition across the Adult Lifespan