
Abstract
BACKGROUND AND PURPOSE: Dilated perivascular spaces have been shown to be a specific biomarker of cerebral small-vessel disease in young patients with dementia. Our aim was to examine the discriminative power of dilated cerebral perivascular spaces as biomarkers of small-vessel disease in a very elderly population of patients with dementia.
MATERIALS AND METHODS: We studied healthy volunteers (n = 65; mean age, 78 ± 5.6 years) and subjects with vascular dementia (n = 39; mean age, 76.9 ± 7.7 years) and Alzheimer disease (n = 47; mean age, 74.1 ± 8.5 years). We compared white matter hyperintensity and 2 semiquantitative perivascular space scoring systems (perivascular space-1 and perivascular space-2). Intra- and interobserver agreement was assessed by using a weighted Cohen κ statistic. Multinomial regression modeling was used to assess the discriminative power of imaging features to distinguish clinical groups.
RESULTS: White matter hyperintensity scores were higher in vascular dementia than in Alzheimer disease (P < .05) or healthy volunteers (P < .01). The perivascular space-1 score was higher in vascular dementia and Alzheimer disease than in healthy volunteers (P < .01). The perivascular space-2 score in the centrum semiovale showed no intergroup differences. However, perivascular space-2 in the basal ganglia was higher in vascular dementia than in Alzheimer disease (P < .05) or healthy volunteers (P < .001) and higher in Alzheimer disease than in healthy volunteers (P < .001). Modeling of dementia versus healthy volunteers, Alzheimer disease versus healthy volunteers, and vascular dementia against Alzheimer disease demonstrated perivascular space-2basal ganglia as the only imaging parameter with independent significant discriminative power (P < .01, P < .01, and P < .05) with areas under the receiver operating characteristic curve of 0.855, 0.774, and 0.71, respectively. Modeling of vascular dementia versus healthy volunteers showed that perivascular space-2basal ganglia (P < .01) and the modified Scheltens score (P < .05) contributed significant, independent discriminatory power, accounting for 34% and 13% of the variance in the model respectively.
CONCLUSIONS: Dilated perivascular spaces remain a valuable biomarker of small-vessel disease in an elderly population.
ABBREVIATIONS:
- AD
- Alzheimer disease
- BG
- basal ganglia
- CSOV
- centrum semiovale
- Norm
- healthy volunteers
- PVS
- dilated perivascular spaces
- ROC
- receiver operating characteristic
- SVD
- small-vessel disease
- VaD
- vascular dementia
Alzheimer disease (AD) and vascular dementia (VaD) account for approximately 80% of dementias.1 They can occur separately but are more likely to coexist with increasing age.2 Vascular dementia is multifactorial in nature and may result from thrombotic or embolic large-vessel occlusion with consequent cortical infarction or, more commonly, cerebral small-vessel disease (SVD) with ischemic injury to deep brain structures and cerebral white matter.3,4 While segmental infarction and hemorrhages can be identified on MR imaging, there is a pressing need for reliable biomarkers of SVD.5 Potential imaging biomarkers include deep white matter hyperintensities, dilated perivascular spaces (PVS), lacunar stroke, cerebral microbleeds, and cerebral atrophy.5
Histologically, PVS are a feature of moderate-to-severe SVD.6 Imaging studies have shown them to be highly discriminative for diseases associated with SVD, including lacunar stroke,7 treatment-resistant late-onset depression,8 and vascular dementia.6 In each of these cases, PVS provided greater discriminative power than deep white matter hyperintensity scores. A study of 32 healthy elderly subjects also showed that PVS scoring correlated with Framingham stroke risk when deep white matter hyperintensity scores did not.9
This study builds on previous studies of PVS in young patients with dementia6 and older patients with lacunar stroke.7 Both SVD and imaging features of vascular disease are increasingly common with advanced age and are commonly found in healthy subjects and in patients with primary neurodegenerative disorders such as AD. These findings are reflected with the scoring systems used by previous authors. Patankar et al,6 working in young patients with early-onset dementia, used a scoring system designed to detect early SVD on the basis of the presence of small numbers of PVS in the basal ganglia, with higher scores corresponding to both an increased number and location farther from the brain surface. In elderly individuals, PVS throughout the basal ganglia are increasingly common so that the discriminatory power of this scoring system is likely to be reduced. Consequently, Doubal et al,7 comparing PVS in older patients with lacunar and cortical stroke, used a scoring system based on the maximum number of PVS in any single axial section through the basal ganglia and centrum semiovale.
In this study, we examined the utility of PVS and deep white matter hyperintensities as biomarkers of SVD in a very elderly population and compared the discriminative power of the previously described PVS scoring systems to discriminate AD from VaD.
Materials and Methods
The South Manchester local research ethics committee approved the project, and all subjects gave informed consent. Consent was gained with the help of caregivers for those lacking full capacity.
Patient Selection
We recruited 3 groups of subjects: 1) AD, 2) VaD, and 3) healthy age-matched controls (Norm). Specialists in geriatric psychiatry performed clinical recruitment across Greater Manchester, and all patients satisfied the criteria for dementia in the Diagnostic and Statistical Manual of Mental Disorders, 4th ed. Patients with Alzheimer disease fulfilled the National Institute of Neurologic and Communicative Disorders and Stroke–Alzheimer disease and Related Disorders Association criteria,10 and patients with vascular dementia fulfilled the National Institute of Neurologic Disorders and Stroke–Association Internationale pour la Recherche et l'Enseignement en Neurosciences criteria for vascular dementia.11 Those with mixed AD and VaD and those receiving anticoagulant treatment were excluded.12
Control Subjects
Control subjects were recruited from the general practices at which patients were registered. They were matched for age, sex, and socioeconomic status. Control subjects with significant cognitive abnormalities were excluded (see below). To avoid selection bias, we did not include vascular risk factors in the inclusion/exclusion criteria.
Exclusion Criteria
Patients scoring <10 (severe dementia) on Mini-Mental State Examinations were excluded because they were considered unlikely to have the capacity to give consent for the study. Controls with a diagnosis of dementia or with Mini-Mental State Examinations scores of <24 were excluded because they may have had underlying dementia or other cognitive impairment. In addition, following MR imaging, controls with evidence of silent infarction demonstrated on T1 and FLAIR images were excluded from the study.
Neuroimaging
All subjects were scanned by using a 1.5T whole-body scanner with a birdcage head coil receiver (ACS-NT, Power Track 6000 gradient subsystem; Philips Healthcare, Best, the Netherlands). Sequences included the following: 1) 3D volume fluid-attenuated inversion recovery (TR/TE/T1 = 11,000/140/2600 ms, section thickness = 3.0 mm), and 2) 3D volume T1-weighted inversion recovery (TR/TE/T1 = 6850/18/300 ms, section thickness = 3.0 mm). For all sequences, the matrix was 256 × 256, and the FOV was 230 × 230 mm.
Images were transferred to a stand-alone Macintosh personal computer (Apple, Cupertino, California) workstation and viewed by using a clinical workstation application (OsiriX, http://www.osirix-viewer.com).13
Image Analysis
White matter lesions were scored by using a modified Sheltens score previously validated in our laboratory.14 The independent scoring of the putamen and globus pallidus was replaced with a composite score for the lentiform nucleus on the basis of poor reproducibility and interrater agreement (Table 1). Scoring was performed by an experienced neuroradiologist (A.J.) by using T1 inversion recovery and FLAIR images.
Modified version of Scheltens scoring scheme used in the study
Axial T1 inversion recovery images were used to visualize dilated PVS. Although most studies use heavily T2-weighted images, previous reports have demonstrated high conspicuity of PVS by using this very heavily T1-weighted sequence.6,8 Two previously described scoring systems were used. The first, described by Patankar et al in 2005,6 counts total PVS with a total score of 5 in the basal ganglia (BG; PVS-1BG) and a total score of 2 in the centrum semiovale (CSOV; PVS-1CSOV). In the CSOV, 0 indicated none; 1, <5 per side; and 2, >5 on 1 or both sides. In the basal ganglia, 0 indicated PVS present only in the substantia innominata and <5 PVS on either side; 1, PVS only in the substantia innominata but >5 dilated on either side; 2, 0–5 PVS in the lentiform nucleus on either side; 3, 5–10 PVS in the lentiform or 0–5 in the caudate nucleus on either side; 4, >10 in the lentiform nucleus and <5 in the caudate nucleus on either side; 5, >10 in the lentiform nucleus and >5 in the caudate nucleus on either side. Care was taken to ensure that PVS were not counted twice by following their continuity through sections. PVS-1BG and PVS-1CSOV were combined to create a cumulative score (PVS-1).
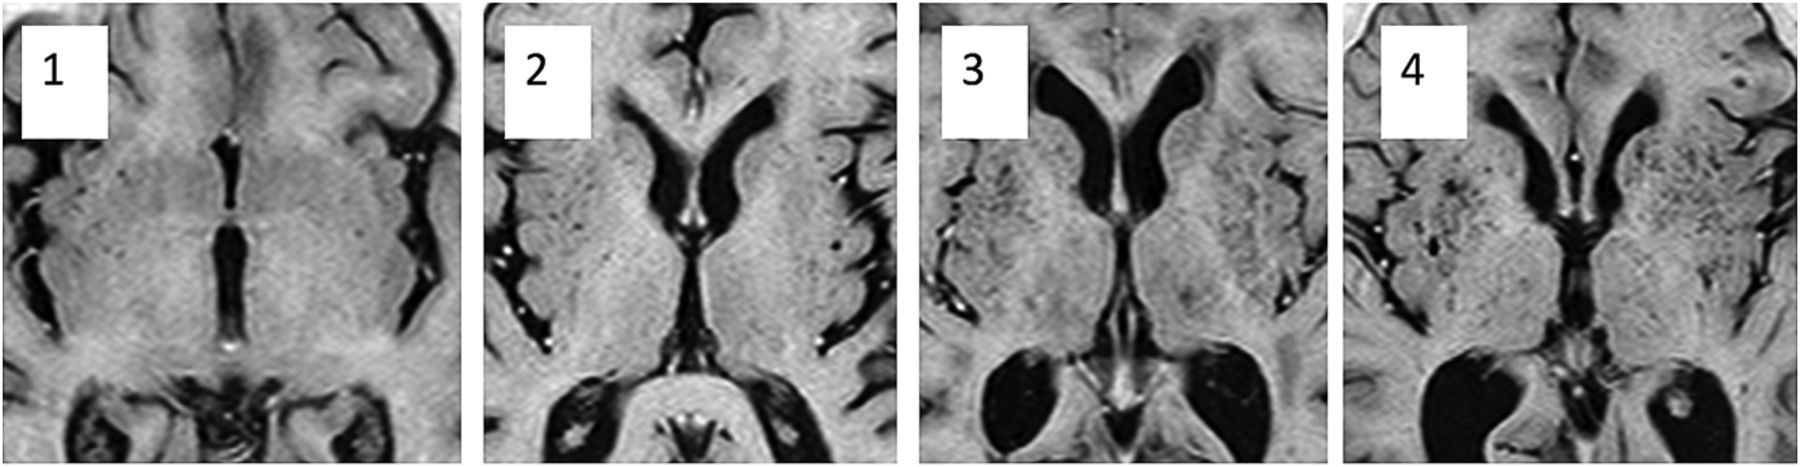
The second scoring system was adapted from Doubal et al, 2010.7 The BG (PVS-2BG) and CSOV (PVS-2CSOV) were scored separately; then, the scores were combined to produce a total score (PVS-2). In each structure, the section with most PVS visible was selected and the number was counted on the side of the brain with the greatest number. Scores were as follows; 0 = no PVS, 1 = 1–10, 2 = 11–20, 3 = 21–30, 4 = 31–40, and so on. The original Doubal score had 3 = 21–40, and 4 (>40 PVS) was the maximum score (Fig 1).

Images show dilated perivascular spaces in the basal ganglia corresponding to PVS-2BG scores of 1–4.
Inter- and Intraobserver Variation Studies
An initial inter- and intraobserver variation study was performed to assess the reliability of each component of the scoring systems. All subjects with dementia (47 with AD and 39 with VaD) and the first 31 healthy control subjects, selected by the recruitment date, were included in the interobserver study (n = 117). All cases were scored in random order by 3 experienced neuroradiologists. One observer (A.J.) then repeated the scoring on all cases with 7 days between the sessions. The study assessed all components of the modified Scheltens score (Table 1)14 and the 2 previously described scoring systems for the presence of dilated PVS.6,7
Statistical Analysis
Statistical analyses were performed in SPSS, Version 20.0 (IBM, Armonk, New York) and InStat (GraphPad Software, San Diego, California). Inter- and intraobserver agreements were assessed by using a weighted Cohen κ statistic. Standard definitions for the interpretation of the κ statistic were adopted. The agreement strength was defined as very good, κ = 0.81–1.00; good, κ = 0.61–0.80; moderate, κ = 0.41–0.60; fair, κ = 0.21–0.40; and poor, κ < 0.20. Tests for group differences used ANOVA for scalar variables with post hoc tests for between-group differences by using the Tamahane test, with significance adjusted to P < .01 to compensate for type 1 effects. Correlations among imaging variables were assessed by using the Spearman rank correlation coefficient.
Four data models were constructed to assess the contribution of imaging features to the separation of individuals with dementia from controls, those with VaD from controls, those with AD from controls, and those with AD from those with VaD. Data were standardized for each scenario to produce z scores. Multinomial logistic regression modeling was performed in Wizard Pro (http://wizard.evanmiller.org/), treating diagnosis as the outcome class (1 = AD, 2 = VaD, and 3 = Norm). Imaging biomarker scores were entered as covariates in the model if they showed a correlation with diagnosis at a significance of <.05. Variables were then sequentially removed from the model on the basis of the significance of their contribution to the model until all remaining variables were significant at the P < .05 level. Patient age and sex were entered as covariates in the model. Receiver operating characteristic (ROC) curves were generated by using the classifier for each model and the area under the ROC curve, and the observed sensitivity and specificity and positive and negative predictive values were calculated.
Results
The final study group consisted of 151 subjects; 47 with AD (mean age, 74.1 ± 8.5 years), 39 with VaD (mean age, 76.9 ± 7.7 years), and 65 Norm (mean age, 78 ± 5.6 years). Demographic and imaging biomarker data are shown in Table 2. Inter- and intraobserver variation studies showed good to very good agreement for modified Scheltens, PVS-1, and PVS-2 scores (Table 3).
Demographic and imaging biomarker data for individual diagnostic groupsa
Inter- and intraobserver variation for PVS scoresa
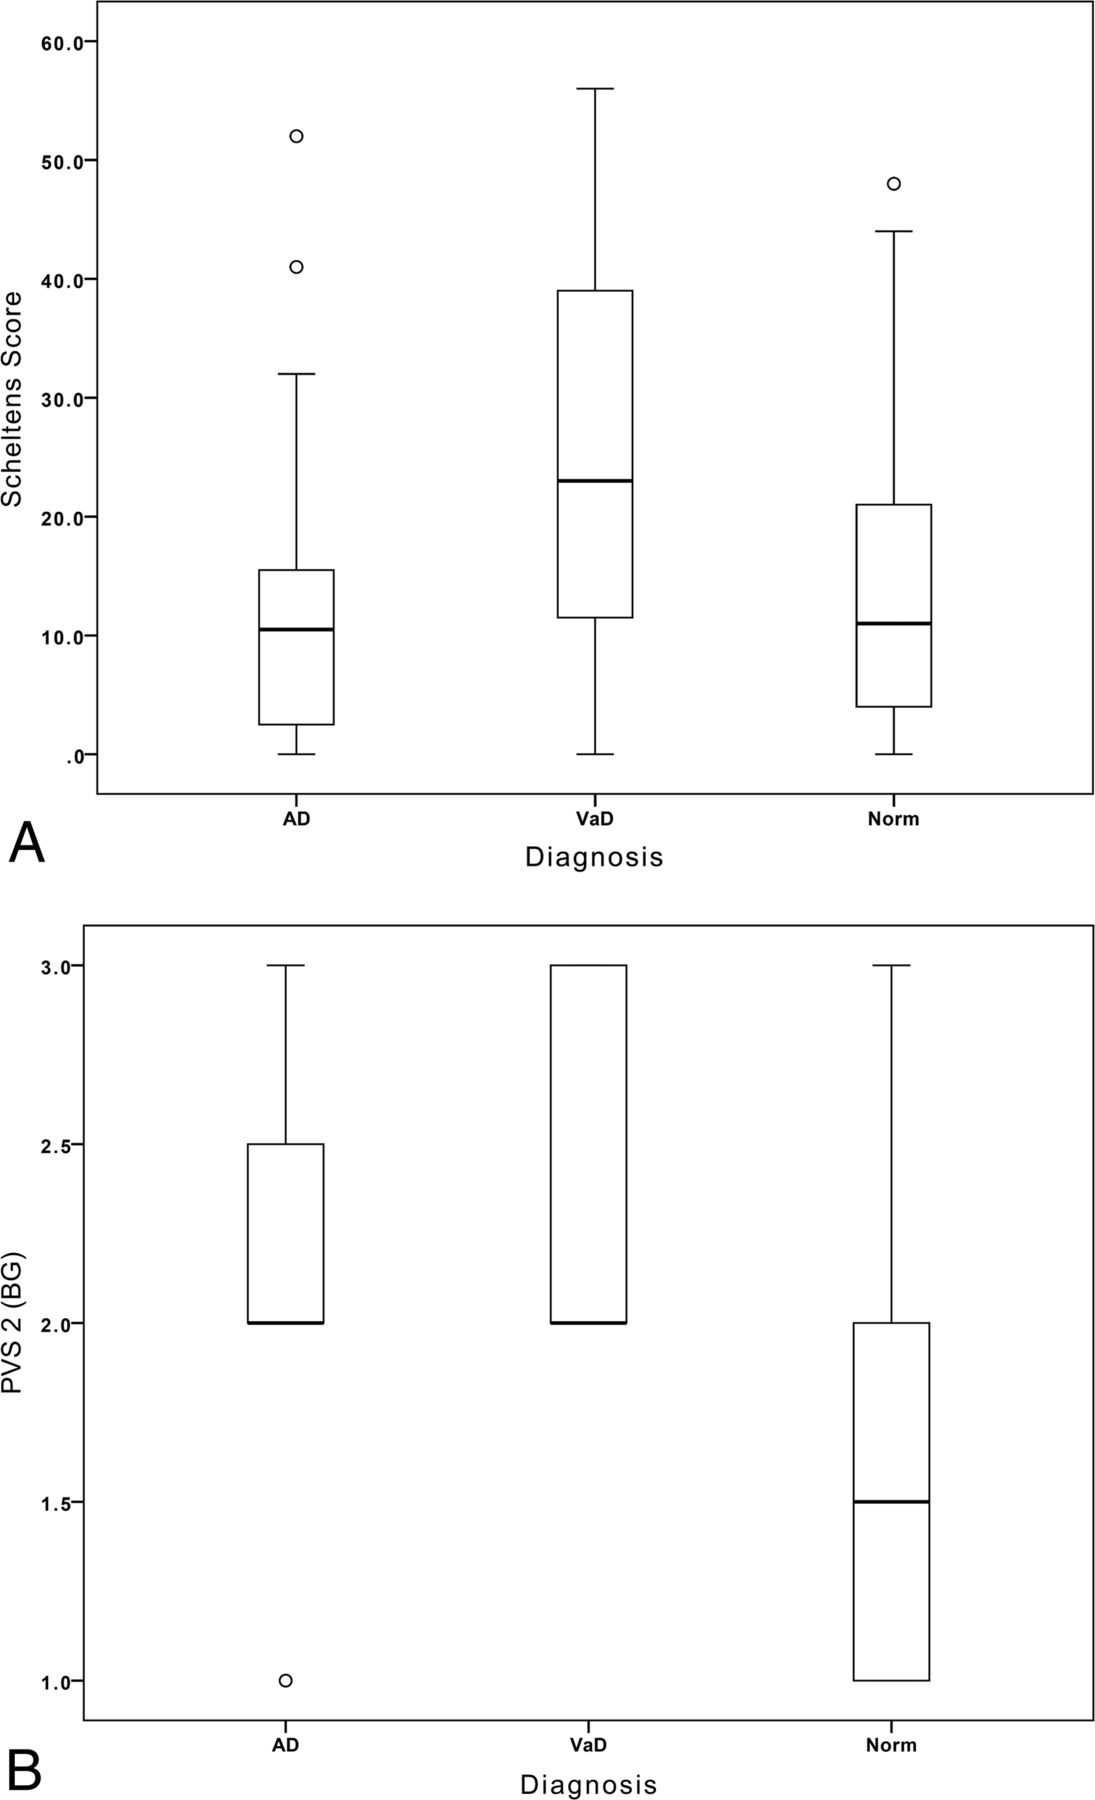
The modified Scheltens score was higher in VaD than in AD (P < .01) or Norm (P < .01), but there was no significant difference between AD and Norm (Fig 2A).

A, Boxplot shows the Scheltens white matter scores for the 3 subject groups. B, Boxplot shows the PVS-2BG scores for the basal ganglia in the 3 subject groups.
The PVS-1 score was higher in VaD and AD than in Norm (P < .01). The PVS-2 score in the centrum semiovale showed no intergroup differences. However, PVS-2 in the basal ganglia was higher in VaD than in AD (P < .05) or in Norm (P < .001) and higher in AD than in Norm (P < .001, Fig 2B).
There were strong correlations among the modified Scheltens score, PVS-1 (ρ = 0.334, P < .001), and PVS-2 (ρ = 0.347, P < .001) and between PVS-1 and PVS-2 (ρ = 0.374, P < .001).
Results from multinomial regression modeling are summarized in Table 4. PVS-2BG was the only imaging parameter with independent significant discriminative power (P < .001) to distinguish patients with dementia (VaD and AD combined) from healthy controls. The area under the ROC curve was 0.855.
Results of the multinomial linear regression for each of the 4 scenariosa
Modeling of AD against Norm also demonstrated PVS-2BG as the only imaging parameter with independent significant discriminative power (P < .01) with an area under the ROC curve of 0.774. Modeling of VaD against Norm showed that PVS-2BG (P < .01) and the modified Scheltens score (P < .05) contributed significant, independent discriminatory power, accounting for 34% and 13% of the variance in the model, respectively. The resulting model produced an area under the ROC of 0.93. Finally, modeling of VaD against AD demonstrated PVS-2BG as the only imaging parameter with independent significant discriminative power (P < .05), with an area under the ROC curve of 0.71.
Discussion
The presence of dilated PVS, particularly in the basal ganglia, is a cardinal component of the histologic features of SVD.6 Visualization of PVS by using MR imaging has been shown to correlate with a number of clinical features characterized by SVD, including VaD in a population with early-onset,6 treatment resistance in late-onset depression,8 lacunar stroke syndrome,15 and high stroke risk in healthy individuals.9 Furthermore, PVS appear more specific for SVD and have greater discriminative power than the severity of associated white matter hyperintensities in all these cases. PVS dilation has been quantified by using semiquantitative scoring systems, of which 2 have been described. The first, designed to identify early mild-moderate SVD, is based on the presence and location of small numbers of PVS in the basal ganglia, recognizing that PVS in the lentiform nucleus are an early sign of SVD and that the presence of PVS deeper along the path of the striothalamic arteries indicates increased severity.6 The second is based on the observation that in more severe SVD, extensive PVS in the basal ganglia are common, making the first scoring system insensitive to differences between patient groups, especially in older individuals. This scoring system simply counts the number of PVS in the basal ganglia and centrum semiovale on the most severely affected side of the most severely affected section.7
In this study, we have examined the discriminative power of deep white matter hyperintensities and PVS scoring systems to separate elderly patients with clinical VaD from healthy controls and patients with AD. Before the study, we had hypothesized that the diagnostic specificity of PVS seen in a young population with dementia15 would be lost in older patients with increasing frequency of incidental SVD in asymptomatic subjects5,7,9 and in those with AD.3,16⇓–18 In fact, we have shown that PVS scores retain significant discriminative power to distinguish VaD, AD, and healthy subjects and explain a greater component of the variation between groups than white matter hyperintensity scores. Despite close correlations between PVS-1 and PVS-2 scores, PVS-2 was the more powerful discriminant, and the PVS-1 displayed no independent significant discriminative power.
The identification of PVS-2BG as a powerful discriminator among groups in elderly patients with dementia, providing greater discriminative power than the severity of white matter hyperintensity, is initially counterintuitive. The perception that vascular dementia would be associated with increased white matter injury appears to be supported by the observed data with higher white matter hyperintensity scores in the vascular dementia group. There is, however, no observed group difference in white matter hyperintensity scores between healthy controls and those with AD, both showing values similar to those observed in healthy elderly subjects in previous studies.2 In contrast, there is clear evidence of significantly increased numbers of dilated perivascular spaces in the basal ganglia in both AD and, to a more significant extent, in VaD. Dilation of perivascular spaces is a primary histologic feature of small-vessel disease and has been shown in previous studies to be a more discriminative indicator of the presence of small vessel disease in a number of disease states.6,8 In contrast, although deep white matter hyperintensities clearly correlate with the presence of small-vessel disease, a number of other etiologic factors may also be implicated in their production.
An alternative consideration is that the discriminative power of the white matter scoring system will depend on the sensitivity to change over any given portion of the disease process. Observations of deep white matter hyperintensity in normal aging and neurodegenerative diseases demonstrate a predilection for lesions in the deep hemispheric white matter, whereas in subcortical vascular dementia, the frequency of white matter lesions in the basal ganglia and brain stem is significantly higher.2,5 Deep white matter hyperintensity accounts for a maximum of only 24/72 on the Scheltens score,14 whereas the average Scheltens score in patients with VaD in the current study was >22. Furthermore, increases in the deep white matter hyperintensity score depend on the development of large or confluent lesions and can be insensitive to the presence of numerous lesions, each <1 cm in diameter.14 It may be that in the presence of extensive deep white matter lesions such as those occurring with advancing age, the Scheltens score becomes less sensitive to increases in severity.
Conclusions
In summary, these findings indicate that PVS dilation remains a useful biomarker of SVD even in an elderly population and demonstrates greater specificity for discrimination among VaD, AD, and healthy individuals than white matter scoring schemes. Our findings also indicate that the PVS-2BG scoring scheme is preferable in an elderly population.
Acknowledgments
The authors gratefully acknowledge the major contribution of Nitin Purundare, MD, who sadly died before the completion of this study.
Footnotes
Disclosures: John Cain—UNRELATED: Grants/Grants Pending: Wellcome Trust clinical fellowship. Alan Jackson—RELATED: Grant: Wellcome Trust,* Comments: funded the initial data collection and patient recruitment; UNRELATED: Consultancy: Hoffmann-LaRoche pharmaceuticals, Comments: advisory expert on imaging studies in antiangiogenic studies in lions. *Money paid to the institution.
REFERENCES
- Received May 14, 2014.
- Accepted after revision December 1, 2014.
- © 2015 by American Journal of Neuroradiology


Jump to section
Related Articles
Cited By...
- Association of MRI Indices of Glymphatic System With Amyloid Deposition and Cognition in Mild Cognitive Impairment and Alzheimer Disease
- MRI-Visible Perivascular Spaces and Risk of Incident Dementia: The Framingham Heart Study
- Physiology and Clinical Relevance of Enlarged Perivascular Spaces in the Aging Brain
- Prevalence of hippocampal enlarged perivascular spaces in a sample of patients with hypertension and their relation with vascular risk factors and cognitive function
- Perivascular Spaces in Old Age: Assessment, Distribution, and Correlation with White Matter Hyperintensities
- Topography and Determinants of Magnetic Resonance Imaging (MRI)-Visible Perivascular Spaces in a Large Memory Clinic Cohort