
Abstract
BACKGROUND AND PURPOSE: Differentiation of tumorous intracerebral hemorrhage from benign etiology is critical in initial treatment plan and prognosis. Our aim was to investigate the diagnostic value of CT densitometry to discriminate tumorous and nontumorous causes of acute intracerebral hemorrhage.
MATERIALS AND METHODS: This retrospective study included 110 patients with acute intracerebral hemorrhage classified into 5 groups: primary intracerebral hemorrhage without (group 1) or with antithrombotics (group 2) and secondary intracerebral hemorrhage with vascular malformation (group 3), brain metastases (group 4), or primary brain tumors (group 5). The 5 groups were dichotomized into tumorous (groups 4 and 5) and nontumorous intracerebral hemorrhage (groups 1–3). Histogram parameters of hematoma attenuation on nonenhanced CT were compared among the groups and between tumorous and nontumorous intracerebral hemorrhages. With receiver operating characteristic analysis, optimal cutoffs and area under the curve were calculated for discriminating tumorous and nontumorous intracerebral hemorrhages.
RESULTS: Histogram analysis of acute intracerebral hemorrhage attenuation showed that group 1 had higher mean, 5th, 25th, 50th, and 75th percentile values than groups 4 and 5 and higher minimum and 5th percentile values than group 2. Group 3 had higher 5th percentile values than groups 4 and 5. After dichotomization, all histogram parameters except maximum and kurtosis were different between tumorous and nontumorous intracerebral hemorrhages, with tumors having lower cumulative histogram parameters and positive skewness. In receiver operating characteristic analysis, 5th and 25th percentile values showed the highest diagnostic performance for discriminating tumorous and nontumorous intracerebral hemorrhages, with 0.81 area under the curve, cutoffs of 34 HU and 44 HU, sensitivities of 65.6% and 70.0%, and specificities of 85.0% and 80.0%, respectively.
CONCLUSIONS: CT densitometry of intracerebral hemorrhage on nonenhanced CT might be useful for discriminating tumorous and nontumorous causes of acute intracerebral hemorrhage.
ABBREVIATIONS:
- ICH
- intracerebral hemorrhage
- NECT
- nonenhanced CT
The incidence of intracerebral hemorrhage (ICH) is 10–20 cases per 100,000 worldwide.1⇓–3 ICH has a high mortality rate with case-fatality rates of 34.6% at 7 days and 59.0% at 1 year.4 Intracerebral hemorrhage is classified as either primary or secondary on the basis of the underlying cause of bleeding. Primary ICH accounts for 78%–88% of ICH cases and is caused by spontaneous rupture of small vessels associated with chronic hypertension or amyloid angiopathy.5 Secondary ICH can occur in association with vascular malformations or tumors.1 Tumors account for 10% of all spontaneous ICH cases.6,7 Earlier discrimination of tumorous etiology from nontumorous causes of acute ICH might be helpful to determine appropriate imaging follow-up and avoid delays in long-term management of tumorous ICH, though acute management would not differ.
Nonenhanced CT (NECT) is the standard investigation tool for acute ICH. Because most patients with ICH with tumors have a solid enhancing portion, contrast-enhanced CT or contrast-enhanced MR imaging are indicated when secondary ICH with tumor is suspected.8⇓–10 However, enhancement of secondary ICH can be obscured by surrounding high attenuation or various T1 signal intensities from hematoma; these make diagnosis of secondary ICH difficult.10⇓–12 Dual-energy CT offers better differentiation between ICH of tumor and nontumor etiology because of better visualization of the enhancing lesion within a high-attenuation hemorrhage.13,14 However, dual-energy CT is less available than single-energy CT. Thus, a more practical tool with widespread availability in the emergency setting is necessary for early and better discrimination of acute ICH from tumorous-versus-nontumorous causes.
We hypothesized that the attenuation of tumorous ICH differs from that of nontumorous ICH on NECT with the presence of solid lesions. We investigated the diagnostic value of CT densitometry of acute ICH to discriminate tumorous and nontumorous causes of acute ICH.
Materials and Methods
This retrospective study was approved by our institutional review board, which waived the requirement for informed consent.
Patient Selection
From November 2005 through September 2013, 289 patients with acute subcortical or lobar hemorrhage were reviewed. The study population enrollment process is summarized in Fig 1. Inclusion criteria were the following: 1) acute single subcortical or lobar ICH, 2) available preoperative NECT acquired within 24 hours after symptom onset, 3) no known brain pathology with hemorrhage risk such as AVM or brain tumor, and 4) pathologically or clinically confirmed causes of acute ICH. Nonpathologically proved cases were confirmed by imaging follow-up (eg, complete disappearance of the hematoma without an underlying lesion on follow-up imaging in cases of primary ICH; vascular malformation confirmed on follow-up CTA, MRA, or conventional angiography in cases of secondary ICH with vascular malformation; and serial growing of the mass or enhancing tumor tissue on follow-up imaging in cases of secondary ICH with tumor). Patients with initial outpatient NECT images were included if they met the inclusion criteria and had images of adequate quality. To include clinically confusing patients only, we excluded patients with clinical or NECT imaging findings implicating certain underlying causes of ICH, either primary or secondary. Exclusion criteria consisted of intraventricular hemorrhage or SAH as a main component of intracranial hemorrhage (n = 39), traumatic ICH (n = 83), or hemorrhagic transformation of acute infarction (n = 12), and patients with definitive tumorous ICH with gross cystic or solid portions (n = 14) or multiple hemorrhagic lesions (n = 12).9,15 Additionally, we also excluded cases of uncertain-cause ICH in patients who were either not sufficiently followed up with imaging or whose condition was not pathologically proved and could not be retrospectively classified as tumorous or nontumorous ICH (n = 13). Patients with initial outpatient NECT images of inadequate image quality were also excluded (n = 6).

Flowchart of study population enrollment. IVH indicates intraventricular hemorrhage.
The study cohort of 110 patients was classified into 5 groups according to underlying causes and antithrombotic medication status: 1) primary ICH and not taking antithrombotics; 2) primary ICH with antithrombotic use within 3 months before the CT scan; 3) secondary ICH due to vascular malformation such as AVM, cavernous angioma, or dural arteriovenous fistula; 4) secondary ICH due to brain metastases; and 5) secondary ICH due to primary brain tumors.
These 5 groups were later combined and dichotomized into patients with nontumorous ICH (groups 1, 2, and 3) and patients with tumorous ICH (groups 4 and 5).
Image Acquisition and Analysis
Among the 110 patients, the CT scans of 67 were obtained in our hospital. CT examinations were performed with voltage from 100 to 120 kV and current from 130 to 250 mA. CT scans of the other 43 patients were performed at other hospitals, with voltage from 100 to 120 kV and current from 100 to 300 mA.
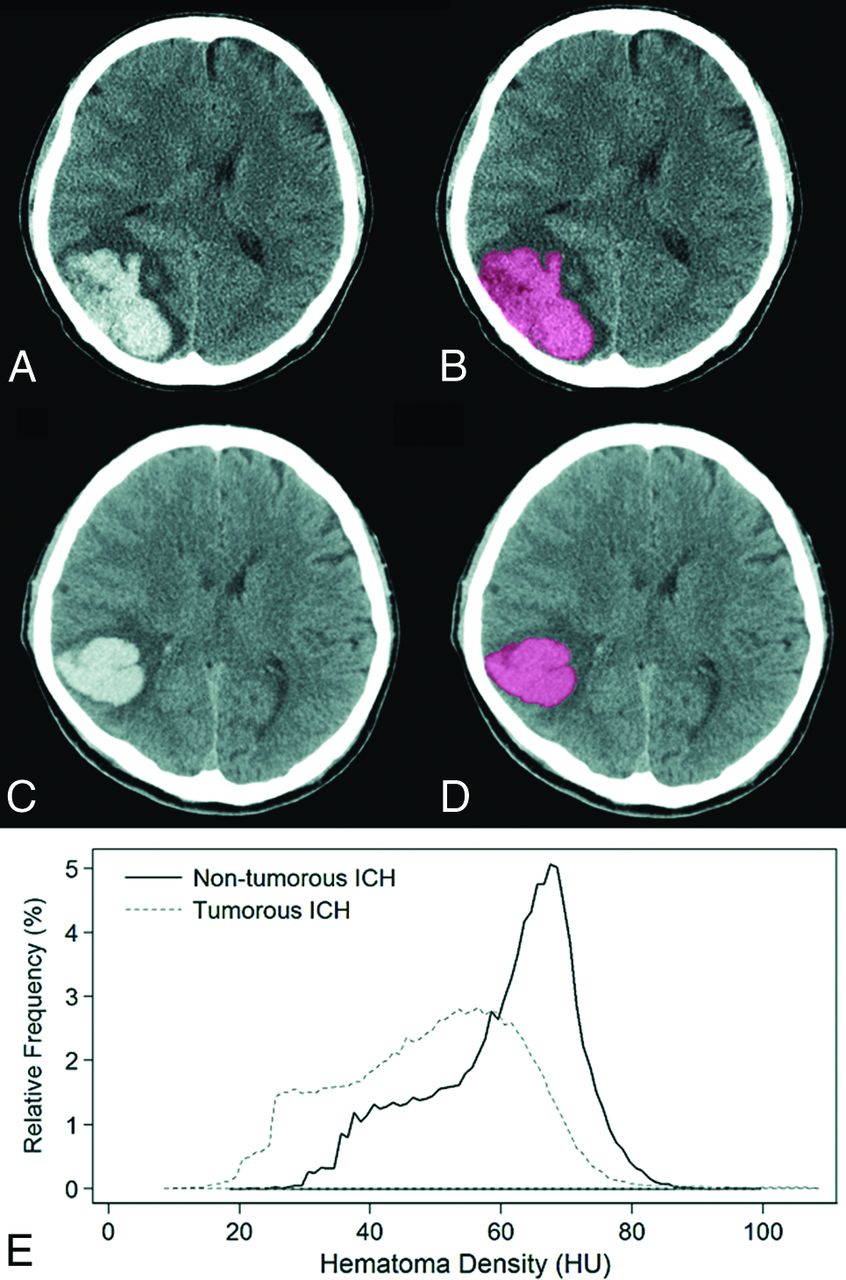
Image analysis was by consensus by 2 neuroradiologists (Y.S.C., with 6 years of experience in brain CT reading; and S.-K.L., with 24 years of experience in brain CT reading) who were blinded to the clinical information. An ROI was drawn on all NECT axial images containing the entire ICH volume by using a semiautomatic method, with thresholding of Hounsfield unit values as described elsewhere16 and depicted in Fig 2. For drawing ROIs, a lower limit of 25–40 HU and an upper limit of 130 HU were used as thresholds. For ICH adjacent to the skull, skull stripping was performed before drawing the ROI by masking pixels higher than 130 HU. Image analysis used the Medical Image Processing, Analysis, and Visualization software package (Version 7.0; National Institutes of Health, Bethesda, Maryland).

Representative cases of semiautomatic segmentation of tumorous (A and B) and nontumorous (C and D) ICHs and their relative frequency histogram of hematoma attenuation (E). ICH was segmented with a semiautomatic method based on a voxel-intensity threshold of 40–130 HU. On histogram analysis, the 5th and 25th percentile values were 26 HU and 38 HU in tumorous ICHs and 40 HU and 65 HU in nontumorous ICHs, respectively, and were discriminated correctly by using our histogram analysis.
Statistical Analysis
Demographic data were compared among the 5 groups by using 1-way analysis of variance for continuous data and a χ2 test for categoric data. Histogram parameters were extracted from Hounsfield unit values of ROIs, which were minimum, 5th, 25th, 50th, 75th, 95th percentiles, maximum values, skewness, and kurtosis. Histogram parameters were compared among the 5 groups by using 1-way analysis of variance with post hoc pair-wise comparison with Bonferroni correction of P values. To confirm the association between hematoma attenuation and time interval from symptom onset to CT scan, we used multivariate linear regression after adjusting for possible confounders, including age and sex.
Histogram parameters were compared by t test or nonparametric Wilcoxon rank sum test between tumorous and nontumorous ICHs after dichotomization of the study population according to the results of the Shapiro-Wilk test for normalized distribution.
Receiver operating characteristic analysis was performed to determine the optimal cutoff values for histogram parameters to discriminate tumorous and nontumorous ICHs. The optimal cutoff value was determined by maximizing the Youden index and calculating the area under the curve. All calculated P values were 2-sided, and results were considered significant if the P value was <.05. We performed statistical analysis with STATA 12.1 (StataCorp, College Station, Texas).
Results
Study Population
Demographic data of the study population are in Table 1. Among the 110 study patients (mean age, 53.4 years; range, 2.7–88.1 years), 64 had primary ICH and were classified in groups 1 or 2. Thirteen of 64 were classified as group 2, consisting of 6 patients taking warfarin, 5 taking aspirin, and 2 taking clopidogrel. Among 46 patients with secondary ICH, 26 were classified into group 3 with vascular malformation (AVM, n = 21; cavernous angioma, n = 2; and dural AVF, n = 3), 12 were classified into group 4 with brain metastasis (hepatocellular carcinoma, n = 7; lung cancer, n = 3; breast cancer, n = 1; thyroid cancer, n = 1), and 8 were classified into group 5 with primary brain tumors (glioblastoma, n = 6; anaplastic astrocytoma, n = 1; and ependymoma, n = 1). Eighty-two of 110 cases were nonpathologically confirmed by complete disappearance of the hematoma in cases of primary ICH (n = 57); follow-up by CTA, MRA, or conventional angiography in cases of secondary ICH with vascular malformation (n = 18); and serial growing of the mass or enhancing tumor on follow-up imaging in cases of secondary ICH with tumor (n = 7).
Demographic data of study population (n = 110)
Ages were significantly different among the 5 groups (P < .01), and patients in group 3 were significantly younger than those in the other 4 groups in post hoc pair-wise comparison. Sex and time interval from symptom onset to CT were not significantly different.
Histogram Analysis of ICH Attenuation
Comparisons of histogram parameters among the 5 groups are listed in Table 2 and Fig 3, and representative cases of histogram analysis in tumorous and nontumorous ICH are shown in Fig 2. No significant correlation was observed between histogram parameters and symptom onset–CT time interval within 24 hours. In histogram analysis of ICH attenuation, group 1 was significantly higher than group 4 with brain metastasis and group 5 with primary brain tumor in the 5th, 25th, 50th, and 75th percentile values. Group 1 was also significantly higher than group 4 in the 95th percentile value. For primary ICH, group 2, with patients taking antithrombotic medication, was significantly lower than group 1 for the minimum and 5th percentile values. Five of 13 patients of group 2 showed blood-fluid levels within the ICH, and all 5 of these patients were on warfarin. Group 3, with patients with vascular malformations, was significantly higher than groups 4 and 5 for 5th percentile values and was higher than group 5 for 25th and 50th percentile values. Maximum values were not significantly different among the 5 groups. Group 5 showed significantly higher kurtosis than groups 1 and 3. Groups 1, 2, and 3 showed negative skewness, and groups 4 and 5 showed positive skewness with significant differences.
Differences in histogram parameters for ICH attenuation among the 5 groups

Differences among the 5 groups in histogram parameters of ICH attenuation are list on the x-axis of each boxplot: 1) primary ICH without antithrombotics, 2) primary ICH with antithrombotics, 3) secondary ICH due to vascular malformation, 4) secondary ICH due to brain metastasis, and 5) secondary ICH due to primary brain tumor.
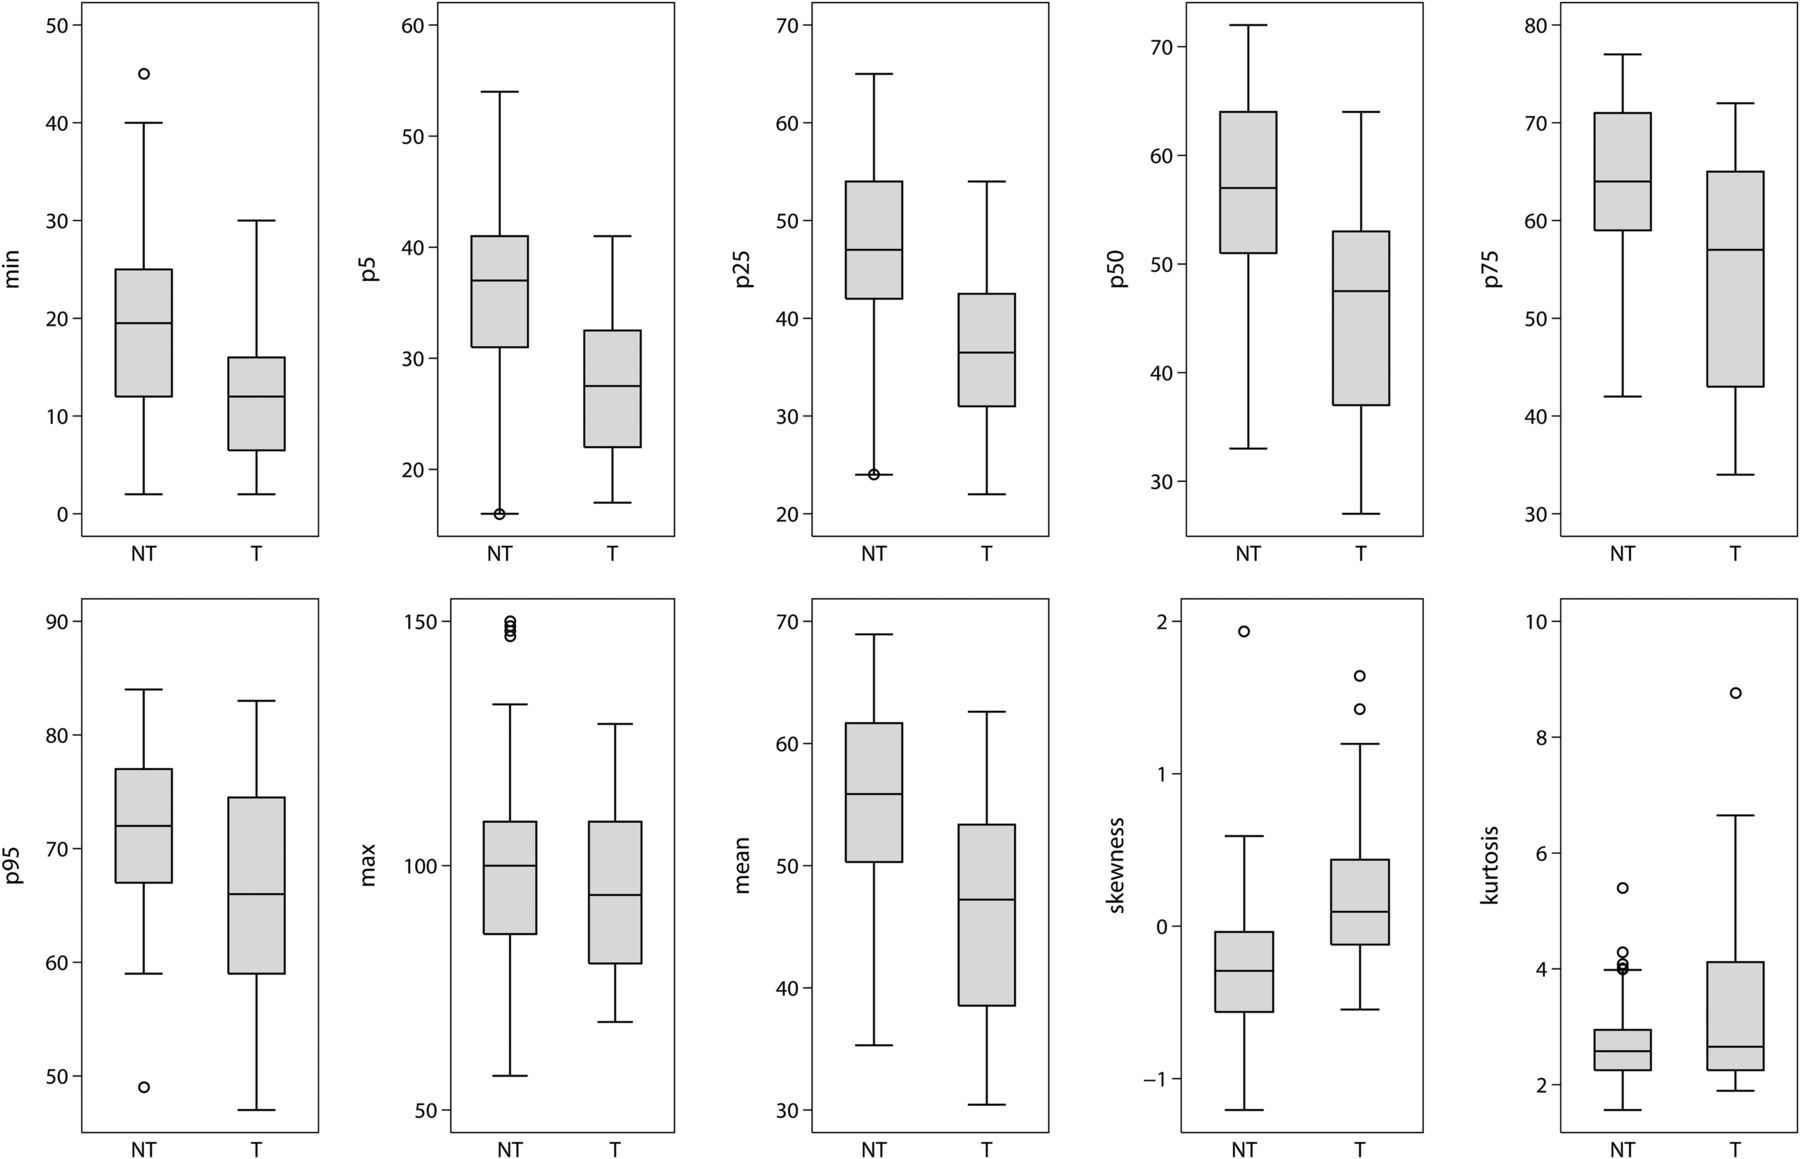
After dichotomization into tumorous and nontumorous ICHs, all histogram parameters except maximum value and kurtosis were significantly different between tumorous and nontumorous ICHs (Fig 4). Tumorous ICH had lower cumulative histogram parameters and was positively skewed.

Differences in histogram parameters of ICH attenuation in tumor and nontumorous ICHs. All histogram parameters except maximum value and kurtosis were significantly different between tumorous and nontumorous ICHs. Tumors had lower cumulative histogram parameters and positive skewness. NT indicates nontumorous ICHs; T, tumorous ICHs.
Receiver Operating Characteristic Analysis
In receiver operating characteristic analysis (Table 3), all presumptive parameters distinguishing tumorous and nontumorous ICHs showed good diagnostic performance with area under the curve values above 0.7 (Fig 5). The 5th and 25th percentile values showed the highest diagnostic performance with area under the curve values of 0.81 and optimal cutoff values at 34 HU and 44 HU, respectively, with 65.6% sensitivity and 85.0% specificity for the 5th percentile value and 70.0% sensitivity and 80.0% specificity for the 25th percentile value. The receiver operating characteristic curve of 5th and 25th percentile values showed no significant differences after adjusting for symptom onset to CT time interval, with age and sex as covariates.
Diagnostic performance of ICH attenuation histogram parameters for discriminating tumor and nontumorous ICHs

Receiver operating characteristic curves of histogram parameters for discrimination of tumor and nontumorous ICHs.
Discussion
For acute ICH, we investigated the ability of CT densitometry to discriminate between tumors and nontumorous causes of ICH. With NECT only, tumorous and nontumorous ICHs were differentiated with good diagnostic performance by using histogram analysis of acute ICH attenuation. Among the examined histogram parameters, the 25th and 5th percentile values had excellent diagnostic value with area under the curve values above 0.8. The study population was confined to patients with lobar ICH, in whom secondary ICH is relatively frequent and primary lobar ICH is not negligible, accounting for 15%–25% of hypertensive spontaneous ICH,1,17 making determining a treatment strategy difficult.
Maximum value, unlike the other parameters, was not significantly different among the 5 groups and had poor diagnostic value. This result was because we set an upper limit of 130 HU for thresholding to draw an ROI; maximum values were fixed at 130 HU in case of hematomas adjacent to the skull causing partial volume artifacts. However, these pixels with partial volume artifacts account for a relatively small portion of the hematoma, so the other histogram parameters minimized this problem. Groups showing high attenuation by cumulative histogram parameters, such as groups 1 and 3, showed relatively lower kurtosis. This result might be because highly attenuated acute hematoma had considerable interspersed low-attenuated voxels that were counted on voxelwise histogram analysis. In this context, the higher kurtosis with wider variance seen for group 5 might be attributable to a higher but variable proportion of tumor tissue with lower attenuation within the hematoma. After dichotomization, a higher trend for kurtosis was observed for tumorous than for nontumorous ICH, though this result was not significant.
As shown in Fig 2, tumorous ICH showed a higher relative frequency of hematoma attenuation at lower Hounsfield unit values than nontumorous ICH, leading to positive skewness and relatively lower Hounsfield unit values of tumorous ICHs for all cumulative histogram parameters except the maximum value. One possible explanation for this trend is that a solid tumor lesion within the hematoma might be clustered at lower Hounsfield unit values, though solid tumor lesions are difficult to detect by visual inspection after excluding patients with definitive tumorous ICH with gross cystic and solid lesions. Our receiver operating characteristic analysis showed the 5th and 25th percentile values to be the best parameters for differentiating the attenuation of hematomas between tumorous and nontumorous ICHs. We propose that histogram analysis is a useful tool for detecting hidden solid tumor lesions within acute ICH, which might be helpful in establishing appropriate imaging follow-up and avoiding delays in long-term management of tumorous ICHs. Vascular malformation, another common cause of secondary ICH,6,7 showed relatively higher attenuation, similar to that of primary ICH, and thus could be discriminated from tumorous ICH. One explanation for this result is that rupture of abnormal vessels is the main pathophysiology of acute bleeding. Therefore, as in primary ICH, a solid lesion occupies a smaller proportion in vascular malformations than in tumors.
In the primary ICH group composed of groups 1 and 2, hematoma attenuation was lower in group 2 with antithrombotics, though this result was significant only for the minimum and 5th percentile values. Five of 13 patients with antithrombotic medication showed blood-fluid levels in our study, and all 5 were on anticoagulants (warfarin). Lower attenuation at minimum and 5th percentile values might be because of this fluid-blood interface, which has been reported to result from uncondensed blood and can be seen in acute ICH of patients treated with anticoagulants within the first 12 hours.18,19 The lower and heterogeneous attenuation of primary ICH in patients treated with antithrombotics made differentiating primary ICH from tumorous ICH difficult. Therefore, clinicians should consider the possibility of misdiagnosis when examining acute ICH in patients with antithrombotic medication. In patients treated with anticoagulants, the fluid-blood interface uniquely seen in these patients might be helpful in diagnosis.
In routine clinical settings, prognosis and management of secondary ICH depend on the underlying etiology of ICH, while those of primary ICH depend on hematoma growth, initial ICH volume, and expansion into the ventricles.20 Contrast-enhanced CT or MR imaging is performed when secondary ICH, especially tumorous ICH, is suspected. NECT is often undertaken serially to confirm resolution of primary ICH. However, high attenuation on CT and varying T1 intensity on MR imaging for acute hematoma can mask enhancing lesions of ICH on CT and MR imaging.11,12 Previous studies13,14 showed that dual-energy CT improves detection of enhancement within highly attenuated hemorrhage, but dual-energy CT or even single-energy contrast-enhanced CT and MR imaging are not always used as the initial imaging technique in patients with acute ICH. Serial follow-up with NECT takes time to confirm complete ICH resolution and might cause diagnostic delay. Being suspicious of tumor bleeding before complete ICH resolution might be helpful in determining appropriate imaging follow-up strategies and avoiding delays in long-term management of tumorous ICH, though acute management would not differ. In this context, our study has value in that NECT is a standard technique initially performed on patients with acute ICH in routine clinical settings. To our knowledge, this is the first study investigating the use of NECT for discriminating tumorous and nontumorous ICHs by using CT densitometry.
This study had several limitations. First, the CT protocols were heterogeneous because we included CT scans obtained at other hospitals in the study population. The voltage used in CT scans obtained at other hospitals was similar to that used for CT at our hospital, which was from 100 to 120 kV. The heterogeneous CT protocols probably did not affect our results because attenuation of a lesion changes depending on the voltage used in CT, and attenuation of the lesions would be similar if the voltages used in CT are similar. In addition, attenuation of solid lesions and hemorrhage does not change substantially as voltage increases, in contrast to the attenuation of iodine and calcification.13 A second limitation was that the ROIs in our study were subjectively drawn and could be regarded as cumbersome. However, semiautomatic methods of Hounsfield unit value thresholding has been used in previous studies16,21 and partially mitigated this limitation. In our experience, it took, on average, 8–10 minutes for an experienced neuroradiologist to segment and analyze a hematoma. Third, only a small number of patients with tumorous ICHs (groups 4 and 5) were included. In addition, the heterogeneity of primary malignancies in group 4 (secondary ICH with brain metastasis) is related to the heterogeneous cellularity of brain metastasis. Hence, it is likely for hypercellular brain metastasis to cause less low attenuation in hematomas and false-negatives in the histogram analysis we proposed. This small number and heterogeneity of patients resulted from the strict exclusion criteria, including multiple hemorrhagic lesions, gross solid or cystic lesions, and the initial CT scan obtained >24 hours after symptom onset because we tried to include clinically confusing cases only. Nonetheless, the strict exclusion criteria can also be a limitation of our study because this study does not reflect the unselected patients who present with acute ICH in the emergency department. Fourth, the number of patients taking antithrombotic medications was relatively small, confined to the primary ICH group. Subsequently, the effect of antithrombotic medication was not fully stratified in all groups. This grouping was because all patients with secondary ICH taking antithrombotic medication were excluded due to other exclusion criteria. Nonetheless, patients taking antithrombotic medication tended to have lower attenuation in acute primary ICH in our study. If this is the case for tumorous ICH, attenuation of tumor ICH with antithrombotic medication would be more likely opposite of expectations for primary ICH; thus, antithrombotic medication would not affect the diagnostic performance of CT densitometry. However, the subgroup of patients taking antithrombotic medications included patients with both antiplatelets and anticoagulants, which also can be a limitation of our study. Patients treated with anticoagulants are more prone to have unclotted components in their hematomas, which might have contributed more to the lower hematoma attenuation, than patients taking antiplatelets.22,23 Fifth, no validation has been performed in this study, which needs further investigation.
Conclusions
We investigated the diagnostic value of CT densitometry for discriminating tumors and nontumorous causes of acute ICH. Histogram parameters for acute ICH attenuation were significantly different for tumorous and nontumorous ICHs. The 5th and 25th percentile values showed the highest diagnostic performance, with area under the curve values above 0.8, sensitivities of 65.6% and 70.0%, and specificities of 85.0% and 80.0%, respectively. CT densitometry of acute ICH on NECT was a useful tool for discriminating tumorous and nontumorous ICH in patients with acute ICHs of unclear origin.
Indicates open access to non-subscribers at www.ajnr.org
REFERENCES
- Received September 5, 2014.
- Accepted after revision November 9, 2014.
- © 2015 by American Journal of Neuroradiology


Jump to section
Related Articles
Cited By...
- No citing articles found.