
Abstract
BACKGROUND AND PURPOSE: T2-weighted FLAIR can be combined with 3D-FSE sequences with isotropic voxels, yielding higher signal-to-noise ratio than 2D-FLAIR. Our aim was to explore whether a T2-weighted FLAIR–volume isotropic turbo spin-echo acquisition sequence (FLAIR-VISTA) with fat suppression shows areas of abnormal brain T2 hyperintensities with better conspicuity in children than a single 2D-FLAIR sequence.
MATERIALS AND METHODS: One week after a joint training session with 20 3T MR imaging examinations (8 under sedation), 3 radiologists independently evaluated the presence and conspicuity of abnormal areas of T2 hyperintensities of the brain in FLAIR-VISTA with fat suppression (sagittal source and axial and coronal reformatted images) and in axial 2D-FLAIR without fat suppression in a test set of 100 3T MR imaging examinations (34 under sedation) of patients 2–18 years of age performed for several clinical indications. Their agreement was measured with weighted κ statistics.
RESULTS: Agreement was “substantial” (mean, 0.61 for 3 observers; range, 0.49–0.69 for observer pairs) for the presence of abnormal T2 hyperintensities and “fair” (mean, 0.29; range, 0.23–0.38) for the comparative evaluation of lesion conspicuity. In 21 of 23 examinations in which the 3 radiologists agreed on the presence of abnormal T2 hyperintensities, FLAIR-VISTA with fat suppression images were judged to show hyperintensities with better conspicuity than 2D-FLAIR. In 2 cases, conspicuity was equal, and in no case was conspicuity better in 2D-FLAIR.
CONCLUSIONS: FLAIR-VISTA with fat suppression can replace the 2D-FLAIR sequence in brain MR imaging protocols for children.
ABBREVIATION:
- VISTA
- volume isotropic turbo spin-echo acquisition
3D (volume) gradient-echo T1-weighted sequences are a well-established part of brain MR imaging protocols due to the intrinsically higher SNR compared with 2D sequences and the ability to obtain optimal MPR.1 However, abnormalities of the brain are usually detected as nonspecific areas of variably increased signal in T2WI. FLAIR images are preferable to FSE images for detecting such T2 abnormalities because suppression of the CSF high signal results in an improved gray-scale dynamic range.2
T2-weighted FLAIR can be combined with 3D-FSE sequences with isotropic voxels that are variably named by different vendors, including volume isotropic turbo spin-echo acquisition (VISTA; Philips Healthcare, Best, the Netherlands), SPACE (sampling perfection with application-optimized contrasts by using different flip angle evolution; Siemens, Erlangen, Germany), Cube (GE Healthcare, Milwaukee, Wisconsin), isoFSE (http://www.hitachimed.com/products/mri/oasis/Neurological/isoFSE), and 3D mVox (Toshiba, Tokyo, Japan). Such T2-weighted FLAIR 3D-FSE sequences have a higher SNR than 2D-FLAIR, enable MPR, and are less affected by CSF flow artifacts,3⇓⇓–6 which are more prominent in sedated children at a higher field strength 3T magnet.7⇓–9
Theoretically, suppression of fat signal with spectral presaturation could improve the sensitivity of FLAIR-VISTA by further narrowing the gray-scale dynamic range.2
The purpose of the present study was to evaluate whether a FLAIR-VISTA sequence with fat suppression shows abnormal brain T2 signal hyperintensities with better conspicuity than a 2D-FLAIR sequence on a single axial plane in children.
Materials and Methods
This prospective study was approved by the Meyer Children's Hospital of Florence institutional review board. Parental informed consent was obtained before inclusion of each subject in the study.
Selection of the Case Material
One hundred twenty brain MR imaging examinations not affected by motion artifacts performed over a 6-month period at a children's hospital (Meyer Children's Hospital of Florence) constituted the basis for the present study. They were performed in subjects 2–18 years of age for a variety of clinical indications (Table 1). Children younger than 2 years of age were excluded because of incomplete WM myelination, which implies a relative hyperintensity of the normal WM and hinders the visual perception of abnormally increased T2 signal.10,11
Patient demographic characteristics, number of MRI examinations under sedation, and clinical indications in the training and test sets
From the 120 MR imaging examinations, a neuroradiologist with 30 years of experience in brain MR imaging (M.M.) randomly selected 20 cases for a training set and 100 further cases for a test set. Overall, 42 MR imaging examinations included in the training (n = 8) or test (n = 34) sets were performed with the patients under sedation obtained by breathing vaporized sevoflurane through a mask.
MR Imaging Examination
All the MR imaging examinations were performed on a 3T system (Achieva, Release 2.6.3.7; Philips Healthcare, Best, the Netherlands) equipped with an 8-channel phased array head coil according to the following protocol: after localizers, volume T1-weighted gradient-echo 1-mm-thick images on a sagittal plane (TR = 8.2 ms, TE = 3.8 ms, flip angle = 8°, FOV = 256 × 256 mm, matrix = 252 × 220, 155–175 sections, NEX = 1, duration = 7 minutes); FLAIR-VISTA with fat suppression 1-mm-thick images on the sagittal plane (TR = 8000 ms, TE = 355 ms, TI = 2400 ms, variable [10°–180°] flip angle, echo-train length = 110, FOV = 256 × 256 mm, matrix = 232 × 232, 155–175 sections, NEX = 1, sensitivity encoding factor = 3.0, fat suppression with spectral selection attenuated inversion recovery, duration = 5 minutes 28 seconds); 2D-FLAIR 4-mm-thick images on the axial plane parallel to the bicommissural line (TR = 11,000 ms, TE = 122 ms, TI = 2800 ms, flip angle = 90°, echo-train length = 31, FOV = 256 × 256 mm, matrix = 292 × 198, 36 sections, NEX = 2, sensitivity encoding factor = 2.2, duration = 4 minutes 30 seconds); T2-weighted FSE 3-mm-thick images on the coronal plane parallel to the main axis of the cerebral aqueduct (TR = 3000 ms, TE = 80 ms, echo-train length = 15, FOV = 250 × 190 mm, matrix = 312 × 231, 40 sections, NEX = 3, duration = 4 minutes); T2*-weighted gradient-echo 4-mm-thick images on the axial plane parallel to the bicommissural line (TR = 1068 ms, TE = 16 ms, flip angle = 18°, FOV = 250 × 202 mm, matrix = 244 × 194, 24 sections, NEX = 1, duration = 3 minutes). In 28 (7 training set; 21 test set) MR imaging examinations, the volume T1-weighted gradient-echo sequence was repeated after intravenous administration of gadolinium chelates.
Image Analyses
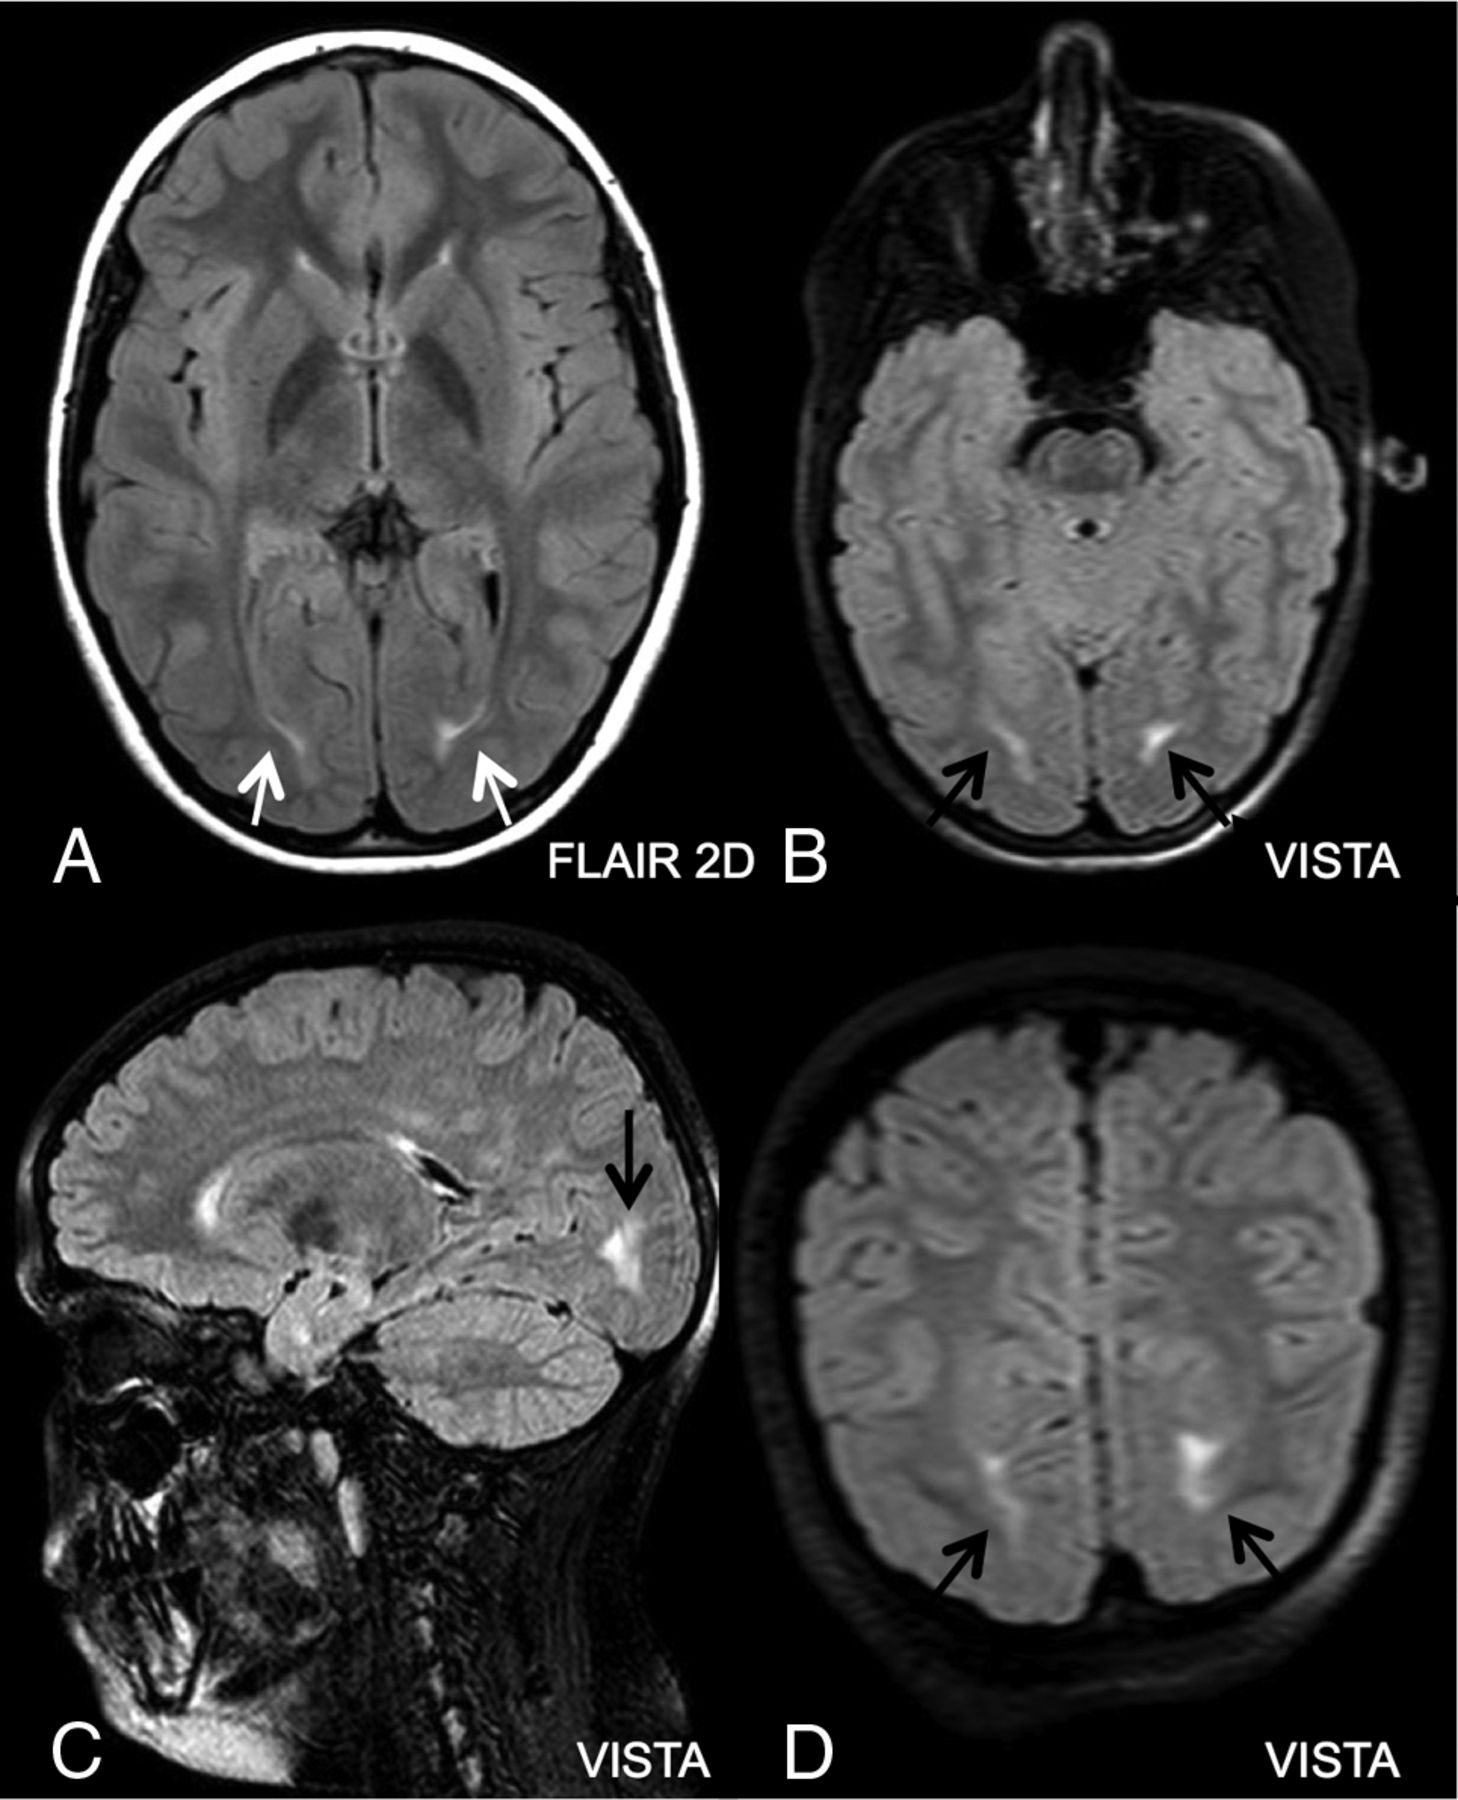
The expert neuroradiologist preliminarily evaluated the presence of CSF flow artifacts in the middle and posterior cranial fossa in a binary way (yes/no) on 2D-FLAIR and FLAIR-VISTA images. Three radiologists with at least 5 years of clinical experience in brain MR imaging in children (M.B., P.G., M.R.T.) were involved in image analyses. They had not previously evaluated the MR imaging examinations selected for the study. They participated in a joint session with the expert neuroradiologist on the 20 cases of the training set in which he illustrated the type of contrast in FLAIR-VISTA images with fat suppression on MR imaging examinations with normal and abnormal findings. In particular, he made them aware of the usually greater conspicuity in FLAIR-VISTA images with fat suppression of T2 hyperintense caps observed in the cerebral posterior periventricular WM corresponding to terminal zones of myelination (Fig 1).

T2 hyperintensity of the WM adjacent to the occipital horns of the lateral ventricles (arrows) in a 9-year-old girl referred for MR imaging for episodes of hypersomnia. This is often observed as an isolated finding in children with otherwise normal MR imaging examination and was indicated in the training session to represent a borderline or normal finding to the 3 observers and not to be marked as abnormal T2 hyperintensity.
Then the 3 observers separately assessed the 100 cases of the test set by using the hospital PACS. The shortest interval between the joint session and beginning of individual sessions was 1 week. Overall, the observers took a maximum of 1 month to complete individual readings of the 100 cases of the test set. They were blinded to the clinical indications for the MR imaging examinations and to the expert neuroradiologist's reports. In addition, most important, the observers were not informed of the study hypothesis, namely that FLAIR-VISTA could demonstrate brain lesions with more conspicuity compared with 2D-FLAIR. They had access to all source images obtained for each examination and to the 3-mm-thick images reconstructed on the axial (parallel to the bicommissural plane) and coronal planes (parallel to the brain stem) from both the source 1-mm-thick sagittal T1WI and FLAIR-VISTA with fat suppression images. No indication was given to the observers concerning the order or method of evaluation of the provided MR images. They were able to look at all images simultaneously on multiple panel monitors of a diagnostic workstation and were allowed to manipulate the image visualization by changing the gray-scale window width and level.
The observers were requested to perform 2 assessments: first, to judge in a binary way (yes/no) whether the FLAIR-VISTA or 2D-FLAIR demonstrated abnormal focal or diffuse T2 hyperintensities of the brain. If the observer identified such abnormalities in only 1 sequence, his or her judgment was considered negative for abnormal T2 hyperintensities. Second, in case they identified abnormal T2 hyperintensities on both sequences, they were to evaluate in which sequence the areas of signal changes were shown with better conspicuity or whether the conspicuity was equal.
Statistical Analyses
Possible differences between the training and test sets were assessed with the Student t test for parametric variables and with the χ2 test for categoric variables. Statistical significance was set at P < .05. The interobserver agreement concerning the presence and conspicuity of abnormal T2 hyperintensities in the test set was evaluated by the linear-weighted Cohen κ statistic, which measures agreement beyond chance.12 Cohen κ coefficient values are categorized into 5 levels of agreement: slight (0–0.2), fair (0.21–0.4), moderate (0.41–0.6), substantial (0.61–0.8), and almost perfect (0.81–1.0). We considered agreement of pairs of observers (A versus B, A versus C, and B versus C) and the overall mean of the results of the 3 pairs.
In particular, we first measured the agreement of the 3 observers in the entire 100 MR imaging examinations of the test set in judging the presence or lack of abnormal T2 hyperintensities. Then we measured the agreement in judging relative conspicuity of the abnormal T2 hyperintensities in the sample of MR imaging examinations in which all 3 observers recognized the presence of the abnormal T2 hyperintensities.
Results
The training set and test set were not significantly different for the patient demographic data, clinical indications, and number of MR imaging examinations of patients under sedation (Table 1). The expert neuroradiologist judged CSF flow artifacts to be present in 2D-FLAIR in 96 of 100 cases of the test set, but in FLAIR-VISTA, they were seen in only 2 cases. His assessment of 120 MR imaging examinations is summarized in Tables 2 and 3. In particular, he reported the presence of abnormal T2 hyperintensities in 66 of 100 examinations of the test set. In 5 patients of the test set who underwent an operation, pathologic diagnoses included type IB focal cortical dysplasia, type IIB focal cortical dysplasia, a cortical tuber in tuberous sclerosis, a primary neuroectodermal tumor, and recurrence of a dysembryoplastic neuroepithelial tumor.
Expert neuroradiologist's evaluation of the training set
Expert neuroradiologist's evaluation of the test set
Abnormal T2 hyperintensities of the brain were judged present in 61/100 FLAIR-VISTA images and 59/100 2D-FLAIR images by observer 1, in 71/100 FLAIR-VISTA images and 69/100 2D-FLAIR images by observer 2, and in 60/100 FLAIR-VISTA images and 62/100 2D-FLAIR images by observer 3.
Figure 2 shows the results of the visual assessment of the 100 MR imaging examinations of the test set by the 3 observers. Agreement about the presence or lack of abnormal T2 hyperintensities was achieved in 46 of 100 patients, whereas some disagreement occurred in 54 patients. In 23 patients, the radiologists all identified some abnormal brain T2 hyperintensities, and in 23, they all identified none. In 26 patients, 2 operators identified abnormal T2 hyperintensities, and one did not, and in 28, 1 operator only identified abnormal T2 hyperintensities.

Results of the visual assessment by the 3 observers of T2 hyperintensities in 100 MR imaging examinations.
Table 4 shows the results of the weighted κ statistics in the test set concerning agreement of the 3 observer pairs for the presence of abnormal T2 hyperintensities and for comparative evaluation of the conspicuity of these signal changes in FLAIR-VISTA with fat suppression and in 2D-FLAIR.
Weighted κ statistic assessment of the agreement of the 3 observers
The weighted κ statistics indicated that agreement for the presence of abnormal focal or diffuse T2 signal hyperintensities was “substantial” (mean, 0.61 for the 3 observers; range, 0.49–0.69 for the 3 observer pairs).
All 3 observers judged FLAIR-VISTA with fat suppression images as showing the abnormal T2 signal hyperintensities with better conspicuity than 2D-FLAIR in 21 of the 23 cases in which they identified abnormal T2 hyperintensities (Fig 3). The conspicuity was similar in 2 of 23 (Fig 4), and in no case was conspicuity better on 2D-FLAIR. The weighted κ statistics indicated that the 3 observers showed a “fair” (mean, 0.29; range, 0.23–0.38) agreement for the comparative evaluation of relative conspicuity of the abnormal T2 hyperintensities in the 23 cases.

Abnormal focal T2 hyperintensity (arrows) consistent with focal cortical dysplasia type II in the right fusiform gyrus of a 10-year-old boy with partial epilepsy. All 3 observers judged that the abnormal T2 hyperintensity was more conspicuous in FLAIR-VISTA (B–D) than in axial 2D-FLAIR (A).

Abnormal focal T2 hyperintensity corresponding to pathologically verified recurrence of dysembryoplastic neuroepithelial tumor in the left parietal-occipital region of a 10-year-old boy. Two observers judged that the abnormal T2 hyperintensity was more conspicuous in FLAIR-VISTA (B–D) than in axial 2D-FLAIR (A), whereas 1 observer judged that the conspicuity was similar.
Notably, in 21 of the 26 cases in which 2 observers identified abnormal focal T2 hyperintensities whereas the third operator did not, the abnormality was detected on VISTA-FLAIR but not on 2D-FLAIR (Fig 5).

Abnormal focal T2 hyperintensity consistent with mesial temporal sclerosis in both hippocampi of a 13-year-old boy with partial epilepsy, which followed an acute encephalopathy of undefined etiology. The abnormal focal hyperintensity was judged to be present (and more conspicuous on FLAIR-VISTA) by 2 observers, whereas 1 observer did not report it. Note the marked diffuse T2 hyperintensity of the thickened skull in 2D-FLAIR (A), which is not present on axial (B) and coronal (C) reformatted images of FLAIR-VISTA with fat suppression.
Discussion
Since its introduction in the early 1990s, the 2D-FLAIR sequence has been added to or replaced 2D T2-weighted spin-echo sequences for the detection of abnormal T2 hyperintensities of the brain tissue.2 Technologic developments, including multislab acquisition and variable flip angle radiofrequency excitation,13,14 have made 3D-FLAIR sequences compatible with clinical use. Accordingly, 3D-FLAIR has found wide application for MR imaging evaluation of the adult brain in healthy subjects and in patients with a variety of diseases or tumors.14⇓⇓–17 The lesser conspicuity of CSF flow artifacts in our study is in line with findings in previous reports.3⇓⇓–6 So far, few studies have compared the capability of 3D-FLAIR (4 without6,18⇓–20 and 2 with fat suppression21,22) and 2D-FLAIR in identifying areas of abnormal T2 hyperintensities of the brain.6,18⇓⇓⇓–22
Three of these studies compared the 2 sequences in revealing focal areas of abnormal T2 hyperintensities in the WM of adult patients with MS, and all concluded that 3D-FLAIR might replace 2D-FLAIR in clinical protocols for brain MR imaging of MS.19⇓–21 Instead, Kakeda et al6 compared the 2 sequences in adult patients with a variety of diseases and conditions. Also supported by the analysis of the contrast ratio between the signal intensity of the lesion and normal GM or WM, they confirmed the general superiority of 3D-FLAIR. However they reported that leptomeningeal metastases and hippocampal sclerosis were more conspicuous in 2D-FLAIR and that the “ivy sign” in Moyamoya disease (diffuse leptomeningeal T2 hyperintensity, presumably reflecting slowed flow in superficial vessels involved in collateral circulation phenomena) was frequently obscured in 3D-FLAIR. Finally, 2 studies addressed the relative contribution of 3D-FLAIR without18 or with22 fat suppression versus 2D-FLAIR in evaluating adults and children with specialized protocols for focal cortical dysplasia. The studies reported conflicting results because 3D-FLAIR was judged superior to 2D-FLAIR in one study18 and equal in the other study,22 at least on visual qualitative analysis.
Our study partially differs from the above studies in 3 main aspects. First, we focused exclusively on a population of pediatric patients referred to a children's hospital with heterogeneous clinical indications and MR imaging findings. Second, like Tschampa et al,22 we implemented a FLAIR-VISTA sequence with fat suppression. Third, we used FLAIR-VISTA as a supplement to a general protocol and not to a specialized one for epilepsy. The substantial agreement of our 3 observers for the presence of areas of abnormal T2 hyperintensities in FLAIR-VISTA and 2D-FLAIR appears reasonable when one considers the above heterogeneities and that the observers were blinded to the clinical indications of the MR imaging examination. The latter choice was made to decrease the variable influence that such knowledge might have on the observers' assessments.
Most areas of abnormal T2 hyperintensity in FLAIR sequences in our study were the focal nonspecific ones, commonly referred to as unidentified bright objects, which can have a number of underlying pathologic changes (microinfarct, gliosis, demyelination, and so forth).
In our opinion, the “fair” agreement of the 3 observers about the relative conspicuity of the abnormal T2 hyperintensities might reflect their having had no prior clinical experience with FLAIR-VISTA, whereas 2D-FLAIR has been part of the MR imaging brain protocol since the installation of the MR imaging system 7 years earlier.
Remarkably, in no case did the observers agree in judging the abnormal T2 hyperintensities more conspicuous on 2D-FLAIR than on FLAIR-VISTA. The possible partial discrepancy between our findings and those of Kakeda et al6 can be explained by our having no case of leptomeningeal metastases or Moyamoya disease. However in the single case of hippocampal sclerosis in our series, 2 of 3 observers judged abnormal T2 hyperintensity of the mesial temporal lobe to be present on FLAIR-VISTA but not on 2D-FLAIR. In our opinion, the fat suppression adopted in our study but not in that of Kakeda et al6 might have improved detection of this abnormality in our patients.
Notably, we compared a 3D-FLAIR sequence with sagittal source and axial and coronal reformatted images with a 2D-FLAIR sequence on a single axial plane. Although 2D-FLAIR images were obtained on the axial and coronal planes in a study comparing 3D-FLAIR and 2D-FLAIR in patients with focal cortical dysplasia,22 this procedure entails a proportional increase of the acquisition time of the 2D sequence that definitely overcomes the small (18%) increase in the acquisition time of FLAIR-VISTA compared with a single 2D-FLAIR in our study.
We recognize the following limitations of our study: First, we compared FLAIR-VISTA with fat suppression with 2D-FLAIR without fat suppression. Although spectral presaturation of fat is also possible with 2D (spin-warp) acquisition schemes, these are more demanding for the magnet hardware compared with 3D acquisition schemes and imply an increase of sequence duration and generally entail a worse result in terms of homogeneity of fat suppression. Second, we compared visual assessment of FLAIR-VISTA and 2D-FLAIR, which is affected by the observer's experience and other variables, including room light and the observer's fatigue, which can compromise the interobserver reproducibility. Moreover, aiming to reproduce the conditions of current clinical work, observers had simultaneous access to the 2 types of images they were requested to evaluate for the presence and relative conspicuity of areas of abnormal T2 hyperintensities. Admittedly, after training, they could easily recognize the FLAIR-VISTA and the 2D-FLAIR images they were observing. These factors may have introduced biases that a different, more experimental, study setup could have overcome. Third, we focused on detection and comparative evaluation of FLAIR-VISTA with fat suppression and 2D-FLAIR for areas of abnormally increased T2 signal of the brain, whereas we skipped the evaluation of areas of abnormally decreased T2 signal of the brain and of leptomeningeal (extra-axial) lesions.
Conclusions
FLAIR-VISTA with fat suppression shows abnormal T2 signal hyperintensities of brain gray and white matter with better conspicuity than the 2D-FLAIR sequence without fat suppression on a single axial plane in subjects 2–18 years of age examined for a variety of indications.
References
- Received February 12, 2016.
- Accepted after revision July 4, 2016.
- © 2016 by American Journal of Neuroradiology


Jump to section
Related Articles
Cited By...
- No citing articles found.