
Abstract
BACKGROUND AND PURPOSE: Very preterm infants (birth weight, <1500 g) are at increased risk of cognitive and motor impairment, including cerebral palsy. These adverse neurodevelopmental outcomes are associated with white matter abnormalities on MR imaging at term-equivalent age. Cerebral palsy has been predicted by analysis of spontaneous movements in the infant termed “General Movement Assessment.” The goal of this study was to determine the utility of General Movement Assessment in predicting adverse cognitive, language, and motor outcomes in very preterm infants and to identify brain imaging markers associated with both adverse outcomes and aberrant general movements.
MATERIALS AND METHODS: In this prospective study of 47 preterm infants of 24–30 weeks' gestation, brain MR imaging was performed at term-equivalent age. Infants underwent T1- and T2-weighted imaging for volumetric analysis and DTI. General movements were assessed at 10–15 weeks' postterm age, and neurodevelopmental outcomes were evaluated at 2 years by using the Bayley Scales of Infant and Toddler Development III.
RESULTS: Nine infants had aberrant general movements and were more likely to have adverse neurodevelopmental outcomes, compared with infants with normal movements. In infants with aberrant movements, Tract-Based Spatial Statistics analysis identified significantly lower fractional anisotropy in widespread white matter tracts, including the corpus callosum, inferior longitudinal and fronto-occipital fasciculi, internal capsule, and optic radiation. The subset of infants having both aberrant movements and abnormal neurodevelopmental outcomes in cognitive, language, and motor skills had significantly lower fractional anisotropy in specific brain regions.
CONCLUSIONS: Aberrant general movements at 10–15 weeks' postterm are associated with adverse neurodevelopmental outcomes and specific white matter microstructure abnormalities for cognitive, language, and motor delays.
ABBREVIATIONS:
- BSID-III
- Bayley Scales of Infant and Toddler Development, 3rd ed
- FA
- fractional anisotropy
- FM
- fidgety movements
- TBSS
- Tract-Based Spatial Statistics
Advances in maternal-fetal medicine and neonatology during the past 35 years have resulted in a substantial increase in survival of infants born with birth weights of <1500 g. With this increased survival, the risks for major motor, cognitive, and sensory disabilities have remained high.1 In fact, rates of cerebral palsy and visual, auditory, and intellectual disability increase with decreasing gestational age, as do rates of language, coordination, and executive function disorders.1 Accurate diagnosis of these abnormal neurodevelopmental outcomes currently requires long-term follow-up. For example, cerebral palsy is not confidently diagnosed until 18 months to 2 years postconceptional age. Language and cognitive delays require even more prolonged follow-up for accurate diagnosis. Accordingly, tools to predict abnormal neurodevelopmental outcomes earlier than 18 months of age would enable interventions to be targeted sooner, during times of greater brain plasticity, when a greater impact of intervention may be seen.
Abnormal neurodevelopmental outcomes have been predicted between 10 and 15 weeks' postterm age by using General Movement Assessment.2 General movements are a developmentally regulated pattern of spontaneous motor activity, appearing in the embryo by 9 weeks' postconceptional age. By 50–55 weeks' postconceptional age (10–15 weeks' postterm), the predominant general movements seen are termed fidgety movements (FM), a pattern of continuous, small-amplitude movements of the neck, trunk, and limbs during wakefulness, which disappear with agitation. Most important, absence of these FM at 10–15 weeks' postterm accurately predicts the development of cerebral palsy.3 Where in the brain FM arise and how they are generated remain unclear. However, the absence of FM in infants with periventricular lesions of the corona radiata or internal capsule4 suggests that projections between the cortex and spinal cord may contribute to these movements. The use of General Movement Assessment to detect neurodevelopmental impairment other than cerebral palsy has been limited.
We hypothesized that the brains of very preterm (<1500 g) infants with aberrant FM differ structurally from those in infants with normal FM and that these infants are more likely to have abnormal neurodevelopmental outcomes than infants with normal movements. Accordingly, in this prospective study, we identified structural differences at term-equivalent age in the brains of infants who subsequently exhibited aberrant FM compared with those who did not. Second, we determined the extent to which aberrant FM and identified brain imaging differences were associated with abnormal neurodevelopmental outcomes in motor, cognitive, and language skills.
Materials and Methods
Participants
Infants born at ≤31 weeks' gestational age with a birth weight of ≤1500 g who required oxygen at birth were recruited prospectively between July 2011 and March 2013 from the University of Chicago Comer Children's Hospital neonatal intensive care unit. Infants with congenital malformations, genetic syndromes, or respiratory distress severe enough that they were not expected to live (oxygenation index, ≥20) were excluded from the study. Infants who required positive pressure ventilation at term-equivalent age at the time of MR imaging were not included in the study. Informed parental consent was obtained for each infant, and ethics approval for the study was granted by the institutional review board of the University of Chicago.
General Movement Assessment
Video recordings were made by using a standardized observation system, with the infant in a state of active wakefulness at 10–15 weeks' postterm age. Raters who were General Movement Assessment–certified and blinded to the imaging and outcome data classified the video recordings according to the Prechtl methodology.2 In this study, FM were classified as normal if present (intermittent or continual) and as aberrant if abnormal (exaggerated with respect to speed and amplitude), sporadic (interspersed with long pauses), or absent.2 Detailed methods are given in the On-line Appendix.
MR imaging was performed at term-equivalent age. Infants were fed an hour before the scan and gently restrained, without sedation, by using a MedVac immobilization bag (CFI Medical Solutions, Fenton, Michigan).5 MR imaging was performed on a 3T MR imaging scanner (Achieva; Philips Healthcare, Best, the Netherlands) by using a standard head 8-channel sensitivity encoding MR imaging coil array. Acquisition schema was as follows:
3D T1-Weighted Turbo Field Echo.
FOV, 192 × 144 × 124 mm; 1-mm isotropic spatial resolution; TI/TR/TE, 1100/8.0/2.9 ms; NEX, 1; turbo field echo factor, 144.
3D T2-Weighted, Turbo Spin-Echo.
Same geometry and resolution as above. TR/TE, 2500/264 ms; NEX, 1; TSE factor, 100.
MR Imaging Qualitative Scoring of White Matter Abnormalities
A pediatric neuroradiologist independently scored the scans and was blinded to neonatal morbidities and scores on other assessments, as previously reported.7 A standardized scoring system8 was used to grade gray and white matter pathology. The WM was scored on a scale from 1 to 3 for the following 5 areas: nature and extent of WM signal abnormality, periventricular white matter volume loss, thinning of the corpus callosum, ventricular dilation, and the presence of any cystic abnormalities. Scores of >1 on any scale were reported as abnormal. The WM pathology scores for the individual items were summed. Findings in infants with total scores of >6 were abnormal.
Measurement of Gray Matter, White Matter, and Cerebellar Volumes
Voxel-based morphometry analysis9 was used to investigate voxelwise regional differences in gray and white matter volume between studied cohorts of infants. Individual subject's T1- and T2-weighted images were segmented into gray matter, white matter, and CSF tissue classes by using iBEAT software (https://www.med.unc.edu/bric/ideagroup/free-softwares/libra-longitudinal-infant-brain-processing-package), designed for neonatal and infant brain segmentation.10,11 The automatic segmentation was followed by manual corrections and resulted gray and white matter masks that were used for voxel-based morphometry analysis, performed by using the FMRIB Software Library (FSL; www.fmrib.ox.ac.uk/fsl/). Study-specific gray and white matter templates were created. Individual subject's gray matter and white matter masks were registered to the templates. The quality of registration was confirmed by manual inspection. To avoid the effect of rapidly changing T1 and T2 contrast in neonates, we used gray and white matter masks for analysis instead of original scans. Registered images were modulated by the Jacobian warp field, thus reflecting local expansion or shrinkage of gray or white matter volumes relative to the registration target. Cerebella were manually segmented from individual subjects' T2-weighted images, and volumes were obtained by using ITK-SNAP (www.itksnap.org).
Measurement of White Matter Microstructure
The diffusion tensor imaging data were skull-stripped, and fractional anisotropy (FA) and mean and directional diffusivity maps were calculated by using the FMRIB Diffusion Toolbox (http://fsl.fmrib.ox.ac.uk/fsl/fslwiki/FDT). Voxelwise statistical analysis of the DTI data was performed by using Tract-Based Spatial Statistics (TBSS; http://fsl.fmrib.ox.ac.uk/fsl/fslwiki/TBSS) analysis as implemented in FSL.12 First, FA data were aligned into a common space by using nonlinear registration to the study-specific target image. The quality of registration was confirmed by manual inspection. Next, a mean FA skeleton was created, which represented the centers of all tracts common to the group. A threshold of FA ≥ 0.2 was applied to the mean FA skeleton. Each infant's aligned FA map was then projected onto this skeleton. Individual subject's mean and directional diffusivities maps were projected to the white matter skeleton by using transformations obtained for FA maps.
The relationships among FA, General Movement Assessment (normal versus aberrant), and Bayley Scales of Infant and Toddler Development, 3rd ed (BSID-III)13 scores were assessed by using general linear model analysis, by using parameters as described above for voxel-based morphometry, and gestational age at the time of scanning was entered as a covariate.
Assessment of Neurodevelopmental Outcomes
At 18–24 months' corrected age, Cognitive, Language, and Motor outcomes were assessed with the BSID-III subscales.13 The assessments were performed by 2 experienced testers, unaware of the brain MR imaging findings. Because the BSID-III scores significantly underestimate cognitive and language delay by approximately 11 points,14⇓–16 we designated infants with scores of ≤85 as having adverse neurodevelopmental outcomes.
Statistical Analysis
Continuous variables were summarized as mean (SD), and categoric variables were summarized as frequencies and percentages. Normality assumptions were assessed by using the Shapiro-Wilk test. A 2-sample t test or the Wilcoxon rank sum test was used to compare continuous variables, and the χ2 test or Fisher exact test was used to compare categoric variables between normal and aberrant FM groups. A logistic regression analysis was conducted to predict adverse neurodevelopmental outcome at 2 years by using FM assessments and FA values in selected white matter tracts.
The voxelwise relationships between FM (normal-versus-aberrant) and gray and white matter volumes on voxel-based morphometry analysis and between FM and FA on TBSS analysis were assessed by using general linear regression models. Gestational age at the time of scanning was entered as a covariate. All voxelwise statistical comparisons, including TBSS and voxel-based morphometry, were corrected for multiple comparisons by controlling the family-wise error rate, by using threshold-free cluster enhancement.17 P values < .05 were considered statistically significant.
A binary predictor was constructed from FA data in selected white matter tracts. The cutoff was determined from FA data from infants with normal neurodevelopmental outcomes, by using a threshold of 1 SD below the mean, and this cutoff was applied to FA data from all infants. ROIs (2 × 2 × 2 voxels) were selected in the splenium of the corpus callosum for Cognitive scores, in the superior longitudinal fasciculus for Language scores, and in the anterior limb of the internal capsule for Motor scores. Linear regression was performed between FA and BSID-III Cognitive scores to explore the correlation between these 2 parameters. The Pearson correlation coefficient was reported to quantify the direction and strength of the association. The sensitivity and specificity of FM and FA to predict the BSID-III were determined.
Results
MR images were inspected by a board-certified pediatric neuroradiologist for the presence of macroscopic injury and intraventricular hemorrhage (On-line Table 1). Of 60 infants enrolled, 6 were excluded due to poor image quality; additionally, 1 infant had severe posthemorrhagic ventricular dilation and was excluded due to inability to achieve satisfactory registration of brain images to the group templates. MR images of the remaining 53 infants were analyzed.
Of the 53 infants with MR imaging, 6 did not return for General Movement Assessment. Accordingly, 47 infants were analyzed (On-line Fig 1). Thirty-eight infants of these 47 (81%) had normal FM. Of the remaining 9, movements of 6 infants were classified as “sporadic”; 1, as “abnormal”; and 2, as “absent.” These 9 infants were classified as having aberrant FM. These infants had significantly lower mean gestational age and mean birth weight, compared with infants having normal FM (On-line Table 1). The odds of aberrant FM classification increased by 1.96 per week for every week's decrease in gestational age (95% CI, 1.15–3.35; P = .014) as determined by a univariate logistic regression model.
Infants with Aberrant Fidgety Movements Do Not Differ in Gray Matter and Cerebellar Volumes
Infants with normal FM did not differ from preterm infants with aberrant FM in total brain volume (normal: 319.2 ± 10.8 mL; aberrant: 310.4 ± 17.9 mL, P = .683), total gray matter (normal: 166.6 ± 7.3 mL; aberrant: 166.5 ± 12.4 mL, P = .993), or total white matter (normal: 136.7 ± 3.0 mL; aberrant: 128.9 ± 6.4 mL, P = .293). No significant regional differences were found between the normal and aberrant FM groups in either cortical or subcortical gray matter volumes on voxel-based morphometry analysis. Cerebellum volumes also did not differ between the groups (16.34 ± 0.95 mL versus 15.28 ± 1.46 mL, P = .550). When these measurements were normalized to total brain volumes, we also found no significant differences between normal and aberrant FM groups (gray matter: normal, 0.517 ± 0.005, versus aberrant, 0.53 ± 0.014; P = .301; white matter: normal, 0.434 ± 0.005, versus aberrant, 0.418 ± 0.013; P = .295; cerebellum: normal, 0.049 ± 0.0013, versus aberrant, 0.0483 ± 0.034; P = .89).
While the groups did not differ in overall white matter volumes, voxel-based morphometry using the white matter mask demonstrated a significant difference between normal and aberrant FM groups: The aberrant FM group had significantly smaller volumes in the splenium of the corpus callosum and right central frontal white matter (On-line Fig 2).
Infants with Aberrant Fidgety Movements Had a Higher Burden of White Matter Abnormalities
White matter abnormalities were first assessed by using a qualitative scoring system to determine the nature of these abnormalities (see “Materials and Methods”) and their distribution between groups (On-line Table 3). Infants with aberrant FM exhibited a significantly higher incidence of white matter signal abnormalities (56%) than infants with normal FM (18%, P = .035). In addition, there was a significantly higher incidence of an abnormal total white matter score in the aberrant FM group (56%) than in the normal FM group (13%, P = .014).
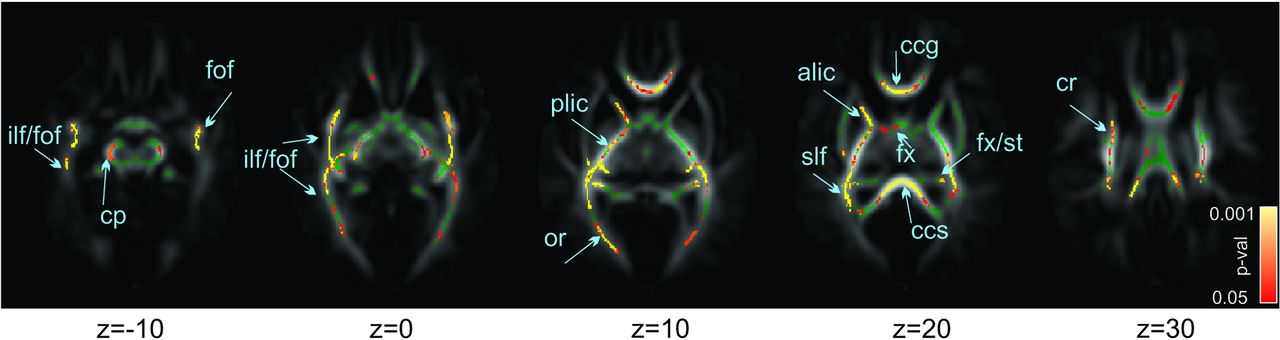
Differences in white matter microstructure were next assessed. Compared with the normal FM group, the aberrant FM group had significantly lower FA values in multiple regions: the corpus callosum genu and splenium, superior and inferior longitudinal and fronto-occipital fasciculi, anterior limb of the internal capsule, corona radiata, and optic radiations (Fig 1). Most surprising, in the posterior limb of the internal capsule, infants with aberrant FM had very few voxels with significantly decreased FA. Finally, there were no FA values in the aberrant FM group greater than those in the normal FM group. The aberrant FM group demonstrated significantly higher radial diffusivity compared with the normal FM group. There was no difference in either mean diffusivity or axial diffusivity.

Differences in white matter at term-equivalent age between infants with normal and aberrant fidgety movements at 10–15 weeks. Mean FA skeleton, in green, is overlaid on the mean FA map. Superimposed are pseudocolored voxels having significantly greater anisotropy in infants with normal than in infants with aberrant fidgety movements. Color bar shows the range of P values represented by the pseudocolors. Significantly higher regions of FA can be observed in the splenium (ccs) and genu (ccg) of the corpus callosum, inferior (ilf) and superior longitudinal fasciculus (slf), fronto-occipital fasciculus (fof), anterior (alic) and posterior (plic) internal capsule, corona radiata (cr), cerebellar peduncles (cp), and fornix/stria terminalis (fx/st). Z represents the MR imaging axial section coordinates (zero is the center of the anterior commissure).
Aberrant Fidgety Movements at 12 Weeks Are Associated with Adverse Neurodevelopmental Outcome at 2 Years
In the time between general movement and BSID-III assessments, 3 subjects were lost to follow-up and 1 infant died. None of the infants lost to follow-up had aberrant FM. Accordingly, 43 of the initial 47 infants (91%) were available for neurodevelopmental assessment at 2 years of age. Of the infants with normal FM, 35.1% were enrolled in early intervention programs, while 55.6% of the infants with aberrant FM were similarly enrolled. The mean age at BSID-III testing was 23.9 ± 0.6 months. Abnormal neurodevelopmental outcomes were defined by BSID-III scores being ≤85 for each subscale. There were 9 infants with adverse cognitive outcomes, 10 infants with adverse language outcomes, and 6 infants with adverse motor outcomes. Of infants with aberrant FM, 5 (62.5%) had adverse abnormal neurodevelopmental outcomes on at least 2 scales. In contrast, only 3 (8.8%) infants having normal FM demonstrated adverse abnormal neurodevelopmental outcomes on at least 2 scales.
Across all infants in our cohort, the mean subscale scores were the following: 99.77 ± 2.36 on the Cognitive subscale, 92.93 ± 1.51 on the Language subscale, and 98.47 ± 1.59 on the Motor subscale. Infants with normal FM scored significantly higher than infants with aberrant FM on the Cognitive subscore (101.0 ± 2.4 versus 89.4 ± 6.7, P = .019) and the Motor subscore (100.8 ± 1.6 versus 83.8 ± 5.6, P = .019). In addition, we observed a trend toward increased Language subscores in infants with normal FM compared with aberrant FM (93.7 ± 1.5 versus 85.9 ± 5.6, P = .07).
Infant classification into normal or aberrant FM was significantly associated with normal and adverse BSID-III outcomes, respectively, on each subscale (contingency table analysis with the Fisher exact test, On-line Table 2). Furthermore, univariate binary logistic regression analysis revealed that the presence of aberrant FM significantly increased the risk of adverse neurodevelopmental outcomes in each of the Cognitive (odds ratio, 10.5; 95% CI, 2.2–50.7; P = .003), Language (odds ratio, 6.27; 95% CI, 1.1–20.7; P = .04), and Motor subscales (odds ratio. 28.5; 95% CI, 4.2–191.2; P = .001).
Minimal Correlation between White Matter Microstructure at Term and Neurodevelopmental Outcomes at 2 Years
No voxels demonstrated a linear relationship between FA at term and any BSID-III subscale scores on the Tract-Based Spatial Statistics analysis (On-line Fig 3). We next compared children having normal or abnormal neurodevelopment. Infants with adverse cognitive outcomes had significantly lower FA values compared with healthy infants in the corpus callosum genu and splenium, superior and inferior longitudinal and fronto-occipital fasciculi, anterior limb of the internal capsule, and optic radiation (On-line Fig 4). There were no significant differences in FA between those who scored normally or adversely on the Language and Motor subscales of the BSID-III.
Predicting Neurodevelopmental Outcomes at 2 Years from General Movements and Neuroimaging
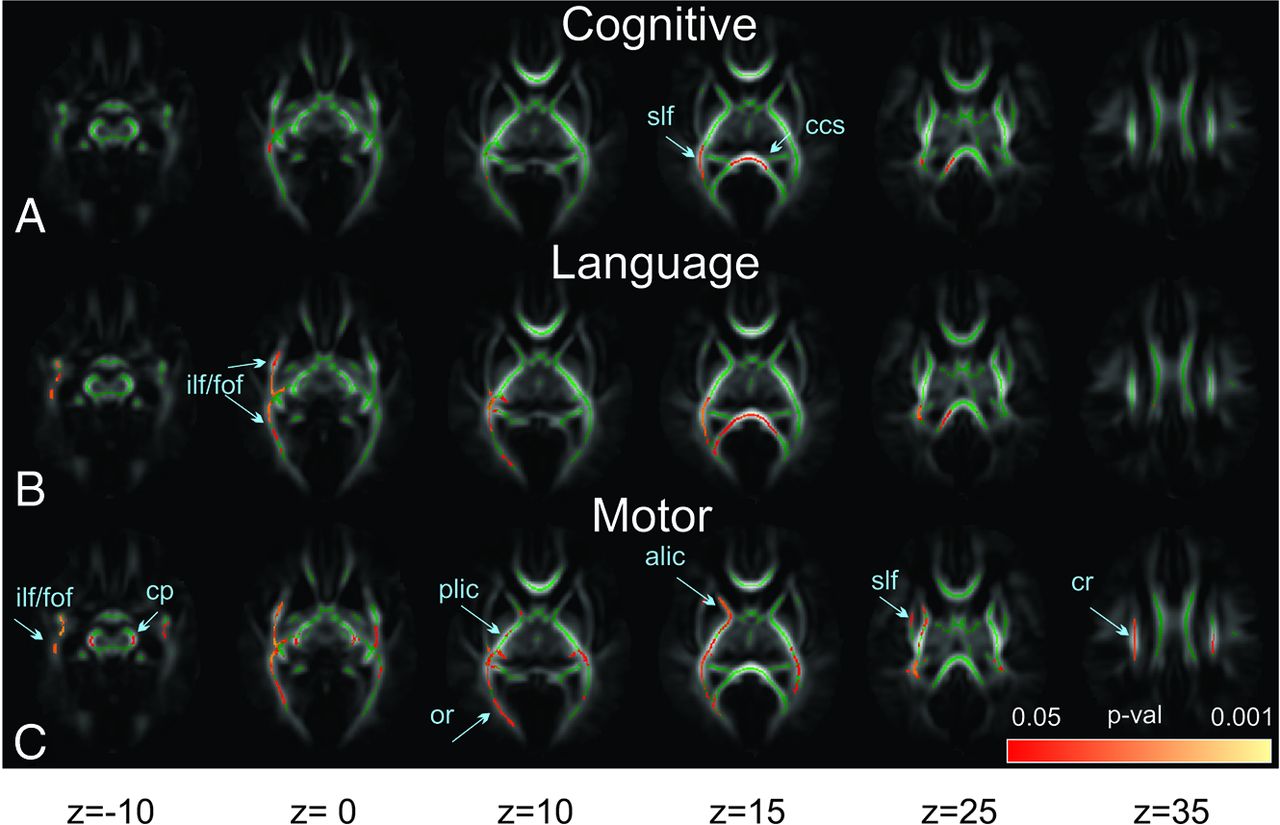
Because FA differences did not predict neurodevelopmental outcome, we tested whether general movements were a better predictor of neurodevelopmental outcomes. We determined the sensitivity and specificity of each FM and FA on the BSID-III subscales. A 2 × 2 contingency table was constructed by using normal/aberrant FM and normal/adverse neurodevelopmental outcome. To perform similar binary analyses for FA, we divided infants into low and high FA groups by using an unbiased approach as follows: We identified infants with aberrant FM and abnormal neurodevelopmental outcomes and defined them as having “doubly abnormal” outcomes. Similarly, we defined infants with normal FM and normal neurodevelopmental outcomes as having “doubly normal” outcomes. We then derived BSID-III subscale-specific Tract-Based Spatial Statistics maps by comparing the “doubly normal” and the “doubly abnormal” outcome infants (Fig 2). Using these maps, we identified the most statistically significant voxel and constructed an ROI around that voxel in a single white matter tract. The most significant voxel and associated ROI were in the splenium of the corpus callosum for Cognitive, superior longitudinal fasciculus for Language, and the posterior limb of the internal capsule for the Motor subscale. For each BSID-III subscale-specific region, the mean and SD of the FA in the selected region were computed for infants with normal neurodevelopmental outcome. Infants in the entire cohort whose FA fell within 1.5 SDs of the mean had “normal FA.” The remaining infants were assigned to the “low FA” group. For the FM and FA analyses, the specificities for adverse neurodevelopmental outcome ranged between 0.83 and 0.89 (On-line Table 2). In contrast, the sensitivities of either FM or FA in predicting adverse subscale-specific neurodevelopmental outcomes were much lower, ranging between 0.36 and 0.6 (On-line Table 2).

Differences in white matter between infants with “doubly normal” (normal fidgety movements and normal BSID-III scores) and “doubly abnormal” (aberrant fidgety movements and abnormal BSID-III scores) outcomes. The mean fractional anisotropy skeleton, in green, is overlaid on the mean fractional anisotropy map. Superimposed are pseudocolored voxels having significantly greater fractional anisotropy in “doubly normal” outcome infants than in infants with “doubly abnormal” assessments. The color bar shows the range of P values represented by the pseudocolors. Subscores on the BSID-III are divided into Cognitive (A), Language (B), and Motor (C) fractional anisotropy maps. Fiber tract labels are the same as in Fig 1.
We next tested whether combining General Movement Assessment with neuroimaging data improved prediction of neurodevelopment outcome. A bivariate binary logistic regression model was constructed by using BSID-III scores as a response variable and FM assessment and FA values in the selected WM tracts as predictors. This analysis failed to reveal a significant contribution of FA to the prediction of BSID-III scores in either the Cognitive, Language, or Motor subscales. These data indicate that FA does not provide data complementary to FM assessment.
Combining General Movement Assessment and Neurodevelopmental Outcomes to Identify Microstructure Differences in Specific Brain Regions
Having found that aberrant FM were associated with both abnormal microstructure and adverse neurodevelopmental outcomes, we asked whether “doubly abnormal” outcome infants had specific brain regions that differentiated them from “doubly normal” outcome infants. With respect to cognitive outcomes, “doubly abnormal” outcome infants had significantly lower FA, most strikingly in the corpus callosum and the inferior longitudinal fasciculus (Fig 2A). For language outcomes, “doubly abnormal” outcome infants exhibited significantly lower FA most strikingly in the corpus callosum, the inferior longitudinal fasciculus, and the fronto-occipital/inferior/superior longitudinal fasciculi (Fig 2B). In contrast, for motor outcomes, “doubly abnormal” outcome infants had significantly lower FA, most strikingly in the anterior and posterior limbs of internal capsule and cerebral peduncles, as well as in the optic radiation (Fig 2C) and the fronto-occipital/inferior/posterior longitudinal fasciculi. Notably, these infants did not have significant voxels in the corpus callosum (Fig 2C).
Approximately half of our infants with aberrant FM had normal neurodevelopmental outcomes. Accordingly, we sought to identify brain regions in these infants whose microstructure differentiated those with normal neurodevelopmental outcomes from those with abnormal outcomes. We compared FA in infants having aberrant FM and normal neurodevelopmental outcomes with those with aberrant FM and adverse neurodevelopmental outcomes. In the group of infants with adverse neurodevelopmental outcomes, we, in fact, observed significantly lower FA in the Motor and Cognitive subscales. Specifically, for motor outcomes, infants had decreased FA in the motor-associated cerebellar peduncles, the medial lemniscus in the brain stem, and the posterior limb of internal capsule (Fig 3, blue). For cognitive outcomes, infants with adverse neurodevelopmental outcomes had decreased FA in corpus callosum and the associative superior and inferior longitudinal and fronto-occipital fasciculi (Fig 3, red). No differences in FA were seen on the Language subscale. These findings demonstrate that abnormal microstructure in specific brain regions identifies those infants with aberrant FM who will have abnormal neurodevelopmental outcomes.

Differences in white matter in infants with aberrant fidgety movements between subpopulations with normal and adverse neurodevelopmental outcomes on the BSID-III. The mean fractional anisotropy skeleton, in green, is overlaid on the mean fractional anisotropy map. Superimposed are pseudocolored voxels having significantly greater fractional anisotropy in infants with normal than in those with adverse neurodevelopmental outcomes on Cognitive (in red-yellow) and Motor (in blue-light blue) BSID-III subscales. The color bar shows the range of P values represented by the pseudocolors. Fiber tract labels are the same as in Fig 1. Icp and mcp indicate inferior and middle cerebellar peduncles; ml, medial lemniscus.
Finally, in these children with aberrant FM, we sought to understand the impact of neurodevelopmental outcome in determining the association between FM and aberrant microstructure. Having found that in children with aberrant FM, those with adverse neurodevelopmental outcomes had significantly decreased FA compared with those with normal neurodevelopmental outcomes (Fig 2), we asked whether this latter group differed in FA from children with normal FM and normal neurodevelopmental outcomes. For cognitive outcomes, we analyzed FA in the splenium of the corpus callosum. For motor outcomes, we analyzed FA in the cerebellar peduncles. Most surprising, there was no difference in FA in either of these regions between these groups (Fig 4). The entire difference in FA, therefore, between normal and aberrant FM is driven solely by the group having abnormal neurodevelopmental cognitive and motor outcomes.

Mean fractional anisotropy in infants with normal and adverse neurologic outcomes. Boxplots represent the distribution of individual subject values in groups with normal fidgety movements and normal BSID-III scores, aberrant fidgety movements and normal BSID-III scores, and aberrant fidgety movements and adverse neurodevelopmental outcome as measured by BSID-III at 24 months of age. The cognitive subscale was measured in the splenium of the corpus callosum. The motor subscale was measured in the cerebellar peduncle. The asterisk indicates P < .05 on ANOVA, Tukey post hoc comparisons.
Discussion
In this prospective study, we found that preterm infants with aberrant FM at 10–15 weeks' postterm age demonstrated significantly decreased FA in multiple brain regions compared with infants with normal FM. Infants with aberrant FM were more likely to demonstrate abnormal motor, cognitive, and language outcomes at 2 years of age compared with infants with normal movement. However, among infants with aberrant FM, those with adverse neurodevelopmental outcomes could be differentiated from those with normal neurodevelopmental outcomes by differences in regional FA. In contrast to previous reports,18 we found no differences in gray matter and cerebellar volumes between groups.
Abnormal general movements have been previously associated with gross white matter abnormalities in preterm infants19 and in term infants having cerebral infarctions.20 In our population, despite finding a significant proportion of infants with aberrant FM, we observed no gross white or gray matter abnormalities, leading us to use functional and structural analyses on a voxelwise basis across the brain. Instead, we found reduced FA (due to increased radial diffusivity) in infants having aberrant FM in the corpus callosum and intrahemispheric tracts connecting the frontal, temporal, and occipital lobes. The widespread nature of this abnormality suggests that aberrant FM could arise from diffuse white matter injury. However, our infants with aberrant movements were born significantly more preterm than the rest of the cohort. While this earlier gestation raises the possibility that the presence of aberrant movement identifies less mature infants who are at increased risk for delayed white matter development, the association between aberrant movements and abnormal neurodevelopmental outcomes at 2 years of age suggests that aberrant movements even in these less mature infants confer a higher risk for abnormal outcomes.
Our dataset does not allow the identification of specific brain regions mediating FM. However, the observation that a cohort of infants totally blind from birth and without abnormalities on both brain imaging and serial neurologic examinations had delayed and exaggerated FM provides support for the role of visual pathways in the development of motor control.21 The widespread nature of the FA differences we observed suggests that FM may arise from connectivity among multiple brain regions, rather than a single central pattern generator, as previously hypothesized.4 Of note, we observed a greater burden of white matter injury in the aberrant FM group compared with the normal FM group on multiple imaging assessments: By qualitative analysis, infants with aberrant FM had an increased incidence of white matter signal abnormalities; by volumetric-based–morphometry, their corpus callosums were significantly thinner, and TBSS analysis showed a complex pattern of decreased FA. When we compared MR imaging from children with both abnormal neurodevelopmental outcomes and aberrant FM with scans from children with neither, we identified specific white matter tracts with decreased FA in subscale-specific regions: the internal capsule and corona radiata in children with poor motor performance and the corpus callosum in children with poor language or cognitive performance. This finding matches the association reported between increased mean diffusivity in the splenium of the corpus callosum with a low performance intelligence quotient in adults born preterm.22 Notably, we also observed decreased FA in the association fibers of the superior longitudinal fasciculus in children having decreased performance on any of the 3 subscales, suggesting that abnormalities in these regions presage subsequent global developmental impairment.
In this prospective study, the overall rate of cerebral palsy was low (2%) compared with the commonly reported cerebral palsy rate (3%–10%).23 To be eligible for MR imaging at term, neonates could require only low levels of respiratory support (nasal cannula oxygen), eliminating those with more severe respiratory disease and, hence, at increased risk for abnormal neurodevelopmental outcomes. Despite the lack of major motor dysfunction, our patients still had significant differences in neurodevelopmental outcomes and brain abnormalities. Given our study design and patient population, the size of the cohort studied was not unexpectedly small. This small size may have limited the power of our statistical tests to detect significant correlations between FA and neurodevelopmental outcomes. Furthermore, although such clinical factors as birth weight, chronic lung disease, necrotizing enterocolitis, and sepsis have been noted to increase the risk of abnormal neurodevelopmental outcomes, our study size precluded using these risk factors as statistical covariates.
In our study, the total number of infants with aberrant movements composed about 20% of the cohort. Consequently, we analyzed children with absent, sporadic, and abnormal FM as a single group and hypothesized that these infants would be at greater risk for cerebral palsy, as well as cognitive, language, and other motor disorders. Furthermore, a recent study of infants with cerebral palsy found that motor abilities did not differ between infants with sporadic or absent FM.24 Studies of long-term outcomes are needed to appreciate the neurodevelopmental implications of sporadic-versus-absent FM, because their underlying mechanisms of injury may be different. Future research directions will require detailed motor assessment and correlation with long-term gross, fine, and oral motor control and language, and adaptive competencies. General Movement Assessment in preterm infants has been shown to be an effective predictor of cerebral palsy.25⇓–27 However, because only 1 infant in our cohort had cerebral palsy, we focused on determining the ability of the General Movement Assessment to predict abnormal motor performance. Notably, we found aberrant FM to be significantly and separately associated with each of the abnormal motor, language, and cognitive outcomes. Similar associations have been reported between abnormal general movements at 3 months and poor motor and cognitive outcomes at 2 years of age.2,28
Conclusions
Our study emphasizes the importance of the neurobiologic substrate for aberrant FM and is an important contribution to understanding differing forms of cerebral development in early motor abilities and their developmental and adaptive correlates. Identifying specific forms of aberrant general movement with objective imaging correlates might be valuable in providing precise data on neurodevelopmental prognosis for preterm infants. The high specificity of aberrant General Movement Assessment suggests that infants at risk could be screened at 12 weeks of age. Those with aberrant FM might then benefit from MR imaging to improve prediction of adverse neurodevelopmental outcomes.
Acknowledgments
We thank Randi T. Vågen and Laila Kristoffersen for their help in preparing video recordings. We also thank the infants and their families for their participation.
Footnotes
J.D. Marks and A. Drobyshevsky are co-senior authors.
Disclosures: Colleen Peyton—RELATED: Grant: American Physical Therapy Section on Pediatrics,* Comments: provided salary recovery for Principal Investigator's protected research time. Christa Einspieler—UNRELATED: Employment: I am employed by the Medical University of Graz; Payment for Lectures (including service on Speakers Bureaus): General Movement Trust,* Comments: only reimbursement of travel and accommodation; Royalties: Mac Keith Press London; OTHER RELATIONSHIPS: I am a licensed tutor of the General Movement Trust, a method applied in this study. Any payment for teaching activities is received by the General Movement Trust and not by me personally. Michael D. Schreiber—RELATED: Grant: Gerber Foundation,* Ikaria*; Consulting Fee or Honorarium: Ikaria; Fees for Participation in Review Activities such as Data Monitoring Boards, Statistical Analysis, Endpoint Committees, and the Like: National Institutes of Health.* *Money paid to the institution.
This study was funded in part by the Gerber Foundation (M.D.S.); American Physical Therapy Association; Section of Pediatrics research grant (C.P.); the University of Chicago–NorthShore University Health System Collaborative Research Award (A.D. and M.D.S.); the Liaison Committee among the Central Norway Regional Health Authority and the Norwegian University of Science and Technology and the Department of Clinical Services, and Department of Pediatrics, Trondheim University Hospital, Trondheim, Norway (L.A., R.S., T.F.); and the T73 MC11047 HRSA–Department of Health and Human Services Leadership Education in Neurodevelopmental and Related Disorders Training Program (M.E.M.).
Indicates open access to non-subscribers at www.ajnr.org
References
- Received April 21, 2016.
- Accepted after revision July 20, 2016.
- © 2017 by American Journal of Neuroradiology


