
Abstract
BACKGROUND AND PURPOSE: Quantitative imaging biomarkers have not been established for the diagnosis of spinal canal stenosis. This work aimed to lay the groundwork to establish such biomarkers by leveraging the developments in machine learning and medical imaging informatics.
MATERIALS AND METHODS: Machine learning algorithms were trained to segment lumbar spinal canal areas on axial views and intervertebral discs on sagittal views of lumbar MRIs. These were used to measure spinal canal areas at each lumbar level (L1 through L5). Machine-generated delineations were compared with 2 sets of human-generated delineations to validate the proposed techniques. Then, we use these machine learning methods to delineate and measure lumbar spinal canal areas in a normative cohort and to analyze their variation with respect to age, sex, and height using a variable-intercept mixed model.
RESULTS: We established that machine-generated delineations are comparable with human-generated segmentations. Spinal canal areas as measured by machine are statistically significantly correlated with height (P < .05) but not with age or sex.
CONCLUSIONS: Our machine learning methodology demonstrates that this important anatomic structure can be accurately detected and quantitatively measured without human input in a manner comparable with that of human raters. Anatomic deviations measured against the normative model established here could be used to flag spinal stenosis in the future.
ABBREVIATIONS:
- CPT
- Current Procedural Terminology
- ERT
- ensemble of regression trees
- ICD-9
- International Classification of Diseases
- ML
- machine learning
- MRN
- medical record number
- SVM
- support vector machine
Spinal cord or nerve root compression due to narrowing of the spinal canal is thought to underlie the disorders of lumbar radiculopathy and myelopathy, both major causes of morbidity and disability1,2 in the United States. Patient screening includes radiologic evaluation of the central canal of the spine using MR imaging alongside labeling of stenosis as none, mild, moderate, or severe. These labels drive risky and often expensive treatment and surgical decisions. Yet, MR imaging–based labeling is known to be highly subjective and shows substantial interrater variability.3⇓–5 It is necessary to develop objective diagnostic and treatment criteria6 to improve treatment.
Canal stenosis by definition is a reduction in the area of the spinal canal. The percentage reduction in canal area compared with a demographically matched control signifies the degree of stenosis. Yet, computing the percentage reduction requires that one can consistently and accurately delineate spinal canals on MR imaging and that one has knowledge of the variation of canal areas in asymptomatic individuals over a wide demography. Our study presents work in both directions by proposing and validating a machine learning (ML) method to automatically delineate spinal canals on axial MR imaging using the validated ML method in conjunction with a large clinical data base to establish a variable-intercept mixed linear model of variation of spinal canal areas.
While computational methods to segment anatomic ROIs have been published in the literature7-10 and used to segment several regions in the spine,8,9,11-15 we focused on the spinal canal. We established an ML technique to delineate spinal canals on axial MR imaging and to measure their areas at lumbar levels. Subsequently, we established a linear model linking these areas to age, sex, and height using data from 1755 asymptomatic individuals.
The study was executed in 4 steps:
Creating a large data base of lumbar MRI studies.
Training and validating ML models for delineating canals and measuring their areas, using subsets of data extracted from the database and manually segmented by experts.
Using the ML models to measure canal areas in asymptomatic individuals with MRIs.
Using these measurements to establish a linear model linking lumbar spinal canal areas to age, sex, and height.
Many in the radiology community agree that there are numerous advantages of standardized reports,16 and this study aims to usher in a quantitative era for radiologic interpretation and reporting for lumbar spinal stenosis.
Materials and Methods
Institutional Review Board Statement
This study was conducted according to the rules and regulations of our institution and approved by the institutional review board (institutional review board No. 16–000196).
Data Collection for Machine Learning
We queried the PACS of our institution for individuals who had undergone any spine imaging using the corresponding Current Procedural Terminology (CPT)17 codes (On-line Table 1). This query yielded 39,295 unique medical record numbers (MRNs) and corresponding accession numbers. We extracted and anonymized the images corresponding to each accession number. The On-line Appendix presents further details of our data collection.
MR Imaging Sequences
Axial T2 MR imaging was used for canal segmentation. Resolutions in the axial plane varied between 0.27 × 0.27 mm per pixel to 1.5 × 1.5 mm. Resolutions were perpendicular to the axial plane and ranged between 1 and 10 mm. The mean resolution was 0.53 × 0.53 mm in the axial plane and 5.13 mm in the perpendicular direction. Corresponding SDs were 0.125 × 0.125 and 0.5 mm, respectively. The mean TRs and TEs varied as TR = 3756 ± 738 ms and TE = 107 ± 12 ms. Corresponding sagittal images used for disc segmentation had resolutions between 0.5 × 0.5 and 2 × 2 mm per pixel in the sagittal plane and 1–5 mm perpendicular to the sagittal plane.
Preprocessing
Preprocessing involved nonparametric bias correction, linear histogram matching to a common template, and intensity normalization to the 0–1 range for each 3D MR image. All scans were oriented into the frame of the template using linear image registration, and resampling was performed in the axial frame to fit each section to a 256 × 256 pixel frame.
Training Data Generation by Human Raters
A subset of 100 axial MR images was randomly chosen from the 39,295 for algorithmic training purposes and archived alongside corresponding sagittal MR images. Physicians segmented spinal canals and discs with the help of students. A student was first trained by an attending physician to identify spinal canal boundaries and delineate them using ITK-SNAP (www.itksnap.org).18 The student delineated canals on each section of the 100 axial MRIs and saved the segmentations as NIfTI files. The student also went through the 100 corresponding sagittal MRIs and segmented lumbar discs. The attending physician reviewed each section and corrected the student-generated delineations. The segmented spinal canal region was the area enclosed in the thecal sac, excluding ligaments and structures within the cavity. Segmenting the thecal sac within the spinal canal allows more distinct edges and defines a more clinically relevant area. These scans were used for training the models.
Validation Data Generation
The process of segmenting spinal canals on axial scans was repeated 2 more times on 109 axial images with different student-physician pairs, similar to the training data generation. These were selected by randomly sampling from the 39,000+ MRNs containing symptomatic and asymptomatic cases.
Training the Machine Learning Model for Segmentation of the Central Canal
We used a hybrid machine learning model to execute segmentation of central canals. In the first step, we detected a 25 × 25 pixel window containing the canal. An ensemble of support vector machine (SVM)-based object detection systems was trained using histogram-of-oriented gradient19 features and the hard-negative mining paradigm to “classify” whether a particular 25 × 25 pixel window contained a central canal. The SVMs used were linear SVMs with C = 10, 50, 100, 150, 250, 500, 1000. A window classified by ≥4 SVMs as the spinal canal was considered a “positive” detection. The image was cropped along this window and passed on to the second step of segmentation, which was executed using an ensemble of regression trees20 (ERT) shape-regression model. We used the ERT with ν = 0.05 and a tree depth set to 2 to predict 68 points, which form the contour of each spinal canal. Both steps were implemented using the DLib 1.8.0 software library (http://dlib.net/).
Disc Segmentation
A Deep-U-Net7 model (On-line Figure) was trained on the designated 100 sagittal MR images to segment discs and was implemented using the Keras API running on top of TensorFlow 1.3.0, A rectified linear unit was used for convolutional neurons throughout the architecture except for the final output layer, which used sigmoidal activation. We used a fixed learning rate (1e-5) and the Adam optimizer with drop-out (probability of .25) regularization. The loss function used was the negative of the Dice score.

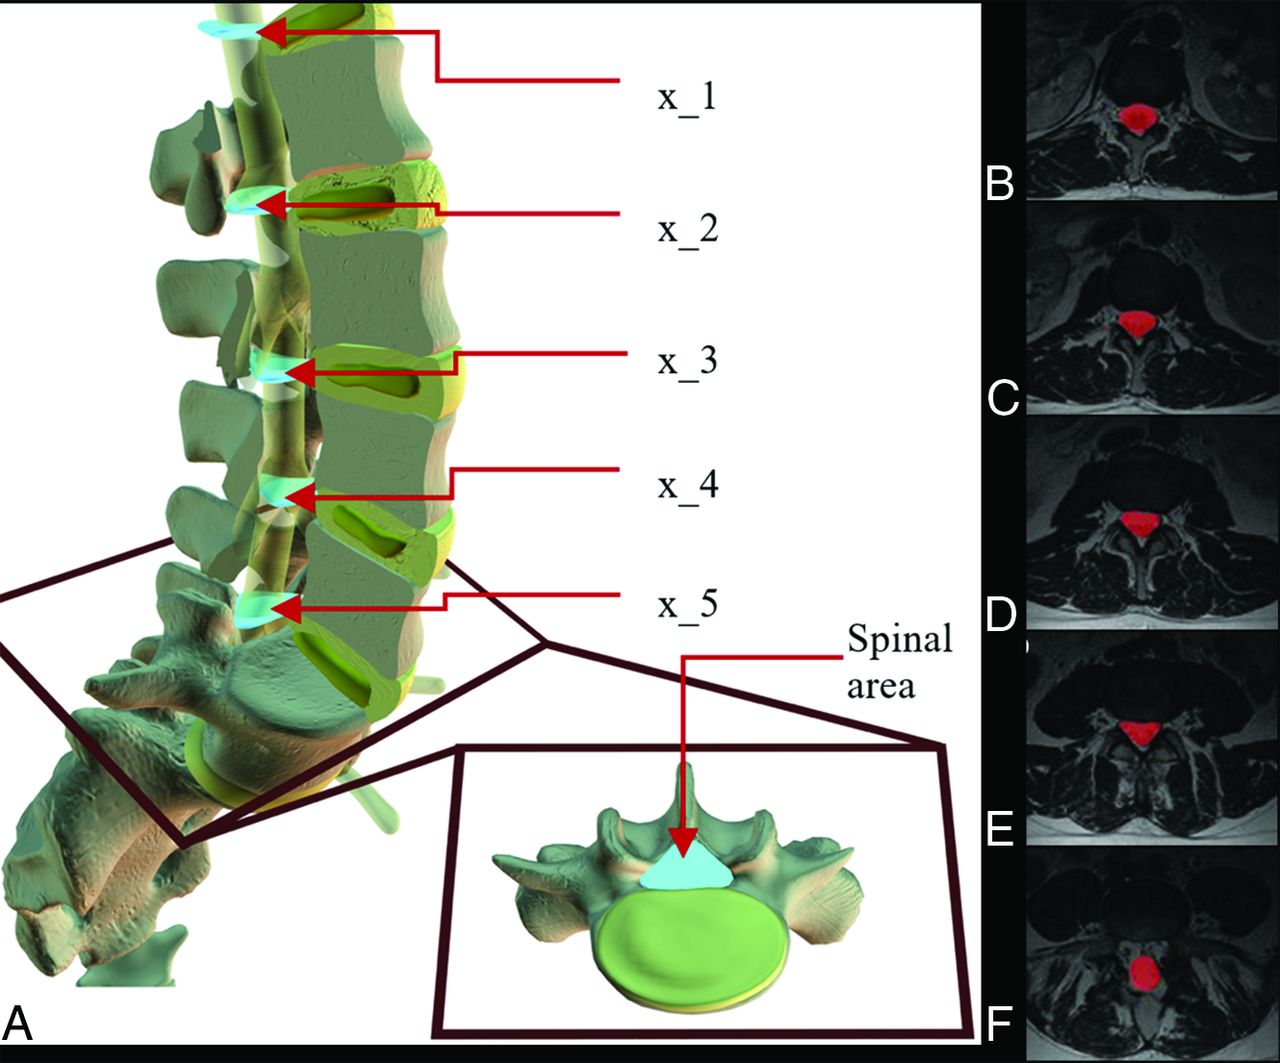
Variation of spinal canal area with level. A, This 3D model represents a generic lumbar spine where light blue objects represent an area of the central canal at each lumbar level at the midsection of a disc. The square frame (red) zooms in on the intervertebral disc (yellow) below L5 to give an axial view of where the central canal area (light blue) is located. In a randomly selected T2-MR imaging, each picture in this series B–F depicts 1 section of spinal cord segmentation (red) from each level. Tissues within the canal but outside the thecal sac are not segmented.
Segmentation Measurements
We used Dice scores, the Hausdorff distance, and average surface distance metrics. These compared overlaps for automatic spinal canal segmentations with segmentations generated by manual raters and manual raters among themselves.
Data Collection for Analysis of Normative Cohort
We cross-referenced the 39,295 image accessions with anonymized patient records to eliminate studies associated with the International Classification of Diseases21 (ICD-9) codes (listed in On-line Table 2) related to the presence of spinal pathology or symptoms attributable to the spine (eg, sciatica). The filtered dataset contained 3837 unique MRNs. We could not use all the MRNs for analyses due to various factors, such as the unavailability of associated demographic data (670 cases) and failure to meet any of the quality control criteria mentioned in On-line Table 3 (1412 cases). Quality control metrics are required because incomplete acquisition, image corruption, erroneous segmentation, DICOM header mislabeling, and misorientation in data present a challenge to automatically detecting nonstenosed canals at all 5 levels. Our final analysis included 1755 MRNs (797 men and 958 women), in which the mean age of men was 49.6 years (σ = 16.92 years) with a median of 49.5 years. The mean age of women was 48.25 years (σ = 16.25 years) with a median of 49.0 years. The age ranges for both men and women were between 19 and 81 years.
Area Measurements
We cross-referenced axial MRIs containing segmented canals with their sagittal MRIs containing segmented intervertebral discs to locate slices at each lumbar level in a standard way (Fig 1). At axial slices where the center of a disc was found, we documented canal areas to investigate variation of these areas with respect to age, sex, and height.
Results
Segmentation Results
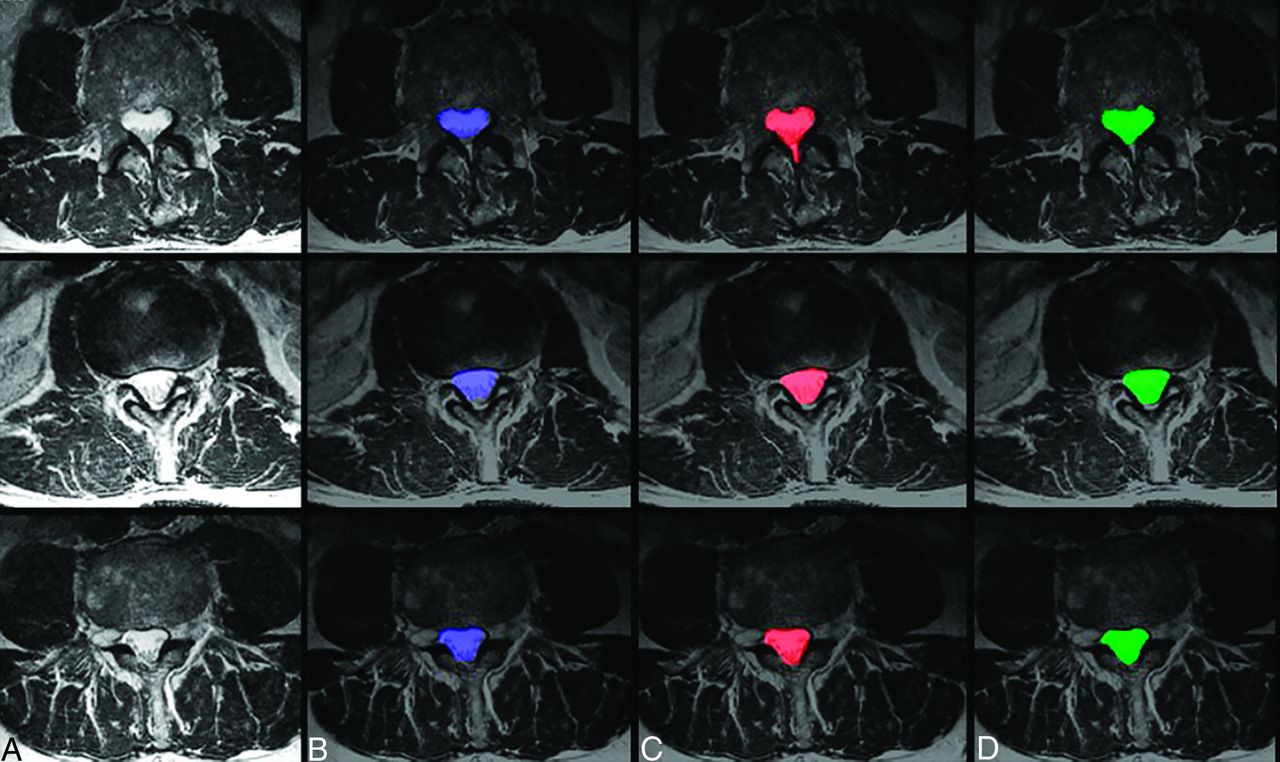
While central canals may not have a consistent shape (Fig 2A), machine-generated segmentations were qualitatively comparable with those generated by human experts (Fig 2B--D). Quantitative metrics (Dice score, Hausdorff distance, and average surface distance) for the validation dataset are recorded in Table 1. These metrics indicate that machine-generated segmentation agrees almost as well with each human expert as the human experts agree among themselves. Disc segmentations generated by machine achieved a Dice overlap of 0.88 with respect to a single human rater on the validation dataset. All discs detected by the human rater were detected by the U-Net, achieving a detection rate of 100%.

Sample case images of central canal segmentations. Three case images of axial T2 MR imaging (A) randomly selected from the dataset are shown alongside their resulting segmentations (blue) of the spinal canal using the proposed ensemble technique (B), segmentation (red) by manual rater 1 (C), and segmentation (green) by manual rater 2 (D).
Comparison of automated spinal canal segmentations in a validation dataset of 109 axial MRIsa
Segmentation Modes of Failure
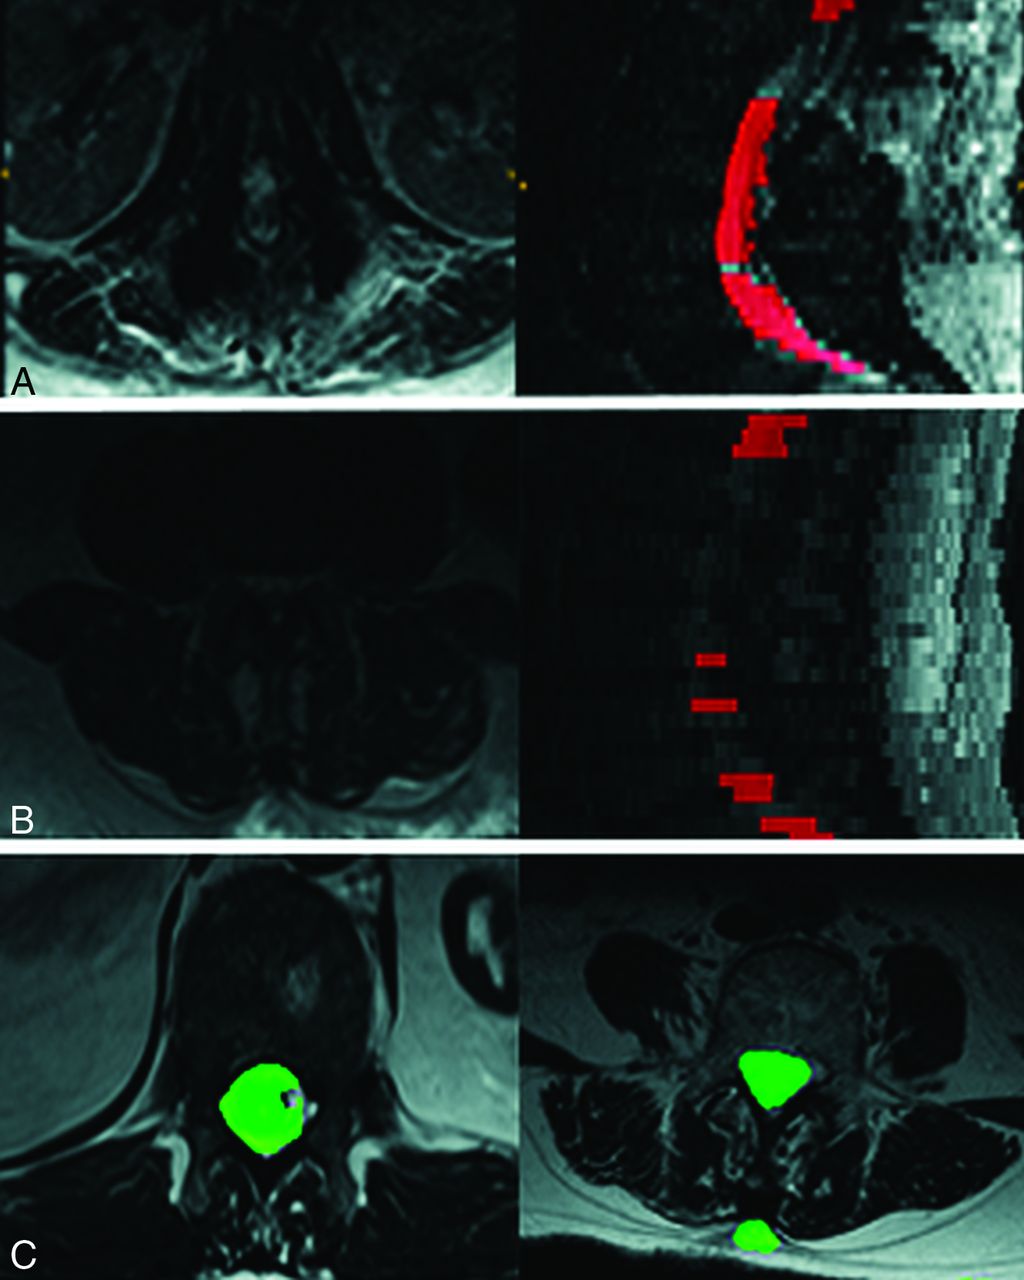
Figure 3A, -B presents 2 validation set images that had a Dice coefficient <0.7. The proposed model seems to fail by nonsegmentation of entire slices. Given that U-Net-generated disc segmentations had a 100% detection rate, we attempted a U-Net algorithm for spinal cord segmentations. This model had parameters identical to the U-Net described for disc segmentation. As opposed to the proposed method, the U-Net failed by mis-segmenting the image (Fig 3C). Because such failures are difficult to track using simple quality control criteria (On-line Table 3), we espoused the SVM + ERT approach.

Modes of segmentation failure of the proposed algorithm compared with U-Net results. Two scans using SVM + ERT failed (Dice score <0.7). The mode of failure was complete lack of segmentation as seen in rows A and B, thereby making it easy to eliminate such cases automatically. In contrast U-Net failures are more subtle and can involve under and oversegmentation as shown in row C.
Time Improvement
Human-driven segmentation of a spinal canal takes between 30 and 40 minutes for each image, while machine-generated segmentation takes between 20 and 25 seconds. Thus, machine segmentation is as efficient as expected.
Relationship between Canal Areas and Height, Sex, and Age
We investigated the relationship between canal areas and demographic factors (height, sex, and age) using a variable-intercept mixed linear model. This is because the canal area measurements at L1 through L5 are not independent within subjects. Canal areas were clustered by subject, and a mixed model of the form: Canal Area ~ Age + Sex + Height + Sex × Height + (1 | Subject) is used. We used the R package lme4 (https://cran.r-project.org/web/packages/lme4/index.html) to implement the model. Tables 2–4 summarize the model fit and show that height is the only demographic factor statistically significantly correlated with canal areas at L1 through L5.
Age, gender, and height were analyzed using a mixed effects model Canal Area ~ age + gender + height + gender*height + (1 | subject). This table represents the Random Effects fita
Age, gender, and height were analyzed using a mixed effects model Canal Area ~ age + gender + height + gender*height + (1 | subject). This table represents the Intercept fit - equivalent to traditional regressiona
Age, gender, and height were analyzed using a mixed effects model Canal Area ~ age + gender + height + gender*height + (1 | subject). This table represents the correlation of fixed effectsa
Discussion
We describe a computerized pipeline to analyze spinal canal areas with respect to age, sex, and height. Our machine learning algorithm can automatically delineate spinal canals with human-level accuracy in a time-efficient and consistent manner.
We acknowledge that there are certain limitations to the study design. The first is the area of delineation, at the lower levels (L5–S1), was chosen to be the thecal sac rather than the full canal. This was because the thecal sac was most directly relevant to nerve compression and thus to stenotic pathology. Because the thecal sac is much more difficult to delineate, especially at lower levels, this can yield partial canal segmentations as seen in Fig 1F. A second caveat involves defining asymptomatic images using ICD codes. While these codes are the clinical standard, they can sometimes contain human error. A third limitation of the study was that we could not obtain the demographic data for body mass index and smoking status, both of which could be important covariates in the model.
The high computational burden of training and analysis represented a challenge to the study. More advanced deep learning models could potentially be trained with the use of graphics processing units, which were not available for this study. We would expect such models to perform better than the proposed pipeline. Lack of computational power also held up cross-validation analysis during training. In the future, we intend to obtain additional computational capacity and train more powerful ML models for canal segmentation.
Future work will include shape analysis alongside area measurements. Canal morphology is perhaps as important as canal area to the diagnosis of stenosis. The development of diagnostic shape measures will be an area of focus for future research. Last, in the future, we also hope to investigate how our technique segments spinal canals when severe pathology is present and whether such segmentations can be used for diagnostic purposes.
Conclusions
We have used state-of-the-art machine learning technology to establish a normative range of spinal canal areas in the lumbar spine from MR images. We have documented the variation of these areas with respect to age, sex, and height. We believe that these measurements and range are the critical first step to usher in an objective paradigm in the radiologic diagnosis of lumbar stenosis.
Footnotes
Disclosures: Bilwaj Gaonkar—UNRELATED: Employment: University of California Los Angeles, RELATED: Passive stock ownership in Theseus AI, a start up being spun out of University of California Los Angeles, Luke Macyszyn - UNRELATED: Employment: University of California Los Angeles, RELATED: Stock ownership and Board membership in Theseus AI, a start up being spun out of University of California Los Angeles, NIH grant R21EB026665 awardeed as Principal Investigator; We have plans to apply for patents (Planned, Pending or Issued) and wish to have the right to submit patents based on this work in the future.
References
- Received September 19, 2018.
- Accepted after revision July 3, 2019.
- © 2019 by American Journal of Neuroradiology


Jump to section
Related Articles
Cited By...
- No citing articles found.