
Abstract
BACKGROUND AND PURPOSE: The signal intensity of the thyroid in neonates is high on T1WI. It is affected by gestational and postnatal ages. However, the extent of the influence of these ages is unknown. This study investigated the relationship of signal intensities of the infant thyroid with postnatal and gestational ages and anterior pituitary using 3D gradient-echo T1WI.
MATERIALS AND METHODS: This retrospective study included 183 T1-weighted images from 181 infants. Using a multiple linear regression analysis, we evaluated the effects of postnatal and gestational ages on the thyroid–muscle signal intensity ratio. The relationship between the thyroid and anterior pituitary signal intensities on T1WI and the age of the infants was evaluated.
RESULTS: Multiple linear regression analysis showed that the thyroid signal intensity was affected negatively by postnatal age at examination and positively by gestational age at birth (P < .01 and P = .04, respectively). According to the standardized partial regression coefficients, the influence of postnatal age at examination was stronger than that of gestational age at birth (−0.72 and 0.13, respectively). The thyroid and anterior pituitary signal intensities reached constant values at 12 weeks' postnatal age, and the mean thyroid–anterior pituitary signal intensity ratios were almost 1 throughout the entire period.
CONCLUSIONS: The signal intensity of the infant thyroid on T1WI was more strongly influenced by the postnatal age at examination than the gestational age at birth, and it was almost equal to that of the anterior pituitary.
ABBREVIATIONS:
- GRE
- gradient echo
- TSH
- thyroid-stimulating hormone
Thyroid hormone is essential for prenatal and neonatal neurologic development.1 The fetal hypothalamic–pituitary–thyroid axis begins to develop by gestational week 6, and thyroid follicular epithelial cells are able to concentrate iodide and synthesize thyroid hormone by 11 weeks of gestation.2,3 After delivery, serum thyroid-stimulating hormone (TSH) demonstrates a transient increase in the first 24 hours, and this TSH surge stimulates a rise in serum levels of thyroxine and triiodothyronine.4 A previous study reported that the fetal thyroid gland showed high signal intensity on 3D gradient-echo (GRE) T1WI, and the fetal thyroid–muscle signal intensity ratio did not correlate with gestational age.5
In our institution, infants in the neonatal intensive care unit are routinely screened for CNS abnormalities using MR imaging, including 3D GRE T1WI in the head to neck range. Some of these infants display high signal intensity in the thyroid gland on 3D GRE T1WI, especially when the time between birth and the MR examination was short. The anterior pituitary glands of neonates usually show high signal intensity on T1WI, and the relative signal intensity of the anterior pituitary gland to that of the pons was significantly negatively correlated with postnatal age at examination.6 A recent study reported that the signal intensity of the infant thyroid and anterior pituitary on 3D GRE T1WI correlated positively with the gestational age at birth and negatively with the postnatal age at examination.7 However, the extent of the influence of gestational age at birth and postnatal age at examination on the signal intensities of the infant thyroid and anterior pituitary on T1WI is not known.
It was hypothesized that postnatal age at examination might affect the signal intensity changes of the infant thyroid on 3D GRE T1WI more strongly than the gestational age at birth. The change in signal intensity of the infant thyroid on 3D GRE T1WI was thought to be similar to that of the anterior pituitary. In this study, a multiple linear regression analysis was used to evaluate the effects of postnatal age at examination and gestational age at birth on the thyroid–muscle and anterior pituitary–muscle signal intensity ratios. In addition, the change in signal intensity of the infant thyroid gland on 3D GRE T1WI was assessed to clarify the relationship between signal intensities of the infant thyroid and anterior pituitary.
MATERIALS AND METHODS
Participants
In this retrospective study, subjects included infants with no known thyroid function abnormality who had been referred for screening brain MR examination between July 2016 and April 2019. The institutional review board of Nagoya City University Hospital approved this study and waived the requirement for patient informed consent because of the retrospective nature of the study and the use of anonymized patient data. The inclusion criteria of this study were as follows: 1) brain MR imaging was performed within 4 months of birth, and 2) 3D GRE T1WI was performed. The exclusion criteria were as follows: 1) thyroid function abnormality, 2) unsatisfactory MR images caused by motion artifacts, and 3) infants with severe brain injury. Neonatal thyroid function was tested in neonate screening, which evaluated blood spot TSH, thyroxine, or both.8 Among the 223 consecutive neonates who underwent MR imaging, 6 with thyroid function abnormality, 24 with unsatisfactory MR images caused by motion artifacts, and 10 with severe brain injury were excluded. Thus, 183 MR images from 181 infants (96 males and 85 females) formed the final study cohort.
The terms concerning the age of the infant in this study were defined as follows: “gestational age at birth” refers to the age of the infant at birth based on the number of weeks gestation, “gestational age at examination” refers to the age of the infant at the time of the MR imaging examination based on the number of weeks gestation, and “postnatal age at examination” refers to the number of days from birth to the day of the MR imaging examination. In the study cohort, the gestational age at birth, gestational age at examination, and postnatal age at examination ranged from 22 to 41 weeks (mean, 34 weeks), 36 to 50 weeks (mean, 39 weeks), and 0 to 107 days (mean, 32 days), respectively. A total of 117 of the 181 neonates were delivered preterm (birth before 37 weeks of gestation), and 130 of the 181 were delivered by cesarean section. Among the 181 neonates, 178 were admitted to the neonatal intensive care unit after a diagnosis of respiratory distress (n = 83); low birth weight (n = 51); asphyxia (n = 18); congenital cardiac anomaly (n = 18); hypoglycemia (n = 2); or myelomeningocele, angiomatosis, diaphragmatic hernia, jaundice, convulsion, or volvulus of the small intestine (n = 1 each). The remaining 3 infants underwent MR imaging examination for suspected congenital brain malformations.
MR Imaging Technique
MR imaging was performed using a 1.5T (n = 53) or 3T (n = 130) scanner (Ingenia; Philips Healthcare), with a 20-channel head coil. T1-weighted sagittal images were obtained using the 3D T1 turbo field echo method. Imaging parameters were as follows: TR/TE, 9.2–9.5/4.3–4.5 ms; flip angle, 7°; field of view, 224 × 224 mm; section thickness, 1 mm; image matrix, 224 × 224; and parallel imaging (sense factor = 2) for the 1.5T scanner and TR/TE, 6.1–6.7/2.7–3.1 ms; flip angle, 8°; field of view, 256 × 256 mm; section thickness, 1 mm; image matrix, 256 × 256; and parallel imaging (sense factor = 2) for the 3T scanner.
Imaging Analysis
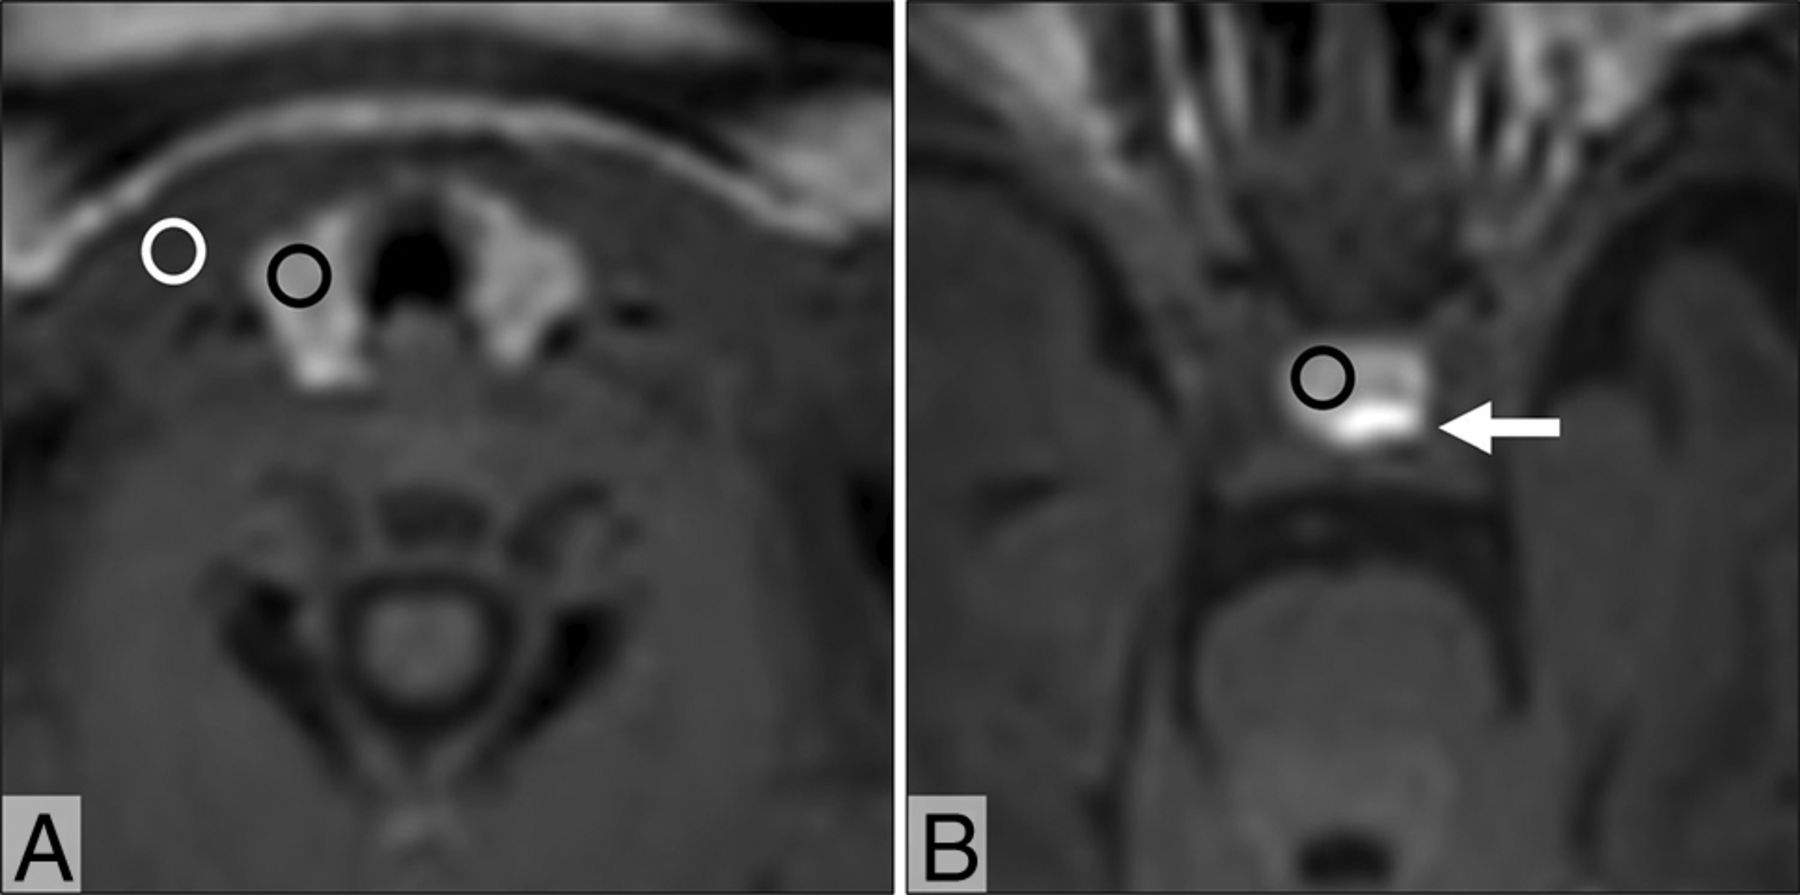
Two experienced radiologists (6 and 17 years of experience in infant MR imaging, respectively) worked together and retrospectively reviewed the 3D GRE T1-weighted MR images. The reviewers were blinded to the clinical details. The mean MR signal intensity from the thyroid, sternocleidomastoid muscle, and anterior pituitary were measured using manually defined circular or oval ROIs (∼5 mm2). The signal intensities of the thyroid and sternocleidomastoid muscle were measured on reconstructed axial images at the same horizontal level, and the signal intensity of the anterior pituitary was measured on reconstructed axial images, where the maximal diameter of the anterior pituitary was shown (Fig 1). In addition, the thyroid–muscle, anterior pituitary–muscle, and thyroid–anterior pituitary signal intensity ratios were calculated.

Axial 3D GRE T1-weighted MR images of an infant at postnatal day 6 show the thyroid (A) and pituitary (B). For measurement of the signal intensity, ROIs are placed on the thyroid (black circle, A), sternocleidomastoid muscle (white circle, A), and anterior pituitary (black circle, B). The posterior pituitary is shown (arrow, B).
Statistical Analysis
The correlation between the thyroid–muscle signal intensity ratio and postnatal age at examination or gestational age at examination were calculated using the Pearson correlation coefficient. A multiple linear regression analysis was used to evaluate the effects of postnatal age at examination and gestational age at birth on the thyroid–muscle and anterior pituitary–muscle signal intensity ratios. Analysis of variance was used to compare the thyroid–pituitary signal intensity ratios with respect to postnatal age at the time of examination. All statistical analyses were performed using Bell-Curve (version 2.11, Social Survey Research Information) for Excel software (Microsoft Office 2019).
RESULTS
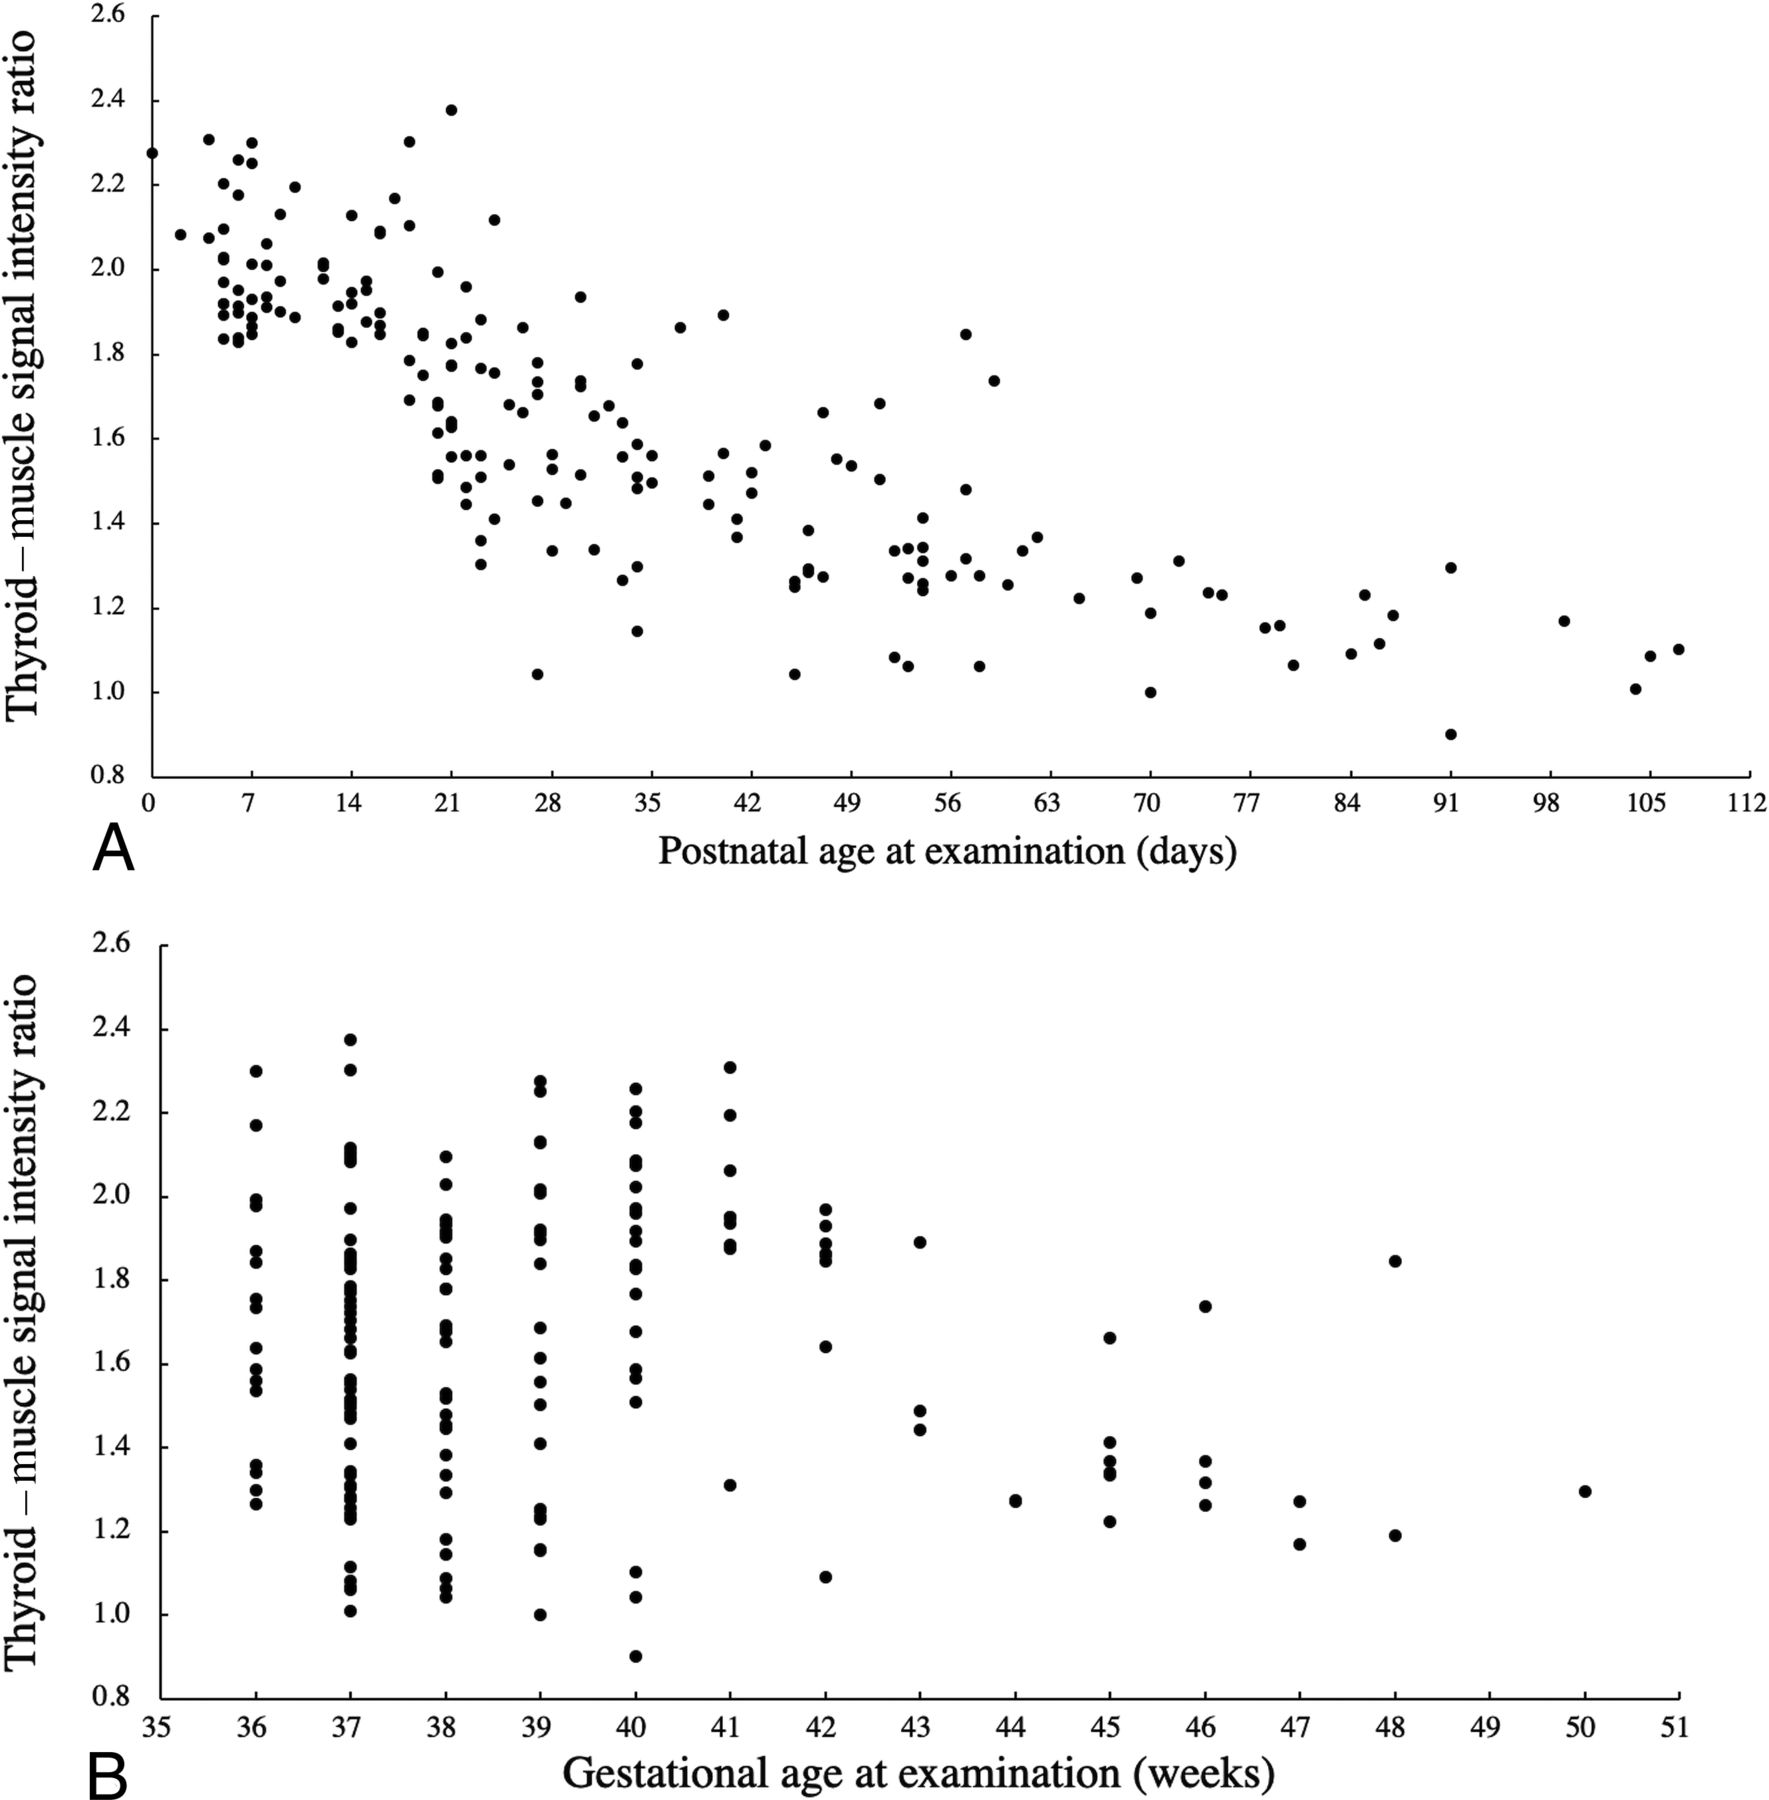
Fig 2 shows the thyroid–muscle signal intensity ratio plotted against the corresponding postnatal age at examination or gestational age at examination. There was a negative correlation between the thyroid–muscle signal intensity ratio and postnatal age at examination (r = −0.75, P < .01). Conversely, there was no distinct relationship between the thyroid–muscle signal intensity ratio and gestational age at examination (r = 0.05, P = .18). Regarding the anterior pituitary and thyroid, there was a negative correlation between the anterior pituitary–muscle signal intensity ratio and postnatal age at examination (r = −0.67, P < .01), and no distinct relationship between the anterior pituitary–muscle signal intensity ratio and gestational age at examination (r = 0.10, P = .55).

Scatterplots of the thyroid–muscle signal intensity ratio against the corresponding postnatal age at examination (A) and gestational age at examination (B). There is a negative correlation between the thyroid–muscle signal intensity ratio and postnatal age at examination (A). Conversely, there is no distinct relationship between the thyroid–muscle signal intensity ratio and gestational age at examination (B).
A multiple linear regression was performed to predict the thyroid–muscle signal intensity ratio based on postnatal age at examination and gestational age at birth. A significant regression equation was found (F (2, 180) = 177.9, P < .01), with an R2 of 0.66. The predicted thyroid–muscle signal intensity ratio of participants was equal to 1.6035 − 0.0101 (postnatal age at examination) + 0.0107 (gestational age at birth), in which the postnatal age at examination was in days and gestational age at birth was in weeks. The standardized partial regression coefficients of postnatal age at examination and gestational age at birth were −0.72 (P < .01) and 0.13 (P = .04), respectively. A multiple linear regression was also performed to predict the anterior pituitary–muscle signal intensity ratio based on postnatal age at examination and gestational age at birth. A significant regression equation was found (F (2, 180) = 120.3, P < .01), with an R2 of 0.57. Participants' predicted anterior pituitary–muscle signal intensity ratio was equal to 1.2750 – 0.0087 (postnatal age at examination) + 0.0183 (gestational age at birth) in which postnatal age at examination was in days and gestational age at birth was in weeks. The standardized partial regression coefficients of postnatal age at examination and gestational age at birth were −0.60 (P < .01) and 0.21 (P < .01), respectively. The thyroid–muscle and anterior pituitary–muscle signal intensity ratios reached a constant value at a postnatal age of 12 weeks (Table). The mean thyroid–anterior pituitary signal intensity ratios were almost 1 throughout the entire period (Table), and there was no statistically significant difference between different postnatal ages per week (P = .89).
Means of thyroid–muscle, anterior pituitary–muscle, and thyroid–anterior pituitary signal intensity ratios against the corresponding postnatal age at examination grouped according to week
DISCUSSION
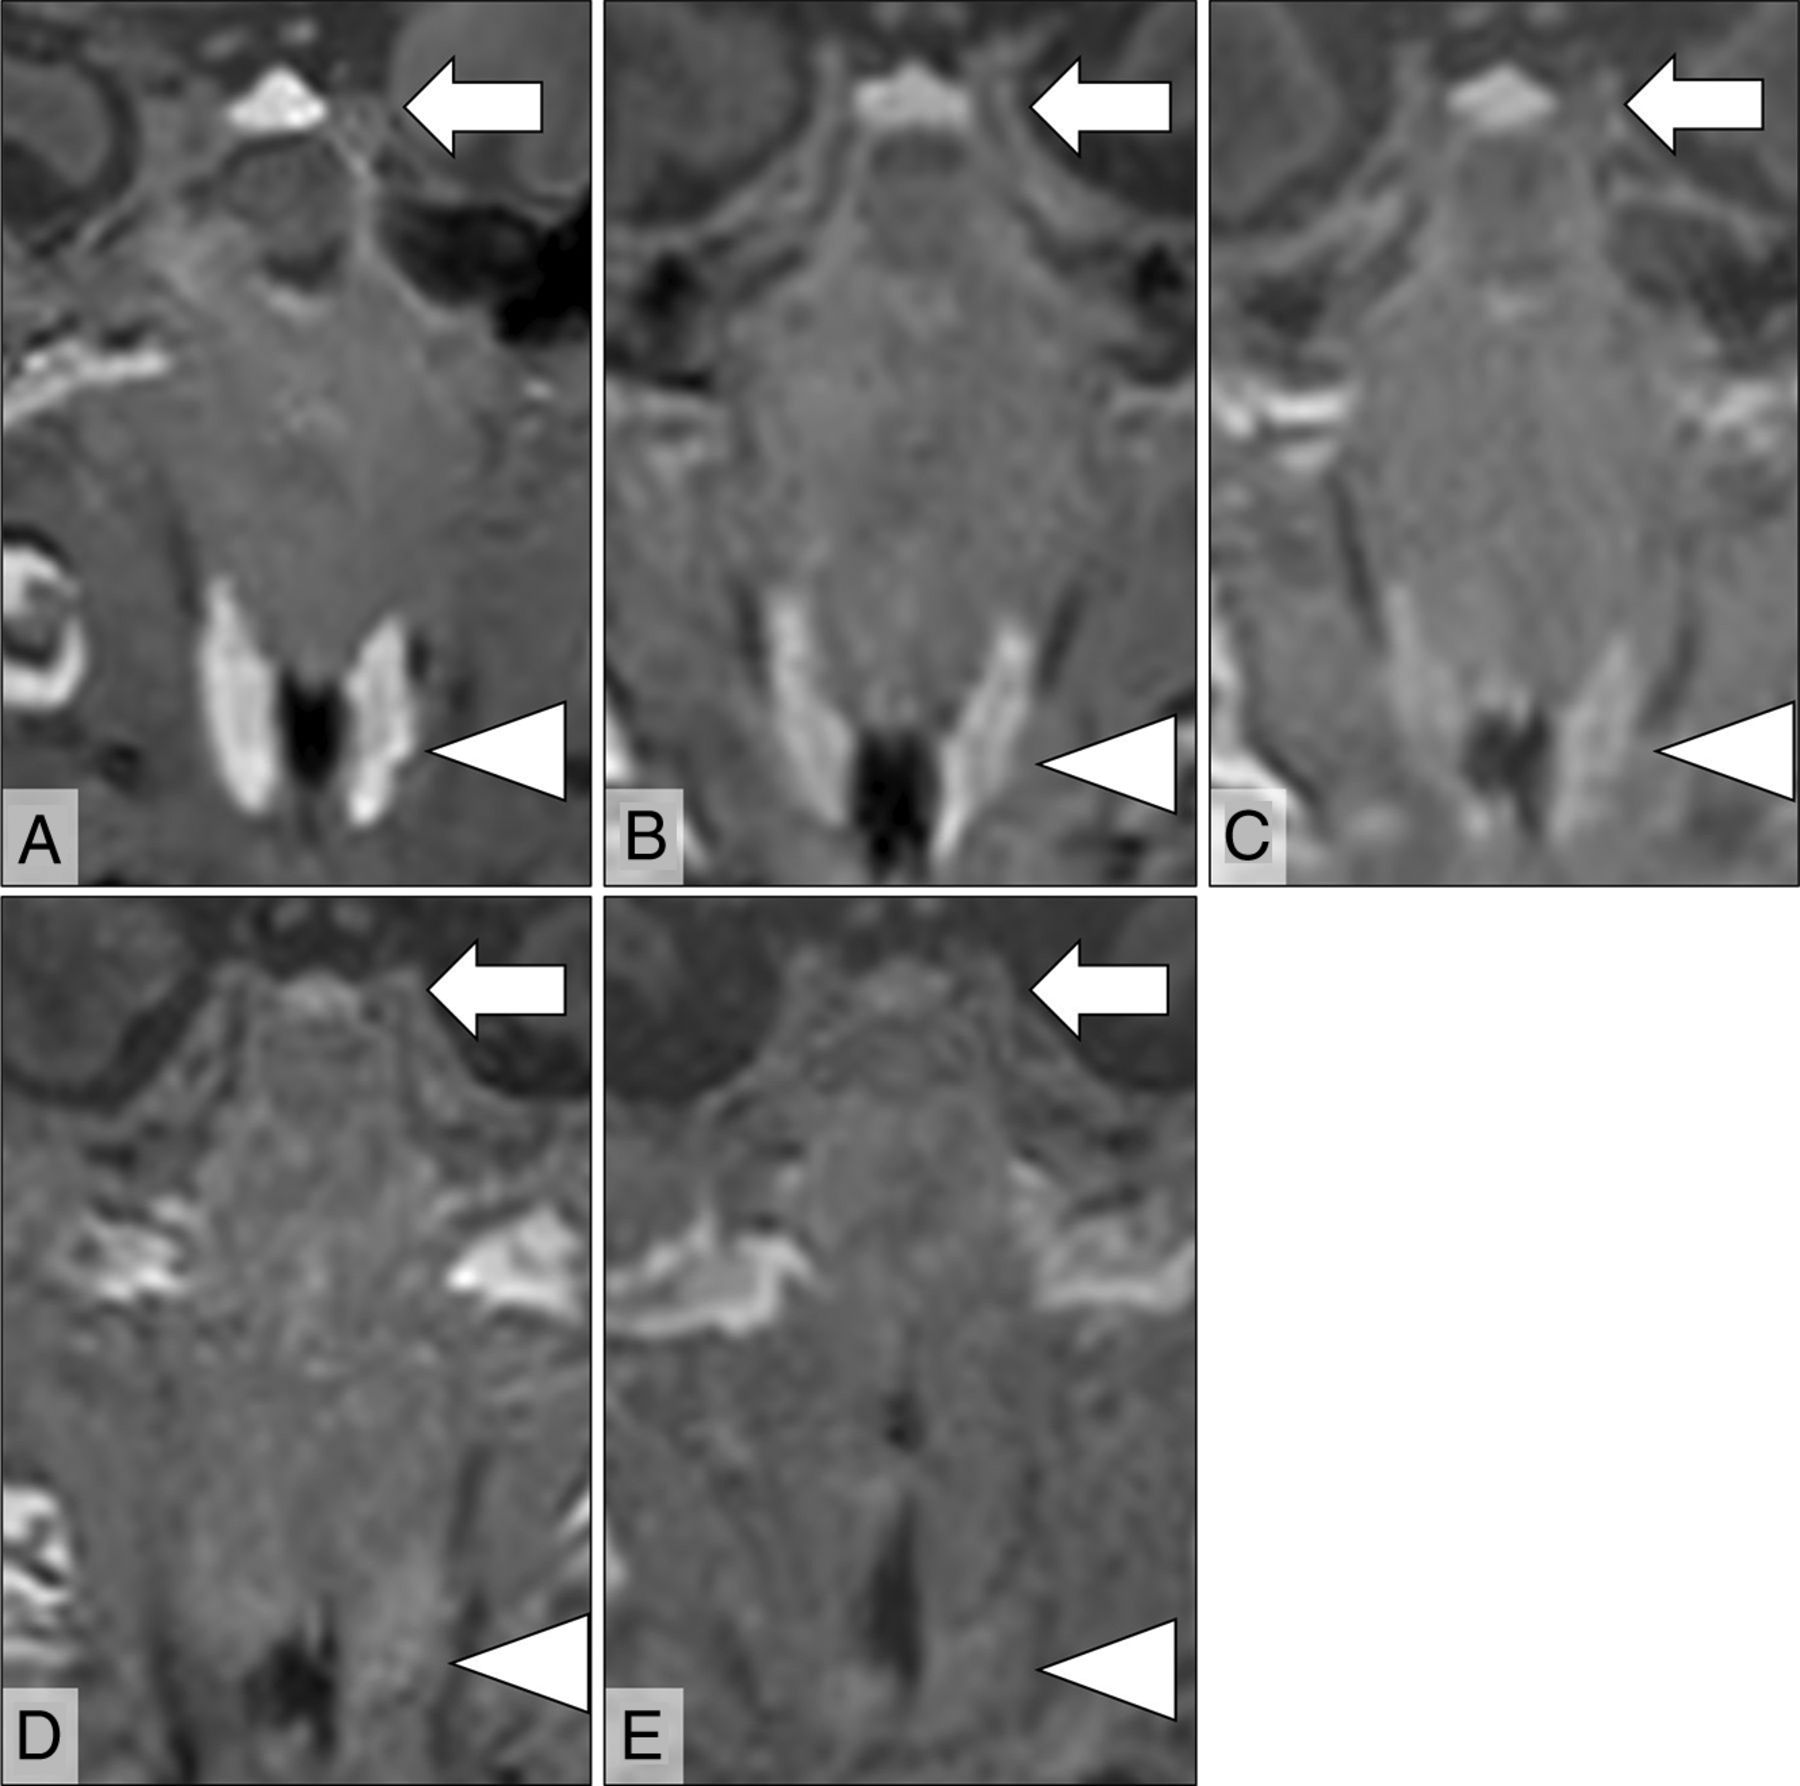
The present study demonstrated that the thyroid usually showed high signal intensity on 3D GRE T1-weighted MR imaging in neonates. However, the hyperintensity diminished in older infants and seemed to be a temporary phenomenon. The disappearance of this hyperintensity correlated well with postnatal age at examination but not with gestational age at examination. From the results of the multiple linear regression analysis, the postnatal age at examination negatively affected the signal intensity in the thyroid, and gestational age at birth positively affected the signal intensity. According to the standardized partial regression coefficients, postnatal age at examination was more effective than gestational age at birth. The same tendency was observed in the signal intensity of the anterior pituitary. The thyroid–muscle and anterior pituitary–muscle signal intensity ratios reached constant values at 12 weeks of postnatal age, and the signal intensity of the thyroid on 3D GRE T1WI was almost equal to that of the anterior pituitary throughout the entire period within the fourth postnatal month (Fig 3).

Five different cases showing the thyroid (arrowheads) and anterior pituitary (arrows) on coronal 3D GRE T1-weighted MR images examined at different postnatal ages: 4 days (A), 21 days (B), 33 days (C), 46 days (D), and 70 days (E). These patients' gestational ages at birth are 41, 34, 31, 31, and 29 weeks, respectively. At 4 days of postnatal age, the thyroid and anterior pituitary show extremely high signal intensity (A), and the signal intensity of those glands decreased proportionally to postnatal age (B–E). The signal intensities of the thyroid glands are similar to those of the anterior pituitary glands regardless of postnatal age, and the thyroid–anterior pituitary signal intensity ratios are almost 1 (A = 0.91, B = 1.04, C = 0.83, D = 0.81, E = 0.92).
Because there was lesser effect of gestational age on the signal intensity of the infant thyroid on 3D GRE T1WI, the decreased signal intensity in the neonatal thyroid may be influenced more by changes that occur in the thyroid after birth. The decrease in signal intensity of the infant thyroid may be related to changes in thyroid hormone production, considering the decline in serum thyroid hormone levels after birth.9 Furthermore, a previous report showed high signal intensity of the thyroid in the fetal period; hyperintensity of the neonatal thyroid may be related to the immaturity of the thyroid tissue.5
Thyroglobulin and iodine play important roles in the synthesis of thyroid hormones.10 Thyroglobulin is a glycoprotein synthesized in the thyroid follicular epithelial cells.11 After synthesis, thyroglobulin is transported and stored in the follicular lumen, where the tyrosine residues of thyroglobulin undergo iodination to produce monoiodotyrosine and diiodotyrosine catalyzed by thyroid peroxidase. Subsequent coupling of these iodotyrosines produces thyroxine and triiodothyronine. Relatively large amounts of thyroid hormones are required for normal postnatal development. After delivery, the TSH level surges to approximately 80 mU/L in response to exposure to cold or clamping of the cord.2,12 The TSH concentration peaks about 30 minutes after birth and falls rapidly in the first 24 hours and then more slowly to under 10 mU/L after the first week of life.2 TSH stimulates a rise in serum thyroxine, which reaches a peak at 24–36 hours followed by a rapid decrease in the third or fourth day and then a slower decrease during the next 4 months, eventually reaching a minimum at about 9–12 months.2,9 In the first 24 hours of life, the thyroid shows no or very low colloid content in 60%–80% of neonates, which might be closely related to the low iodine and thyroglobulin contents of the neonatal thyroid.13,14 After 24 hours, a progressive filling of the thyroid follicles occurs, and only 6%–7% of thyroids had an absence of colloid at up to 6 days and less than 2% afterward.13,14 After 12 days of life, the histologic aspects and iodine and thyroglobulin concentrations tend to match those seen in adults.14
The storage of thyroglobulin and iodine in the thyroid only occurs around term birth, and these concentrations in the thyroid progressively increase in infants who survive beyond gestational week 42.3 The total iodine concentration in the thyroid of neonates is far lower than that of adults, being 1/10 of the adult concentration up to 42 weeks of gestational age.3,15 It is significantly higher in infants who survive longer, reaching 50% of the normal adult value.3 The thyroglobulin concentration is approximately 4% of the adult value in premature neonates and increased 4-fold in term infants.3 It was assumed that the absence of iodine and thyroglobulin storage in the immature thyroid could result either from a limited capacity to synthesize thyroglobulin or a lack of colloid in thyroid follicles.3,14,15
Contrary to the low concentrations of thyroglobulin and iodine in the immature thyroid, the percentage of thyroglobulin iodination and thyroxine to thyroglobulin molar ratio are equal to or higher than adult values for all gestational ages.16 There is no marked systematic linear correlation in thyroglobulin iodination with duration of life.17 Coupling efficiency is established in the fetal thyroid, and the values are comparable to those of adults, even in glands with low relative weight to that of the body.16 The calculated turnover of the thyroxine pool is very rapid in preterm and term neonates, ranging from 100%–1000% renewal of the pool per day, with lower values in older infants.3 A high percentage of thyroglobulin iodination and coupling efficiency contributes to the active functionality of the fetal thyroid at an early gestational age.16 If thyroglobulin or iodine concentration in the thyroid or viscosity of colloids in the thyroid follicles is responsible for the signal intensity change of the infant thyroid on 3D GRE T1WI, the signal intensity should increase with gestational age or postnatal age. Therefore, it was speculated that a high percentage of thyroglobulin iodination and ratio of thyroxine to thyroglobulin molar ratio may contribute to T1 shortening. In patients with untreated Graves disease, the thyroid demonstrated a high signal intensity on T1WI, and there was a linear relationship between the thyroid–muscle signal intensity ratio on T1WI and serum thyroxine concentrations.18 In Grave disease, the percentage of thyroglobulin iodination is higher than that of normal thyroid tissue, and it was demonstrated that the amount of thyroxine per mole of thyroglobulin increases with increasing iodine content.19 These prior studies also support the hypothesis that the high signal intensity of the fetal and neonatal thyroid on T1WI may be attributed to a higher percentage of thyroglobulin iodination in the immature thyroid.
Several MR studies have revealed that the neonatal anterior pituitary gland usually appears hyperintense on T1-weighted MR images, and the signal intensity of the anterior pituitary gland negatively correlated with postnatal age but not gestational age at birth.6,20⇓-22 It was suspected that the mechanisms underlying hyperintensity of the anterior pituitary gland related to hyperplasia of prolactin cells in the anterior pituitary, which is caused by estrogen produced by the placenta during pregnancy.6 After birth, removal from the effect of placental estrogen may cause a decrease in the number of prolactin cells, resulting in a decline in the signal intensity of the anterior pituitary gland. Although the high signal in the anterior pituitary gland did not reflect TSH production, it was interesting to note that the transition in signal intensity of the anterior pituitary was similar to that of the thyroid.
This study has several limitations. First, although the participant population was confirmed to have normal thyroid function, almost all participants were admitted to the neonate intensive care unit for observation of any perinatal problems leading to potential bias. Second, no histologic specimens of the thyroid were obtained in the current study, and the relationship between T1 signal intensity and thyroid histology was not verified. Third, regarding the signal intensity analysis, the quantification was simply based on the ratio between the signal intensity of the thyroid and that of the muscle or anterior pituitary. The T1 relaxation time could not be measured because this was a retrospective analysis. Finally, in this study, both 1.5T and 3T MR imaging scanners were used because of the limited availability of MR examination slots. This may have affected the value of the signal intensity ratios.
CONCLUSIONS
The current study revealed that the signal intensity in the thyroid was negatively affected by the postnatal age at examination and positively affected by the gestational age at birth. The disappearance of this hyperintensity was influenced more strongly by the postnatal age at examination than gestational age at birth. The thyroid–muscle and anterior pituitary–muscle signal intensity ratios reached constant values at 12 weeks of postnatal age, and the signal intensity of the thyroid on 3D GRE T1WI was almost equal to that of the anterior pituitary throughout the entire period up to 4 months of postnatal age. The current preliminary data suggest that thyroid signal intensity measurements based on 3D GRE T1WI may provide useful information about hormonal function in infants.
References
- Received September 24, 2020.
- Accepted after revision November 23, 2020.
- © 2021 by American Journal of Neuroradiology


Jump to section
Related Articles
Cited By...
- No citing articles found.