
Abstract
BACKGROUND AND PURPOSE: Intracerebral hemorrhage poses a severe threat to the outcomes in patients with postthrombectomy acute stroke. We aimed to compare the absolute intracerebral iodine concentration and normalized iodine concentration ratio in predicting intracerebral hemorrhage in patients postthrombectomy.
MATERIALS AND METHODS: Patients with acute anterior circulation large-vessel occlusion who underwent mechanical thrombectomy and had successful recanalization were retrospectively included in the study. Dual-energy CT was performed within 1 hour after mechanical thrombectomy. Postprocessing was performed to measure the absolute intracerebral iodine concentration and the normalized iodine concentration ratio. The correlation between the absolute intracerebral iodine concentration and the normalized iodine concentration ratio was analyzed using the Spearman rank correlation coefficient. We compared the area under the receiver operating characteristic curve of the absolute intracerebral iodine concentration and the normalized iodine concentration ratio using the DeLong test.
RESULTS: We included 138 patients with successful recanalization. Of 43 patients who did not have parenchymal contrast staining on postthrombectomy dual-energy CT, 5 (11.6%) developed intracerebral hemorrhage. Among patients (95/138, 68.8%) with parenchymal contrast staining, 37 (38.9%, 37/95) developed intracerebral hemorrhage. The absolute intracerebral iodine concentration was significantly correlated with the normalized iodine concentration ratio (ρ = 0.807; 95% CI, 0.718–0.867; P < .001). The cutoffs of the normalized iodine concentration ratio and absolute intracerebral iodine concentration for identifying patients with intracerebral hemorrhage development were 222.8%, with a sensitivity of 67.6% and specificity of 76.4%, and 2.7 mg I/mL, with a sensitivity of 75.7% and specificity of 65.5%, respectively. No significant difference was found between the areas under the receiver operating characteristic curve for the absolute intracerebral iodine concentration and the normalized iodine concentration ratio (0.753 versus 0.738) (P = .694).
CONCLUSIONS: The hemorrhagic transformation predictive power of the normalized iodine concentration ratio is similar to that of the absolute intracerebral iodine concentration in patients with successful recanalization.
ABBREVIATIONS:
- AIIC
- absolute intracerebral iodine concentration
- AUC
- area under the receiver operating characteristic curve
- DECT
- dual-energy CT
- ICH
- intracerebral hemorrhage
- IQR
- interquartile range
- MT
- mechanical thrombectomy
- NICR
- normalized iodine concentration ratio
- SSS
- superior sagittal sinus
Endovascular mechanical thrombectomy (MT) has become the management choice for acute ischemic anterior circulation large-vessel stroke and is implemented within up to 24 hours after stroke onset.1,2 Although advances have been made in patient selection for endovascular recanalization, clinical outcomes vary after thrombectomy.3 Intracerebral hemorrhage (ICH) poses a severe potential threat to outcomes in patients postthrombectomy.4
Hyperattenuation commonly appears on NCCT after the MT procedure.5⇓-7 Both iodine contrast agent extravasation and hemorrhage can be seen as high attenuation on NCCT. Differentiating contrast staining from hemorrhage is challenging in conventional single-energy CT.5 In dual-energy CT (DECT), remarkable progress has been made in material separation through the use of material-specific methods; consequently, it is easy to identify whether such high attenuation is due to hemorrhage or iodine contrast staining.8⇓⇓-11 At the same time, DECT parameters can be used to quantify iodine contrast staining. A recent study by Bonatti et al12 suggested that quantitative iodine contrast staining plays an essential role in predicting hemorrhagic transformation in patients after MT. Byrne et al13 hypothesized that systematic differences, namely the timing/volume of contrast agent administration, procedural technique, and patient-related factors, might lead to variability in iodine quantification. They used the relative ratio of the maximum iodine concentration in the brain parenchyma to the iodine concentration in the superior sagittal sinus (SSS) on DECT after MT to reduce the variability and improve the prediction of hemorrhagic transformation on follow-up CT.
This study included patients with small infarct cores and good recanalization. It was concluded that compared with the absolute intracerebral iodine concentration (AIIC) measured in the parenchymal hyperattenuating area, the relative ratio of the maximum iodine concentration to the iodine concentration in the SSS (normalized iodine concentration ratio [NICR]) was a better predictor of ICH development than the absolute values.
In our clinical practice, we had observed that a higher AIIC was strongly correlated with late development of ICH in patients postthrombectomy with good reperfusion. Therefore, we aimed to investigate a homogeneous cohort of patients, similar to the study by Byrne et al,13 with ASPECTS of ≥7 and good endovascular reperfusion, to compare the capability of the AIIC and NICR in predicting ICH development in patients postthrombectomy.
MATERIALS AND METHODS
Study Population
The local institutional research ethics review board approved this retrospective study and waived the need for written consent from patients. From June 2017 to August 2021, consecutive patients who underwent MT for acute anterior circulation large-vessel ischemic stroke were enrolled in this study. The inclusion criteria were as follows: MT performed for anterior circulation large-vessel occlusion with an onset time within 6 hours. The exclusion criteria included no imaging data or missing imaging data, ASPECTS ≤ 6, unsuccessful endovascular recanalization (TICI score, <2b), proximal ICA occlusion, and nonqualified CT image quality (Fig 1).

Flow chart of the steps involved in patient inclusion and exclusion.
Imaging Protocol
NCCT scans were performed at admission and at the 24- to 8-hour follow-up time point using a single-source CT scanner (Somatom Emotion 16; Siemens). Noncontrast DECT was performed to assess patients within 1 hour after MT in the dual-energy mode (Somatom Definition Force; Siemens). The scanning parameters used in NCCT and noncontrast DECT are shown in Table 1.
Scanning parameters of the noncontrast CT and noncontrast DECT
Clinical-Radiologic Data Collection
We collected the following patient data from our medical database: sex, age, ASPECTS, NIHSS score at admission, site of occlusion, thrombectomy devices, history of hypertension, history of diabetes mellitus, history of atrial fibrillation, number of attempts at aspiration or stent retriever placement, procedural duration, onset time to puncture, thrombolytic therapy, and other treatments during hospitalization. The mRS scores were used to quantify the clinical outcomes 90 days after onset.
Image Analysis
Two neuroradiologists (X.G. and C.M., with >5 years of neuroradiology experience) jointly evaluated the head NCCT and CTA images and recorded ASPECTS and regional leptomeningeal collateral scores at admission.14 Two interventional neuroradiologists (M.P. and H.C., with ≥16 years of interventional neuroradiology experience) performed the thrombectomy procedure and recorded the modified TICI score in each case.
X.G. and C.M. evaluated the DECT images using a commercially available software application (syngo.via, DECT brain hemorrhage application, Version VA30A; Siemens). Simulated 120-kV images (nonlinear blending images), virtual noncontrast images, and iodine overlay maps were generated using a 3-material decomposition algorithm.
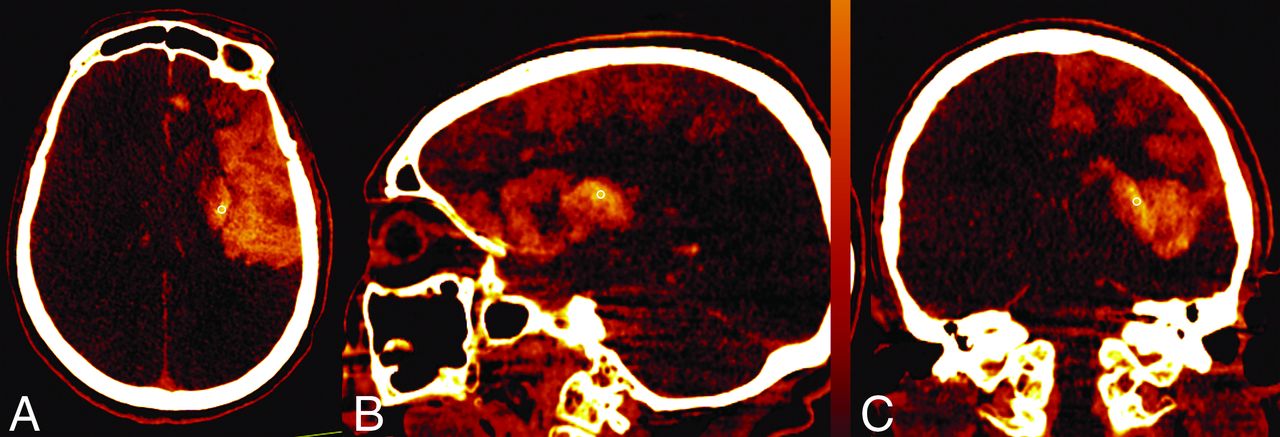
Three mutually perpendicular ROIs (0.1–0.3 cm2) were subjectively placed at the site of maximum apparent contrast staining in the axial, coronal, and sagittal images (Fig 2). The iodine concentration was obtained by averaging these 3 values. To normalize the contrast concentration, we placed an ROI on the SSS while the NICR mode was selected. The NICR was calculated as follows: NICR = Istaining/Isss ×100%, where Istaining and Isss represent the absolute iodine concentrations of the contrast staining and SSS, respectively.13 We used the average of the values recorded by the 2 neuroradiologists in the statistical analysis. Two reviewers analyzed the virtual noncontrast images and iodine overlay maps to distinguish hemorrhage from iodinated contrast extravasation and reached an agreement. High attenuation present on the iodine overlay map that was not present on the virtual noncontrast map was classified as contrast staining. High attenuation on the virtual noncontrast map was classified as hemorrhage. The 2 radiologists jointly analyzed the follow-up CT images, and a consensus was reached on the diagnosis of hemorrhagic transformation. The locations of the contrast staining and hemorrhage were recorded (parenchymal, subarachnoid, or intraventricular). The occurrence of fresh high-attenuation or high-attenuation incongruous with that of postoperative DECT was classified as hemorrhage on the basis of the neurologic status of the patients. According to the European Cooperative Acute Stroke Study classification, the development of hemorrhagic transformation was evaluated in follow-up NCCT images.15 We divided these patients into subgroups on the basis of DECT and follow-up examinations. The present study focused only on the 2 groups with iodine staining with and without ICH. We divided the 2 groups into subgroups (groups with ASPECTS of ≤8 and >8).

Examples of ROIs drawn on axial, coronal, and sagittal iodine overlay maps.
Statistics Analysis
Continuous variables were summarized using mean (SD) and median and interquartile range (IQR) as appropriate, after assessing normality using the Shapiro-Wilk test. To compare subgroups, we used a Student t test for continuous variables with normal distribution, the Mann-Whitney U test for continuous variables with non-normal distribution, or the Pearson χ2/Fisher exact test for categoric data. The intraclass correlation coefficient was calculated to determine the interrater reliability: <0.50, poor; 0.5–0.75, moderate; 0.75–0.90, good; and >0.90, excellent. The Spearman rank correlation coefficient was used to analyze the correlation between the AIIC and NICR. We compared the AIIC and NICR parameters in terms of ICH development on follow-up CT. We compared the area under the receiver operating characteristic curve (AUC) of the AIIC and NICR using the DeLong test. Statistical analyses were performed using SPSS 22.0 (Version 22.0; IBM), GraphPad Prism (GraphPad Software), and MedCalc (MedCalc Software). A 2-sided P < .05 was considered a significant difference.
RESULTS
Patient Population
Among 223 consecutive patients with acute anterior circulation stroke who underwent thrombectomy, 138 were included in our study. The median age was 69 years (IQR, 62–77 years), and 72 patients were male (52.2%).
The mean baseline NIHSS score was 16.8 (SD, 6.8) in patients who met the inclusion criteria. The mean ASPECTS at admission was 9 (IQR, 8–9). Aspiration was performed in 27 patients, and 88 patients were treated with only a stent retriever. Twenty-three patients underwent aspiration followed by stent retriever placement during the thrombectomy procedure. The median number of attempts at aspiration or stent retriever placement was 1 (IQR, 1–2).
Quantitative Analyses
ICH Development.
No contrast staining was seen in the initial DECT scan after thrombectomy in 43 of 138 patients (43/138, 31.2%); among these patients, 2 (2/43, 4.7%) developed parenchymal hematoma type 1, as seen on follow-up NCCT at 48 hours. Three patients (3/43, 7.0%) developed hemorrhagic infarction type 1. In all patients (95/138, 68.8%) with intracranial contrast staining, contrast staining was observed only at the brain parenchyma. On the basis of virtual noncontrast images and iodine overlay maps, contrast staining combined with hemorrhage was seen in only 2 patients (2/138, 1.4%). Follow-up NCCT revealed that 2 patients developed parenchymal hematoma type 2. Of the remaining 93 patients with contrast staining, follow-up NCCT showed that 35 patients (35/93, 37.6%) had hemorrhagic transformation (Online Supplemental Data). Figures 3 and 4 illustrate the development of varied outcomes in patients with contrast staining.

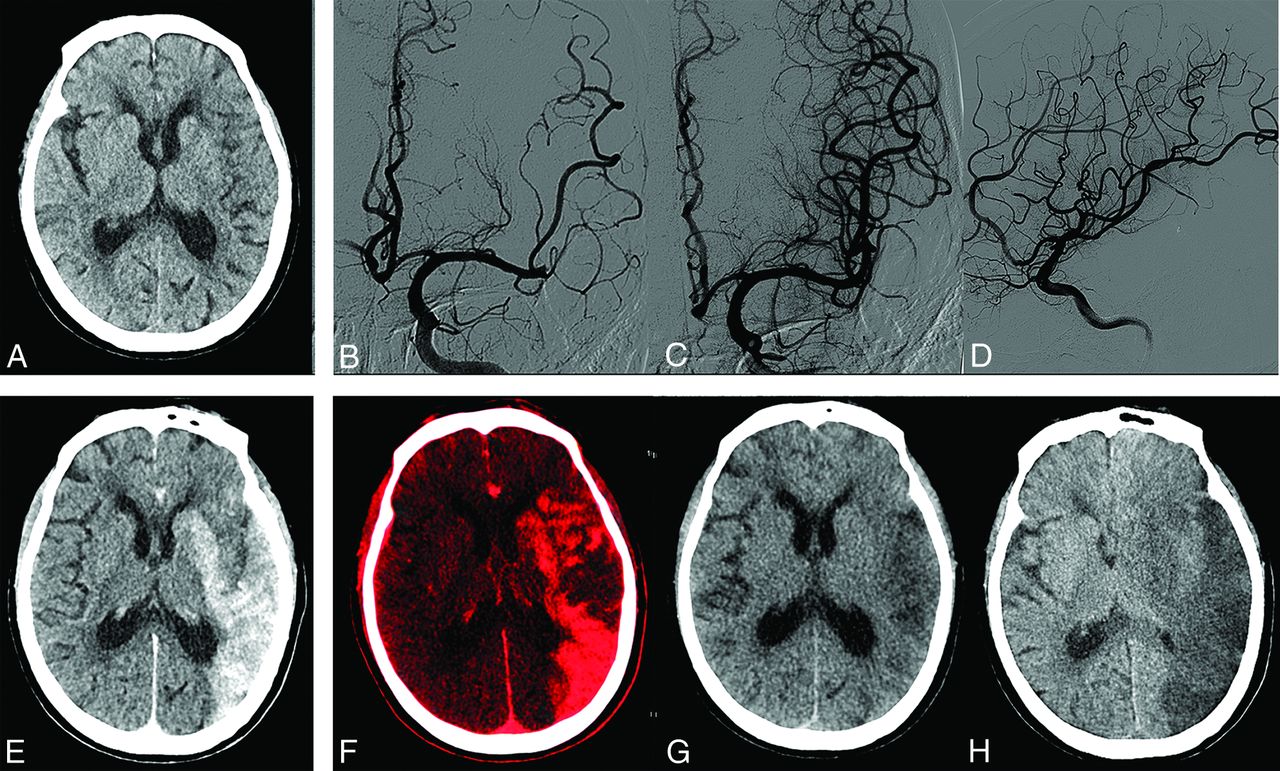
A 75-year-old woman with an ASPECTS of 7 on preprocedural CT (A). B, C, and D, Left M2 middle trunk occlusion with modified TICI 3 recanalization. E, Simulated conventional 120 kV(peak) images show hyperattenuation involving the left basal ganglia and temporal, frontal, and parietal lobes. F, Iodine overlay maps show contrast staining, with the AIIC (2.4 mg I/mL) and NICR (151.9%), respectively. G, Virtual noncontrast CT reveals no hemorrhage signs. H, Contrast staining resolved on 36-hour follow-up CT. Her 90-day mRS score was 4.

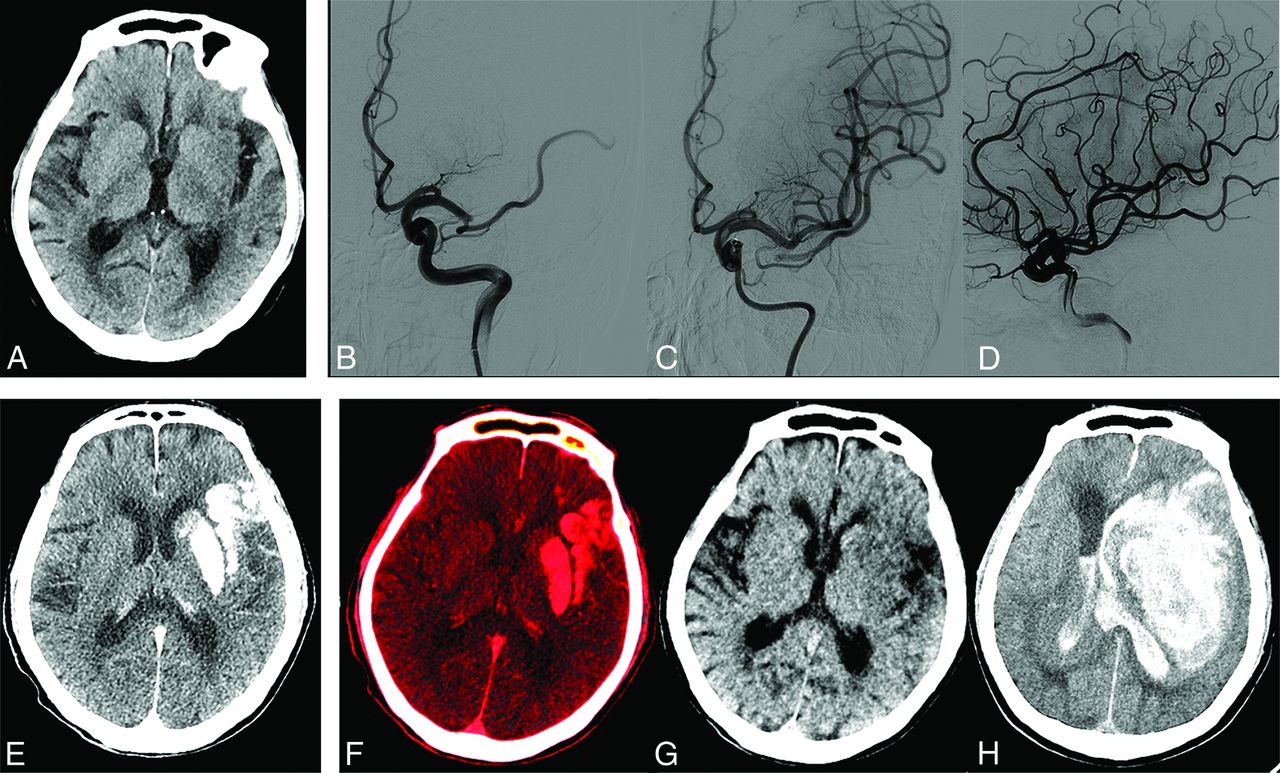
An 80-year-old man with an ASPECTS of 7 on admission CT (A). B, C, and D, Left M1 occlusion with modified TICI 3 recanalization. E, Simulated conventional 120 kV(p) images show contrast staining involving the left basal ganglia and temporal lobe. F, Iodine overlay maps show contrast staining, with the AIIC (4.9 mg I/mL) and the NICR (317.3%), respectively. G, Virtual noncontrast CT shows no hemorrhage signs in the area with hyperattenuation in simulated conventional 120 kV(p) images. H, Parenchymal hematoma type 2 develops with a marked midline shift on 24-hour follow-up CT. The patient died 6 days after recanalization (mRS score of 6).
Among the 95 patients with contrast staining, patients (37/95, 38.9%) with ICH development had no significant difference in baseline ASPECTS compared with those (58/95, 61.1%) without ICH development (P = .348). Patients with ICH development had lower regional leptomeningeal collateral scores (9.4 ± 4.6) than those without ICH development (11.8 [SD, 4.3]; P = .01). Apart from the difference in the presence of diabetes mellitus, no significant differences were found in the other clinical characteristics of the cohorts, including sex, age, hypertension, atrial fibrillation, baseline NIHSS score, MT duration, time of symptom onset to puncture, platelet count, hypersensitive C-reactive protein level, occlusion site, thrombectomy devices, attempts at aspiration or stent retriever placement, and treatment during hospitalization (P = .016). Table 2 presents the baseline clinical data of the cohorts with iodine staining with and without ICH. Patients with diabetes mellitus had a higher incidence of ICH (17/30, 56.7%) than those without diabetes mellitus (20/65, 30.8%) (P = .016).
Univariate analysis of patients’ baseline characteristics in cohorts with iodine staining without and with ICH (n = 95)
Imaging Analyses.
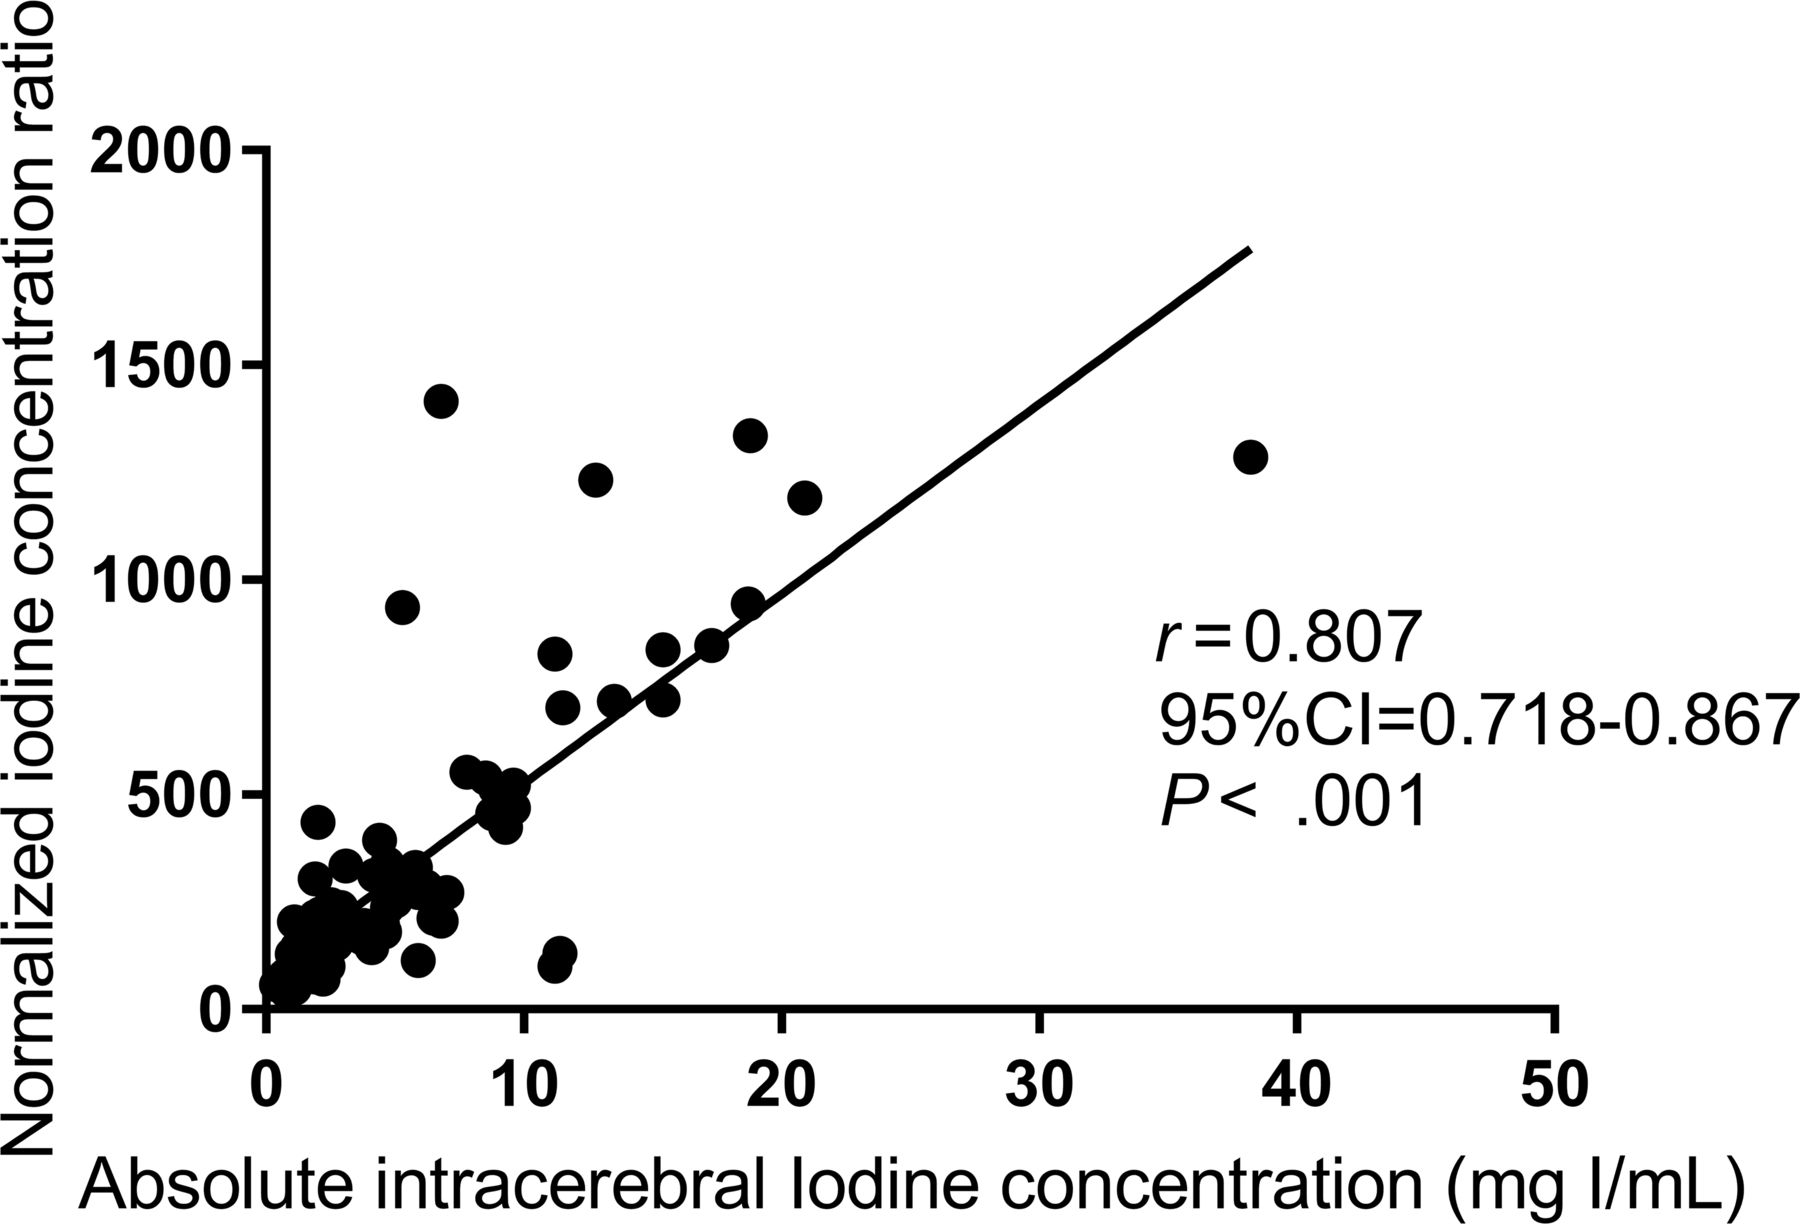
The median AIIC was 2.0 mg I/mL (IQR, 1.7–4.5 mg I/mL; range, 0.4–18.3 mg I/mL) in 58 patients with contrast staining without ICH development and 5.9 mg I/mL (IQR, 2.7–11.4 mg I/mL; range, 1.0–25.2 mg I/mL) in 37 patients who developed ICH, as seen on follow-up images. The 2 groups showed a significant difference (P < .001). The median NICR was significantly different between the cohorts: 144.5% (IQR, 105.8%–221.0%) in patients without ICH development versus 330.6% (IQR, 181.8%–703.3%) in patients with ICH development (P < .001). Of the 96 patients without ICH development among the total of 138 patients, 30.2% (29/96) had a 90-day mRS score of 4–6, which was significantly different from that in 57.1% of patients (24/42) with ICH development (P = .003) (Table 3). The AIIC was significantly correlated with the NICR (ρ = 0.807; 95% CI, 0.718–0.867) (Fig 5). The AUCs of the AIIC and NICR were 0.753 (95% CI, 0.652–0.837; P < .001) and 0.738 (95% CI, 0.638–0.823; P < .001), respectively, in identifying patients with ICH development. The DeLong test for analyzing the AUCs of the AIIC and NICR showed no significant differences between the groups (Z = 0.394, 95% CI,−0.006–0.09; P = .69). For identifying patients with ICH development, the cutoff NICR was 222.8% with a sensitivity of 67.6% and specificity of 76.4% (likelihood ratio, 2.355), and the cutoff AIIC was 2.7 mg I/mL with a sensitivity of 75.7% and specificity of 65.5% (likelihood ratio, 2.693). There was excellent agreement between the iodine concentrations obtained by the 2 readers. The intraclass correlation coefficient of the AIIC was 0.932 (P < .001) and that of the NICR was 0.942 (P < .001).

The NICR shows a strong correlation with the absolute intracerebral iodine concentration.
DECT parameters in groups without and with subsequent ICH
Subgroups Analyses.
Of the 95 patients with contrast staining, there were 52 (52/95, 54.7%) patients with ASPECTS of ≤8 and 43 (43/95, 45.3%) patients with ASPECTS of >8. Among patients with ASPECTS of ≤8, twenty-two patients (22/52, 42.3%) developed ICH. No ICH transformation was observed in the remaining 30 patients (30/52, 57.7%). In patients with ASPECTS > 8, there were 15 (15/43, 34.9%) patients with ICH development and 28 (28/43, 65.1%) patients without ICH development.
AIIC and NICR were significantly different in patients (ASPECTS ≤ 8) without ICH and in those (ASPECTS ≤ 8) with ICH (P = .008 and P = .018, respectively). AIIC and NICR were lower in patients (ASPECTS > 8) without ICH than that in patients (ASPECTS > 8) with ICH (P = .005 and P = .002, respectively). No significant differences were found in AIIC and NICR between the subgroups (ASPECTS >8 and ASPECTS ≤8) without ICH (P = .17 and P = .134, respectively). The same results were found in AIIC and NICR between the subgroups (ASPECTS > 8 and ASPECTS ≤ 8) with ICH (P = .225 and P = .28, respectively) (Online Supplemental Data).
No significant differences were seen in the AIIC and NICR between patients with hemorrhagic infarction type 1 and parenchymal hematoma. The AIIC was higher in patients with parenchymal hematoma type 2 development than in those with hemorrhagic infarction type 1 and parenchymal hematoma type 1 development (Table 4).
AIIC and NICR parameters in terms of the hemorrhage classification on the follow-up CT
DISCUSSION
In this study, we examined patients with small infarct areas at admission who underwent successful MT. Our findings suggest that the AIIC can be used to identify patients with ICH development. Similarly, the NICR could be used to reliably identify patients with hemorrhagic transformation in the same cohort. A significant correlation was observed between the AIIC and NICR (ρ = 0.807; 95% CI, 0.718–0.867; P < .001) without a significant difference in the AUCs in identifying patients with ICH development (P = .69). Patients who developed ICH, as seen on follow-up CT, had worse long-term outcomes than those without hemorrhagic transformation.
Our study demonstrates the capability of the AIIC in predicting ICH development. In vitro experiments have demonstrated that DECT could be used to quantify the iodine concentration through the iodine-based material decomposition algorithm.16 Quantitative iodine parameters, including stroke, trauma, metastases, tumors, and perfusion, have been widely used in clinical practice.12,17⇓⇓⇓⇓-22 Bonatti et al12 examined patients with acute ischemic stroke undergoing MT with DECT and reported an absolute iodine concentration of >1.35 mg I/mL in the maximum apparent attenuation area, thereby achieving a sensitivity of 100% and specificity of 67.5% in predicting ICH development. Our study also showed a significant difference in iodine concentration in postprocedural DECT between the 2 groups with and without ICH development, with a cutoff value of 2.7 mg I/mL. There was only a difference in the cutoff values for the two studies, which could be attributed to the different inclusion criteria between the 2 study samples. Our study included only patients with anterior circulation acute ischemic stroke with smaller infarct cores (ASPECTS ≥7) as well as patients with good recanalization. By contrast, the study by Bonatti et al included all patients with anterior and posterior circulation stroke without the ASPECTS criteria, and 18.8% (16/85) of the patients were unsuccessfully recanalized. These inclusion criteria might result in a difference in the cutoff value for predicting ICH development. Furthermore, the differences in the spectral separation in the scanners potentially played a role in the differences in cutoff values.
According to our study, both the AIIC and NICR could aid in postthrombectomy risk stratification in the case of hemorrhage, differing from the findings of the study by Byrne et al.13 To minimize the variability related to systematic differences in patients, we introduced the NICR to improve the sensitivity of quantifying the iodine contrast of lesions.16,20 Patel et al23 reported that normalized iodine quantification of the aorta was more helpful in differentiating renal vascular lesions from nonvascular lesions. Byrne et al13 investigated postprocedural patients with acute ischemic stroke using DECT. They reported that the NICR could be a reliable predictor of hemorrhagic transformation. This study suggested that an NICR cutoff value of >100% might be a better predictor of ICH development than the AIIC. According to our study results, patients with ICH had a higher NICR than those without hemorrhagic transformation. This result was consistent with that of the study by Byrne et al.13 However, regarding the difference in the AIIC among the cohorts, our conclusion was completely different from that of the previous study.13 Our findings indicated a notable difference in the AIIC between the cohorts with and without ICH development. The AIIC calculated in our study had a significant positive correlation with the NICR (ρ = 0.807). This result indicated that both the AIIC and NICR could be used to predict ICH development in risk stratification for postthrombectomy management. Furthermore, patients with parenchymal hematoma type 2 development had a higher AIIC than those with parenchymal hematoma type 1 and hemorrhagic infarction type 1 development, whereas no significant difference was observed in the NICR between the 2 groups.
The DECT examination performed within 1 hour after the procedure made the results relevant to neurologic outcomes. Endovascularly administered iodine contrast media circulated within the body and reached a balanced state of distribution throughout the body before the DECT examination. Ischemic and reperfusion injuries lead to endothelial dysfunction, resulting in iodine extravasation in the tissues of acute ischemic stroke after successful recanalization. This time interval between the iodine contrast injection and DECT examination may make iodine extravasation directly proportional to the severity of the BBB disruption, and iodine extravasation is not predominantly affected by systemic factors. This hypothesis sheds light on our findings, indicating that both the NICR and AIIC are related to the severity of BBB disruption, which results in ICH development after successful reperfusion.
According to the subgroup analyses of this study, the AIIC differed significantly between the groups (with the same ASPECTS) with and without ICH but did not differ between subgroups (ASPECTS of ≤8 and >8). Thus, the AIIC had a great impact on the development of ICH. The median AIIC in patients who did and did not develop ICH in this study (5.9 mg I/mL and 2.0 mg I/mL) was higher than that in the study by Byrne et al13 (1.2 mg/mL and 0.9 mg/mL), though similar patient inclusion criteria were applied (patients with baseline ASPECTS ≥ 7 and modified TICI scores of 2b or 3 after the procedure). Potential reasons may be the larger patient cohort examined in this study, different populations, and differences in spectral separation in the scanners. The use of 3 mutually perpendicular plane images to measure the AIIC in this study may have had the advantage of reducing the measurement bias.
The 90-day mRS scores of 4–6 were observed to be significantly different between patients with and without ICH development. This result was consistent with those of previous studies,24,25 indicating that hemorrhagic transformation seriously threatens the patients’ neurologic outcomes. Therefore, early identification of patients with a high risk of hemorrhagic transformation is essential for improving the prognosis of patients undergoing successful thrombectomy. Our study also found that the collateral status was significantly worse in patients with ICH than in those without ICH, similar to the results of previous studies.26
Our study has a few limitations. First, the sample size was small owing to the strict inclusion and exclusion criteria, leading to a potential source of bias. A multicenter study with a large sample size is needed to improve the level and quality of evidence. Additionally, ROIs were drawn subjectively within the areas of maximum apparent contrast staining, which might have resulted in measurement errors. However, averaging the values calculated from the 3 planes can resolve this issue. A high concordance was achieved among the readers. Finally, a follow-up examination was performed using NCCT within 48 hours. Contrast staining usually resolves within 24 hours after endovascular therapy.27 Unfortunately, persistent contrast staining may be seen beyond 48 hours in some cases.28 Follow-up DECT should be performed to avoid classifying persistent contrast staining as hemorrhagic transformation.
CONCLUSIONS
We examined DECT quantitative parameters as imaging markers for identifying patients with acute ischemic stroke with hemorrhagic transformation after successful recanalization. The power of the NICR in predicting hemorrhagic transformation was similar to that of the AIIC. Quantitative DECT parameters within 1 hour after successful MT may also help predict poor outcomes in patients. After successful MT, early risk stratification for ICH development can facilitate informed clinical decision-making and aid in predicting prognosis.
Footnotes
Dan Xu made an equal contribution to this study.
This work was funded by the Deyang City Science and Technology Research Foundation Grant No. 2022SCZ116.
Disclosure forms provided by the authors are available with the full text and PDF of this article at www.ajnr.org.
References
- Received June 3, 2022.
- Accepted after revision September 7, 2022.
- © 2022 by American Journal of Neuroradiology


