
Abstract
BACKGROUND AND PURPOSE: Currently, contrast-enhancing margins on T1WI are used to guide treatment of gliomas, yet tumor invasion beyond the contrast-enhancing region is a known confounding factor. Therefore, this study used postmortem tissue samples aligned with clinically acquired MRIs to quantify the relationship between intensity values and cellularity as well as to develop a radio-pathomic model to predict cellularity using MR imaging data.
MATERIALS AND METHODS: This single-institution study used 93 samples collected at postmortem examination from 44 patients with brain cancer. Tissue samples were processed, stained with H&E, and digitized for nuclei segmentation and cell density calculation. Pre- and postgadolinium contrast T1WI, T2 FLAIR, and ADC images were collected from each patient’s final acquisition before death. In-house software was used to align tissue samples to the FLAIR image via manually defined control points. Mixed-effects models were used to assess the relationship between single-image intensity and cellularity for each image. An ensemble learner was trained to predict cellularity using 5 × 5 voxel tiles from each image, with a two-thirds to one-third train-test split for validation.
RESULTS: Single-image analyses found subtle associations between image intensity and cellularity, with a less pronounced relationship in patients with glioblastoma. The radio-pathomic model accurately predicted cellularity in the test set (root mean squared error = 1015 cells/mm2) and identified regions of hypercellularity beyond the contrast-enhancing region.
CONCLUSIONS: A radio-pathomic model for cellularity trained with tissue samples acquired at postmortem examination is able to identify regions of hypercellular tumor beyond traditional imaging signatures.
ABBREVIATIONS:
- CD31
- cluster of differentiation 31
- CPM
- cellularity prediction map
- GBM
- glioblastoma
- IHC
- immunohistochemically
- MIB-1
- Mindbomb Homolog 1 index
- NGG
- non-GBM glioma
- RMSE
- root mean squared error
- TIC
- gadolinium-enhanced T1WI
High-grade primary brain tumors such as glioblastomas (GBMs) are associated with particularly dismal prognoses, with a mean survival rate of around 12–18 months postdiagnosis.1 Precise localization of tumor margins, currently performed using multiparametric MR imaging, is essential to maximizing the efficacy of surgical and radiation treatments for these tumors as well as monitoring tumor progression. T1WI acquired following injection with a gadolinium contrast agent (T1C) is used to identify regions where active tumor has disrupted the blood-brain barrier. Contrast enhancement is used to define the extent of the primary tumor region.2 Hyperintense regions on FLAIR images are thought to indicate a combination of tumor-related edema3⇓-5 and infiltrative nonenhancing tumor.6 Multi-b-value DWI is also typically included in glioma imaging protocols and is used to calculate quantitative ADC maps. These maps identify areas of restricted diffusion that may indicate either hypercellular tumor7⇓⇓-10 or coagulative necrosis.11
Tumor heterogeneity has been a recent focus in imaging studies of GBM. With noninvasive imaging, regional heterogeneity is readily measurable, but capturing heterogeneity with pathology samples is challenging. It can be achieved with en bloc resection12,13 or repeat sampling with image-guided biopsies. Each of these techniques requires properly aligning samples to their location on the imaging, which can be difficult due to the loss of orientation information during sectioning. Other issues such as brain shift during craniotomy and the inability to sample regions outside the suspected tumor region further complicate these strategies. Despite these challenges, pathologic measurement of tumor heterogeneity is crucial to improving the localization of multiple tumor pathologies as well as validating imaging signatures beyond the currently accepted tumor boundary.
Studies at postmortem examination have shown that viable tumor can exist as far as 10 cm beyond contrast enhancement, where heterogeneous pathologic features may confound traditional MR imaging interpretations.9,11,14 Due to the sampling limitations of biopsy samples, pathologic validation of the MR imaging signatures is warranted beyond the contrast-enhancing region and in the posttreatment state. This study used large tissue samples collected across the brain at postmortem examination to validate current imaging signatures as well as develop predictive tools to assess prospective tumor beyond the contrast-enhancing region. Specifically, this study tested the hypotheses that multiparametric MR imaging intensity values are associated with tumor cellularity at postmortem examination and that a radio-pathomic model trained on postmortem data can accurately identify regions of hypercellular tumor beyond traditional imaging signatures.
MATERIALS AND METHODS
Patient Population
This single-institution study was approved by the institutional review board of the Medical College of Wisconsin, and written, informed consent was obtained from each participant. A total of 44 consecutive patients with pathologically confirmed brain tumors were enrolled in this study. Subjects collected before 2021 have been retrospectively reclassified in concordance with the 2021 World Health Organization Classification standards for brain tumors.15 Patients underwent, on average, 1.55 operations, with 19 patients undergoing >1 operation and 3 patients undergoing no operation. Subjects included in this study partially overlap with small subsets used for prior articles.9,16,17 Clinical histories and demographic information are shown in Table 1. A diagrammatic representation of the tissue and the imaging data-collection process is shown in Fig 1.
Clinical and demographic summary for study samplea

Overview of the data-collection process. A, MR imaging data are collected from the patient’s final imaging session before death and coregistered, and T1, T1C, and FLAIR images are intensity-normalized. Tissue fixation and sampling involve the use of 3D printed brain cages and slicing jigs to preserve structural integrity relative to the MR imaging. Following staining, tissue samples are digitized for cellularity calculation using an automated nuclei segmentation algorithm. B, In-house software is used to align each tissue sample to the FLAIR image using manually defined control points and ROIs. C, Single-image cellularity associations are computed using mixed-effects models, and a bagging regression ensemble is trained to predict cellularity using 5 × 5 voxel tiles from each image using a two-thirds to one-third train-test split.
MR Image Acquisition and Preprocessing
T1, T1C, and FLAIR and DWI-derived ADC images collected from the patient’s last clinical imaging session before death were included for analysis (See the Online Supplemental Data for sample acquisition parameters). All images were rigidly aligned with each subject’s FLAIR image using the FMRIB Linear Image Registration Tool (http://www.fmrib.ox.ac.uk/fsl/fslwiki/FLIRT).18⇓-20 All nonquantitative images (T1, T1C, FLAIR) were intensity-normalized by dividing the voxel intensity by its whole-brain SD.21,22 Gray and white matter probability maps were computed using SPM12 (https://www.fil.ion.ucl.ac.uk/spm/software/spm12/).
Pathologic Feature Extraction
A total of 93 tissue samples were collected across all patients using previously described methods (See the Online Supplemental Data for further details).9,11,16 After digitization, images were processed using Matlab 2020b (MathWorks) to extract pathologic features for quantitative analyses. First, a color deconvolution algorithm was used to project color data in terms of relative stain intensities, resulting in an image with color channels representing hematoxylin, eosin, and residual color information.23,24 Images were then down-sampled by a factor of 10 to smooth color data for improved nuclei segmentation as well as to decrease processing time. Cell nuclei were highlighted by applying filters on each color channel to selectively identify positive hematoxylin staining, and individual nuclei were identified using Matlab’s regionprops function. Cell count was computed across 50 × 50 superpixels and converted to cells per square millimeter. Segmentations for extracellular fluid and cytoplasm were computed and converted to proportions of the superpixel occupied by the component of interest. All segmentations were visually inspected for quality assurance, and sample segmentations are provided in the Online Supplemental Data.
MRI-Histology Coregistration
Previously published in-house software (written in Matlab) was used to precisely align histology images to each patient’s clinical imaging (See the Online Supplemental Data for further details).9,11,16,25,26 Voxel intensity values from T1, T1C, FLAIR, and ADC images as well as cellularity values for each studied voxel were then collected across the aligned tissue sample area and used for subsequent analyses. Across all 93 samples, a total of 578,668 voxels were included. All MR imaging and histology data were then sampled to the most common cross-sectional MR imaging dimensions (matrix size = 512 × 512, voxel size = 0.4397 × 0.4397 mm).
Statistical Analyses
Single-Image Analyses.
Linear mixed-effects models were used to quantify associations between MR imaging values and cellularity. Image intensity was included as a main effect, with time between the last MR imaging and patient death (in days) and gray/white matter probability included as covariates. Patient number was included in the model to account for patient-specific confounds. Regression coefficients and R2 values (conditional and marginal) were reported to quantify the relationship between MR imaging intensity and cellularity in terms of slope and explained variance, respectively.
To specifically compare diagnosis-level differences in the relationship between MR imaging intensity and cellularity, we computed similar mixed-effects models for each image type, including a term for the interaction between image intensity and diagnosis, with diagnostic groups corresponding to GBM, non-GBM glioma (NGG), and Other. The Other category consisted of 1 patient with brain metastases originating from the colon and 1 patient with a classically hypercellular diffuse large B-cell lymphoma. Both patients did not receive treatment for their brain tumors and can thus provide a proxy for radiologic-pathologic relationships in the untreated state. Due to the large number of observations relative to the patient-level data set size, P values were considered a poor measure of meaningful significance (all P < .00001). Therefore, measures of effect size are reported for this subanalysis. Analogous models were also calculated for extracellular fluid and cytoplasm as the dependent variables to examine other cellular factors that may drive imaging values, which are presented in the Online Supplemental Data.
Radio-Pathomic Modeling.
A random forest ensemble algorithm was used as the framework for developing a radio-pathomic model of cellularity in 30 subjects. Specifically, a bootstrap aggregating (bagging) model was used (100 learning cycles, learn rate = 1), which fits independent weak learners across several independent bootstrapped samples from the training data set to obtain a combined ensemble model that minimizes variance across learners.27,28 Inputs for this model were intensity values from 5 × 5 voxel tiles across each image to incorporate spatial and contextual information. The models were then applied to MRIs from 14 held out test set subjects to test generalizability (Table 2). Performance was quantified using root mean squared error (RMSE) values. Predictions were then plotted for test set subjects to assess successful identification of hypercellularity beyond traditional imaging signatures, defined for this study as a substantial relative increase in cell density compared with the surrounding tissue and corresponding area on the contralateral hemisphere. Due to the inter- and intratumoral heterogeneity of the tumors included in this study, an absolute threshold for tumor-related hypercellularity could not be defined, though relative hypercellularity estimations aligned well with pathologically identified regions of tumor on a subset of samples used for validation (Online Supplemental Data).
Clinical and demographic summary for training and test set groupsa
RESULTS
Single-Image Analyses
Mixed-effects model results for the single image analyses are presented in Fig 2. T1, T1C, and FLAIR images demonstrated positive associations with cellularity (T1 β = 160.23 [5.11], conditional R2 = 0.35, marginal R2 = 0.012; T1C β = 480.60 [4.00], conditional R2 = 0.44, marginal R2 = −0.074; FLAIR β = 152.50 [3.12], conditional R2 = 0.34, marginal R2 = 0.010). ADC values demonstrated a negative association with cellularity (β = −153.72 [5.45], conditional R2 = 0.34, marginal R2 = 0.008). When we split data by diagnostic group (GBM versus NGG versus Other), stronger relationships between image intensity and cellularity were observed for NGG and Other patients across each image except the precontrast T1, with the largest diagnostic discrepancy seen in the ADC-cellularity relationship (T1 β = 135.56 [4.10], conditional R2 = 0.15, marginal R2 = 0.014; T1C β = 615.22 [3.76], conditional R2 = 0.30, marginal R2 = 0.126; FLAIR β = 277.51 [2.83], conditional R2 = 0.18, marginal R2 = 0.036; ADC β = 168.24 [2.84], conditional R2 = 0.16, marginal R2 = 0.016). The GBM group showed an opposite-direction relationship compared with the Other group for the precontrast T1 intensity, with only a subtle relationship seen in the NGG group.

Single-image results depicting the relationship between image intensity and cellularity for each contrast. β values for the left-handed plots indicate the change in cellularity per SD increase in image intensity and indicate positive associations for T1, T1C, and FLAIR, with the expected negative association between ADC and cellularity present. β values for the right-handed plots indicate the difference in slope among patients with GBM and NGG and Other patients, indicating that patients with GBM show less pronounced cellularity associations than patients with NGG across all image types, with the exception of T1 intensity.
Radio-Pathomic Mapping
A summary of model performance, including training and test set RMSE values and a scatterplot summarizing sample prediction values, is provided in Fig 3. Overall training and test set RMSE values (389 and 1015 cells/mm2, respectively) show some degree of overfitting regarding the training data set, but they generally indicate accurate prediction of cellularity. A small subset of subjects also performed worse than the general test set, as indicated by the high RMSE outliers in Fig 3. The scatterplot, which demonstrates sample predictions in terms of T1SUB (T1C–T1), FLAIR, and ADC intensity values, shows indications of expected relationships (ie, FLAIR-ADC mismatch associated with hypercellularity) but also shows that traditional hypercellularity signatures are often nonspecific. Sample predictions for test set subjects are included in Fig 4, in which cellularity predictive maps (CPM) for the whole brain are provided with the clinical images for each patient, as well as the pathologic ground truth from the aligned postmortem slide. These sample predictions show that the CPMs calculated from the radio-pathomic model accurately predict several regions of increased cellularity beyond the traditional contrast-enhancing region and discriminate between hypercellular and nonhypercellular regions within contrast enhancement. Additionally, a tissue sample from a region of predicted hypercellularity beyond contrast enhancement on a 64-year-old man’s test set subject (diagnosed with a GBM) was sampled and immunohistochemically (IHC) stained to confirm the presence of active tumor (Fig 5). Specifically, Ki-67 staining, which is used to calculate the Mindbomb homolog-1 Index (MIB-1 index) as a measure of mitotic activity, and cluster of differentiation 31 (CD31), which stains positive in regions of angiogenesis, were collected in addition to standard H&E staining. Sample MR images and CPMs are presented for the test set subject designated for IHC analysis, along with tissue maps indicating the MIB-1 index, positive CD31 staining, and actual cellularity. The CPM identifies a region of hypercellularity toward the perimeter of the posterior FLAIR hyperintense region of the left hemisphere, outside the T1 contrast enhancement. The tissue-derived cellularity map confirms the presence of hypercellularity in this region, with MIB-1 staining indicating high mitotic activity in the left-handed portion of the hotspot and positive CD31 staining indicating increased angiogenesis throughout the hotspot, confirming likely tumor presence.

A, Subject-level RMSE values for the training and test data sets. Despite some degree of overfitting, the test set RMSE indicates that the radio-pathomic model is able to accurately predict cellularity across most subjects. B, Sample predictions for test set imaging values presented in terms of their T1SUB, FLAIR, and ADC intensity values. Patterns suggest the presence of traditional imaging signatures but also indicate the lack of specificity for these signatures with regard to hypercellularity. TISUB indicates T1C–T1.

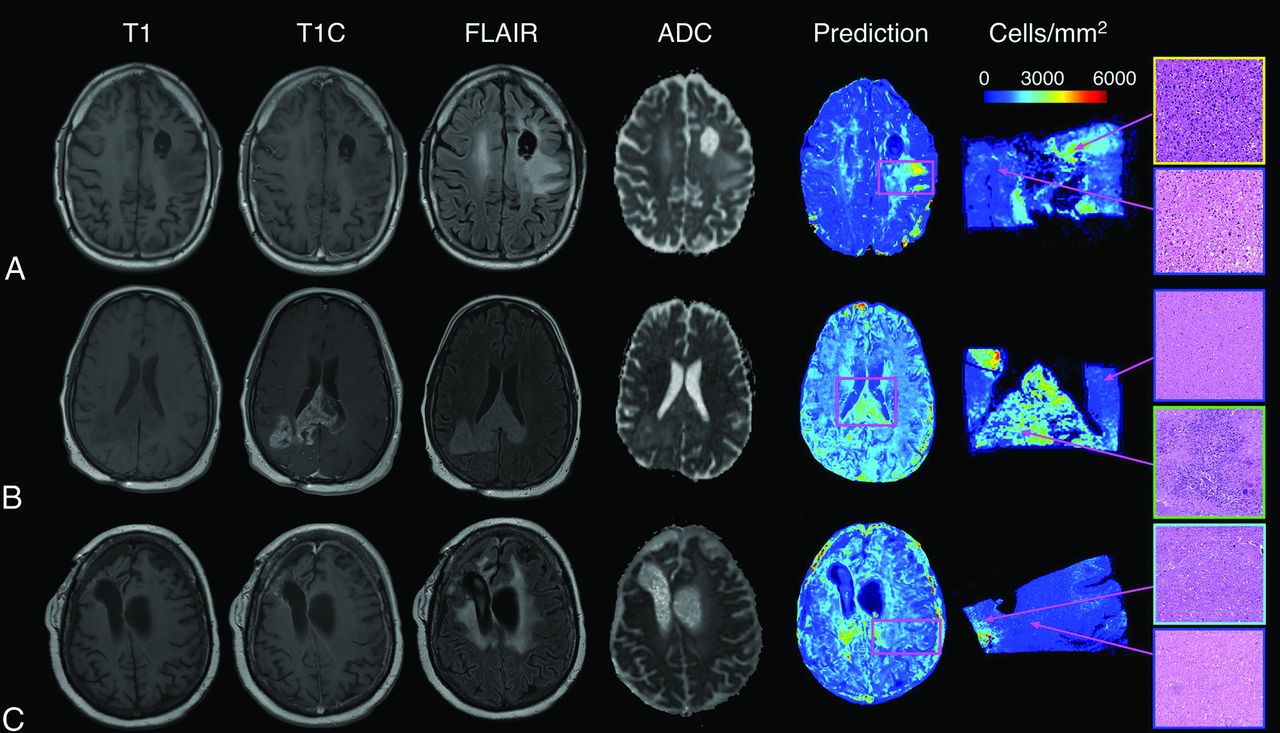
Sample predictions for 3 representative subjects, including a 43-year-old man diagnosed with a grade III anaplastic astrocytoma (A), a 48-year-old man diagnosed with a GBM (B), and a 31-year-old woman diagnosed with a grade III anaplastic astrocytoma (C). These predictions indicate that the radio-pathomic model is able to predict regions of hypercellularity beyond the contrast-enhancing region as well as in the absence of restricted diffusion on the ADC image.

IHC staining for a nonenhancing region of predicted hypercellularity outside of contrast enhancement (a 64-year-old man diagnosed with GBM). The ROI corresponds to an actual region of hypercellularity seen on H&E staining as well as portions of high MIB-1 index and CD31 positivity. These molecular features indicate that this CPM-identified region contains active, proliferating tumor beyond the contrast-enhancing region. CPM indicates cellularity prediction map.
DISCUSSION
By means of tissue samples taken at postmortem examination aligned to the patients’ clinical imaging, this study assessed relationships between imaging and pathology in the posttreatment state, as well as beyond the contrast-enhancing region. Linear mixed-effects model–based analyses of image intensity values found that single-image signatures explain a relatively small proportion of cellularity variance. Additional analyses found an effect of tumor type on the cellularity-intensity relationship, with reduced cellularity associations seen in patients with GBM compared with those with NGG across all image types. We developed a radio-pathomic model using a bagging ensemble architecture, which predicted cellularity accurately on withheld subjects, despite performing less reliably in a small subset of cases. The model accurately predicted regions of hypercellularity beyond contrast enhancement and other traditional imaging signatures, and IHC staining confirmed the presence of tumor within nonenhancing hypercellularity.
The general trends for increased cellularity associated with increased contrast enhancement and FLAIR intensity support the notion that these features relate to the pathologic effects of the tumor. However, these features failed to account for most cellularity variance and, in some cases, failed to identify regions of hypercellular tumor. Past studies have particularly highlighted ADC values as a correlate for cellularity. This study finds evidence of this negative association, though the strength of this relationship is more subtle in comparison with previous studies. Previous studies have suggested that radiation therapy and other treatments may influence these signatures because induced necrosis may confound traditional interpretations of these features.29,30 Diagnostic factors may play a role here as well because the results of this study show that GBM cases, which present with a wide range of pathologic characteristics, have less pronounced relationships between cellularity and imaging values than their lower-grade, more pathologically homogeneous counterparts.31⇓-33 Further studies probing the effects of different treatments and tumors on imaging characteristics may be able to further delineate these discrepancies between hypercellular and visually identifiable tumor. Particularly, studies comparing radio-pathomic signatures between patients who have and have not received treatment postsurgery could indicate how the relationship between MR imaging and pathology deviates in the treated state from that of the natural progression of glial tumors. Future studies modeling treatment duration and timing are warranted.
The performance statistics for our radio-pathomic model suggest that our model can accurately assess tumor cellularity in patients with brain cancer. Most subjects in the test set had a RMSE within an SD of each subject’s cellularity, indicating that the model has the capacity to generalize to unseen data. These results thus demonstrate the feasibility of developing radio-pathomic models for pathologic features using postmortem tissue data, which have the added benefits of larger sampleable tissue areas and the presence of treatment-related effects. Sample whole-brain CPMs indicate that the radio-pathomic model can highlight regions of hypercellularity beyond contrast enhancement, suggesting that radio-pathomic modeling may provide improved localization of hypercellular tumor areas in the posttreatment setting. Posttreatment modeling is critical for tracking longitudinal tumor development in a clinical setting because models that can account for the effects of various treatments on imaging signature will provide more reliable estimates of tumor presence than those developed in the absence of treatment. Studies mapping genetic signatures associated with treatment resistance, immune response, and treatment receptivity using these techniques may even be able to noninvasively distinguish among areas of tissue that would benefit from different treatment types. Additionally, future studies with larger samples might use these maps to track differences in more specific brain cancer subtypes, such as monitoring nonenhancing behavior and the hypercellular growth rate between glioblastoma and other high-grade gliomas.
The CPMs generated from this radio-pathomic model provide early insight into clinical uses for noninvasive imaging models for pathologic information collected at postmortem examination. By using commonly acquired clinical scans (T1, T1C, FLAIR, ADC), this model can provide predictions on retrospective data as well as predict cellularity in future subjects without adding additional scan time to a patient’s clinical MR imaging acquisition. However, less common add-on acquisitions measuring perfusion, spectroscopy, and chemical exchange saturation transfer properties have shown great promise in identifying pathologic signatures of tumors, and it is likely that including these images in future studies may improve our models further.
Limitations
While the results of this study are promising, there are several limitations that warrant noting. This study developed voxelwise predictions across hundreds of thousands of observations, though the subject-level sample size is still small by machine learning standards. Additionally, cellularity was used as the ground truth measurement for this study due to its quantitative, calculatable nature. However, hypercellularity is a nonexclusive and indirect marker of tumor pathology, and future studies focused on predicting actual tumor presence may be better suited to distinguishing tumor hypercellularity from features like immune response. Likely, the largest contributing factor to the limits of this study is the time between MR imaging acquisition and tissue collection. While we statistically controlled for this factor, it is possible that confounding effects such as tumor growth within this period may influence the results beyond statistical covariance. While it is feasible to perform MR imaging on the postmortem brain to circumvent this time delay, changes in tissue perfusion and properties resulting from brain extraction and fixation would make the radio-pathomic model difficult to generalize to in vivo imaging. These specific weaknesses are avenues for future research, in which the delay between the time of death and final MR imaging are modeled extensively.
CONCLUSIONS
This study evaluated multiparametric MR imaging signatures of brain tumor pathology and developed a radio-pathomic model for brain cancer using machine learning. Our predictive maps of tumor cellularity highlighted tumor beyond conventional boundaries and plausibly tracked tumor growth using longitudinal imaging. We hope that these algorithms may be useful in the future for treatment planning and tumor monitoring.
Acknowledgments
We would like to thank our patients for their participation in this study, the Medical College of Wisconsin Machine Learning Working Group for helpful feedback and discussions, and our funding sources.
Footnotes
This work was supported by the American Brain Tumor Association, Grant DG160004; the Froedtert Foundation; the Strain for the Brain 5K Run, Milwaukee, Wisconsin; and National Institutes of Health/National Cancer Institute grants, R01CA218144, R01CA218144-02S1, R21CA231892, and R01CA249882.
Paper previously presented, in part, at: Annual Meeting of the Society for Neuro-Oncology, June 8, 2020; Austin, Texas; and Annual Meeting of the International Society for Magnetic Resonance in Medicine, May 2021; Virtual.
Disclosure forms provided by the authors are available with the full text and PDF of this article at www.ajnr.org.
Indicates open access to non-subscribers at www.ajnr.org
References
- Received October 8, 2021.
- Accepted after revision February 7, 2022.
- © 2022 by American Journal of Neuroradiology


Jump to section
Related Articles
Cited By...
- Non-invasive tumor probability maps developed using autopsy tissue identify novel areas of tumor beyond the imaging-defined margin
- Cellular Density in Adult Glioma, Estimated with MR Imaging Data and a Machine Learning Algorithm, Has Prognostic Power Approaching World Health Organization Histologic Grading in a Cohort of 1181 Patients
- Non-invasive tumor probability maps developed using autopsy tissue identify novel areas of tumor beyond the imaging-defined margin