
Abstract
BACKGROUND AND PURPOSE: Accurate quantification of WM lesion load is essential for the care of patients with multiple sclerosis. We tested whether the combination of accelerated 3D-FLAIR and denoising using deep learning–based reconstruction could provide a relevant strategy while shortening the imaging examination.
MATERIALS AND METHODS: Twenty-eight patients with multiple sclerosis were prospectively examined using 4 implementations of 3D-FLAIR with decreasing scan times (4 minutes 54 seconds, 2 minutes 35 seconds, 1 minute 40 seconds, and 1 minute 15 seconds). Each FLAIR sequence was reconstructed without and with denoising using deep learning–based reconstruction, resulting in 8 FLAIR sequences per patient. Image quality was assessed with the Likert scale, apparent SNR, and contrast-to-noise ratio. Manual and automatic lesion segmentations, performed randomly and blindly, were quantitatively evaluated against ground truth using the absolute volume difference, true-positive rate, positive predictive value, Dice similarity coefficient, Hausdorff distance, and F1 score based on the lesion count. The Wilcoxon signed-rank test and 2-way ANOVA were performed.
RESULTS: Both image-quality evaluation and the various metrics showed deterioration when the FLAIR scan time was accelerated. However, denoising using deep learning–based reconstruction significantly improved subjective image quality and quantitative performance metrics, particularly for manual segmentation. Overall, denoising using deep learning–based reconstruction helped to recover contours closer to those from the criterion standard and to capture individual lesions otherwise overlooked. The Dice similarity coefficient was equivalent between the 2-minutes-35-seconds-long FLAIR with denoising using deep learning–based reconstruction and the 4-minutes-54-seconds-long reference FLAIR sequence.
CONCLUSIONS: Denoising using deep learning–based reconstruction helps to recognize multiple sclerosis lesions buried in the noise of accelerated FLAIR acquisitions, a possibly useful strategy to efficiently shorten the scan time in clinical practice.
ABBREVIATIONS:
- AVD
- absolute volume difference
- dDLR
- denoising using deep learning–based reconstruction
- DSC
- Dice similarity coefficient
- HD
- Hausdorff distance
- MS
- multiple sclerosis
- PPV
- positive predictive value
- TPR
- true-positive rate
Multiple sclerosis (MS) is the most common inflammatory disease of the central nervous system affecting young patients,1 in which demyelination mediated by autoimmune mechanisms is spatially and temporally disseminated. MR imaging plays an essential role not only in the initial diagnosis of MS2 but also in regular monitoring as a sensitive marker of disease activity for promptly switching therapy if progression is observed.3 Life-long imaging follow-up is, therefore, required for most patients with MS. A short examination time is necessary to improve the patient’s comfort and to cope with the high number of demands in imaging centers.
3D-FLAIR imaging is considered the core sequence for diagnosis and monitoring of MS and has been shown to provide better diagnostic performance than 2D sequences,4 explaining why 3D acquisitions are now recommended by international guidelines.5,6 In return for its high sensitivity, 3D acquisition comes at the expense of a longer scan time, which can be mitigated by acceleration techniques, such as the partial Fourier technique,7 parallel imaging,8 simultaneous multislice imaging,9 or, more recently, compressed sensing.10 These techniques are still being improved; however, the image quality inevitably decreases due to reduced k-space sampling. As the images become noisy, the accuracy of lesion detection could be affected. Therefore, one of the central objectives was to remove noise associated with image-acquisition acceleration to maintain high image quality for accurate lesion identification. Although several denoising methods take the complexity of MR imaging artifacts into account, 1 critical drawback of these sophisticated denoising methods is the processing time, which makes them not easily applicable in routine clinical practice.
Artificial intelligence is now providing new solutions with denoising algorithms based on deep learning, enabling instant execution.11 New generations of MR imaging with the denoising using deep learning–based reconstruction (dDLR) are now becoming available on commercial magnets,12-15 with the goal of accurately removing the noise associated with higher-resolution acquisitions or with significantly shorter scan times. Such dDLR is rapidly growing, but at the same time, its validity in clinical settings has not yet been well-investigated, and how these methods could impact the detectability of lesions for radiologists is unknown. Before adoption, it is mandatory to validate such effects on pathologic lesion detection and to quantify possible false-positives or negatives. Therefore, in this research study, we tested whether the combination of accelerated 3D-FLAIR and dDLR could provide a relevant strategy to monitor the WM lesion load of patients with MS with shorter examinations.
MATERIALS AND METHODS
Study Population
The study prospectively recruited 31 participants with MS who were followed at Centre Hospitalier Universitaire de Bordeaux in 2020 and 2021. The inclusion criterion was to have a confirmed relapsing-remitting form of MS according to the 2017 McDonald criteria.2 The exclusion criteria were MR imaging examination contraindications and other concomitant neurologic disorders. One patient with a low lesion load had no more visible brain lesions under treatment, and 2 patients did not properly complete the MR imaging; thus, we evaluated 28 participants in this analysis. The institutional ethics committee approved the protocol, and all participants provided written informed consent.
Image Acquisition
Imaging examinations were performed on a 3T scanner (Vantage Galan 3T/ZGO; Canon Medical Systems) with a 32-channel phased array head coil. The acquired sequences included a 3D T1WI and 4 implementations of 3D variable flip angle FLAIR sequences with decreasing scan times that we will call “standard FLAIR” (4 minutes 54 seconds), “fast FLAIR” (2 minutes 35 seconds), “ultrafast FLAIR” (1 minute 40 seconds), and “shortest FLAIR” (1 minute 15 seconds). Acceleration was obtained with parallel imaging and with a progressive decrease in the TR along the 4 different implementations. The corresponding TI values were adjusted accordingly to maintain CSF nulling based on simulations of the magnetization of 3D-FLAIR that we conducted in Matlab (MathWorks) using T1/T2 values of CSF from the literature.16,17 Spatial resolution was identical for the 4 FLAIR sequences (see the Table for details of scan parameters).
Parameters of MR imaging acquisitions
dDLR was directly available in the scanner as a product called advanced intelligent clear-IQ engine (AiCE) and developed by Canon. The dDLR method has been described in detail by Kidoh et al14 and is based on a “plain” convolutional neural network (CNN) that performs denoising by learning noise thresholds in the high-frequency components extracted from images by a discrete cosine transform. The algorithm has been originally trained on pairs of high SNR ground truth images collected on healthy subjects (10 average repetitions) and noisy input images (generated by adding various amounts of noise on the ground truth). After data augmentation, 32,400 image pairs were used for the training of the dDLR. In our study, each FLAIR sequence was processed once with dDLR (<1 minute of reconstruction time) and another time with conventional reconstruction, which will be referred to as “with or without dDLR.” Therefore, 8 FLAIR sequences were available per patient, corresponding to a total of 224 FLAIR sequences for the 28 patients.
Image Analyses
To create the ground truth segmentation of MS lesions, 2 senior neuroradiologists (with 14 and 12 years of experience) manually delineated MS lesions in collaboration on the standard FLAIR sequence using 3D Slicer software (www.slicer.org).18 Each segmentation was first performed by 1 of these 2 experienced readers and carefully and independently checked by the second, who could correct any missing lesions. We considered this segmentation the criterion standard against which the other segmentations were evaluated.
To evaluate the impact of combining “image acceleration + dDLR” on the radiologist, the 2 neuroradiologists and another reader (a radiology resident with 5 years of experience and expertise in neuroimaging) blindly evaluated the overall image quality of the 224 FLAIR sequences. The sequences were presented in random order to limit possible bias, especially between images processed with or without dDLR. Qualitative aspects of the sequences were assessed using a 5-point Likert-type scale: ++, +, 0, −, −−, where 0 stands for the image quality that can be used for diagnostic purpose in clinical settings, while + and − stand for higher and lower quality, respectively.
Then, MS lesions of the 224 FLAIR sequences were manually and section-by-section delineated by the third reader during random presentation under 3D Slicer. Automatic segmentation was also conducted independently using the lesionBrain module,19 which is freely available on the volBrain platform20 (https://www.volbrain.upv.es).
Performance Metrics for Evaluation
Several metrics are usually evaluated to assess the performances of segmentation methods, such as the index of similarity, voxelwise metrics, and lesion-wise metrics.21
Therefore, we first computed the relative absolute volume difference (AVD):
 where |A| represents the volume of MS lesions from the sequence under evaluation, GS is the volume of MS lesions from the criterion standard, and abs means the absolute value.
Second, we computed the following overlap metrics (voxelwise metrics) to quantify the contour similarity between 1 segmentation and the criterion standard: positive predictive value (PPV), true-positive rate (TPR), Dice similarity coefficient (DSC), and the 95th percentile of Hausdorff distance (HD). These metrics are defined as follows:


 where TP, FP, FN represent the numbers of voxels that are true-positive, false-positive, and false-negative, respectively. Dist refers to Euclidean distance.
Finally, to understand whether all the MS lesions were detected, independent of the delineating precision, we computed the connected components of GS and A (lesion-wise metrics). We adopted the F1 score (F1) as follows:

 where TPGS is lesions of A among the lesions in GS that are correctly detected by A, TPA is—vice versa—overlapped lesions of GS among the lesions of A, SeL is lesion sensitivity, and PL is the lesion positive predictive value for individual lesions. Lesion counting and labeling were performed using the multidimensional image processing (ndimage) submodule in the sciPy library (Version 1.7.0, www.scipy.org). Then, the overlapping labels between GS and A were counted to compute TPGS and TPA.
Before computing these metrics, all FLAIR images were coregistered to the individual 3D-T1WI sequences using the FMRIB Linear Image Registration Tool (FLIRT; http://www.fmrib.ox.ac.uk/fsl/fslwiki/FLIRT) program to minimize the positional displacement during the scan.
Statistical Analyses
All statistical analyses were performed with R software (Version 4.1.0; www.r-project.org). First, the interreader agreement among the 3 readers for image quality was analyzed by the Kendall Concordance Coefficient W. Then, we considered 2 factors: the type of FLAIR sequence (standard, fast, ultrafast, shortest) and the type of reconstruction (without or with dDLR). For the Likert scale, which is a categoric metric, the effects of the type of reconstruction were tested with the Wilcoxon signed-rank test. For AVD, TPR, PPV, DSC, HD, and F1 scores, we used nonparametric repeat 2-way ANOVA with the aligned rank transform procedure from the package ARTool (Version 2.1.0; https://depts.washington.edu/acelab/proj/art/).22 Post hoc tests were conducted with a Wilcoxon signed-rank test, especially to evaluate the impact of dDLR. Finally, to confirm the similarity of metrics between the standard FLAIR and accelerated FLAIR with dDLR, we used a nonparametric version of the equivalence test implemented in the package “EQUIVNONINF” (Version 1.0; https://cran.r-project.org/package=EQUIVNONINF). P value corrections were always performed with the Holm method.
RESULTS
Demographics of Participants
The participants ranged from young to middle-aged (mean, 41 years of age; range, 24–56 years) and had a median disease duration of >10 years. Most patients (96.4%) underwent second-line natalizumab disease-modifying treatment and were recruited during one of the monthly perfusions. None of them had experienced any recent relapse, and the median Expanded Disability Status Scale score was 2.0. The characteristics are summarized in the Online Supplemental Data.
Visual Assessment of Image Quality
The agreement among the 3 readers for image quality with the 5-point Likert scale was substantial (Kendall W = .82). We observed a deterioration in image quality by reducing the scan time (P < .001, P < .001, and P < .001 for standard versus fast, fast versus ultrafast, ultrafast versus shortest FLAIR, respectively) (Fig 1A). Notably, rapid sequences (fast, ultrafast, and shortest FLAIR) scored lower than the acceptable quality without dDLR but significantly improved their appearance with dDLR (P < .001, P < .001, P < .001, P < .001 for standard, fast, ultrafast, and shortest FLAIR, respectively). The visual quality of fast and ultrafast FLAIR with dDLR even recovered up to more than the acceptable quality. The shortest FLAIR with dDLR was still inferior to the acceptable quality, but some ultrafast images improved to a score of 0 or +1. Compared with standard FLAIR without dDLR, fast FLAIR with dDLR was better (P < .01).

A, Boxplots of image-quality evaluation. The median values are connected with dotted lines. dDLR generally improved the image quality. Even images of inferior quality were retrieved to moderate quality. B, Representative reconstructed axial slices of the different FLAIR acquisitions without (upper row) and with dDLR (lower row). The amount of noise and the progressive shadowing of lesions when the scan time decreased can be appreciated. One, 2, and 3 asterisks indicate P < .05, P < .01, and P < .001, respectively.
Quantitative Results
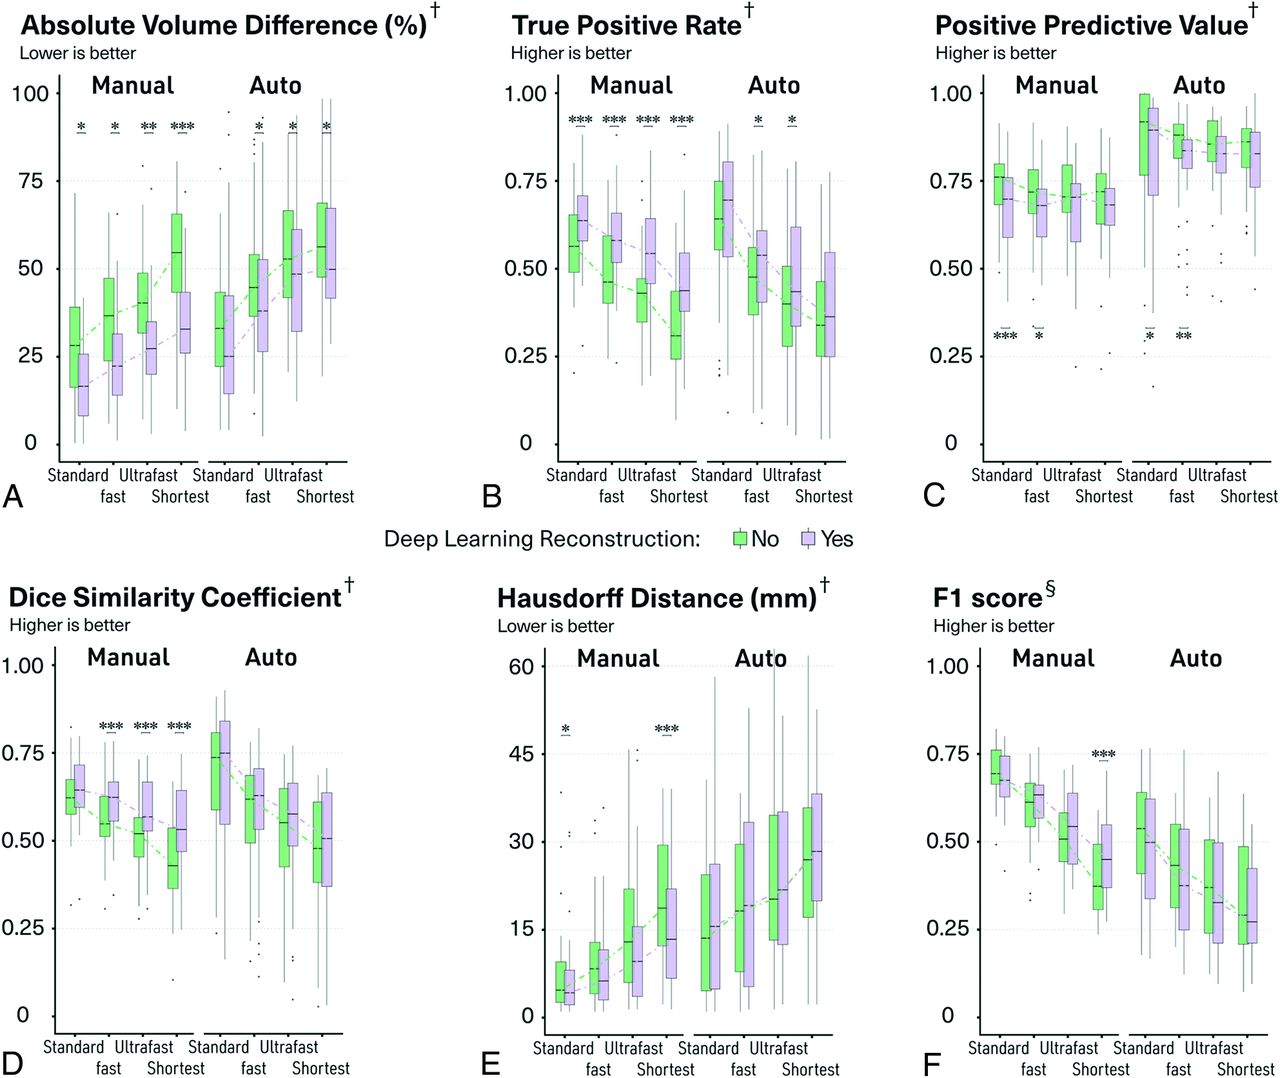
Regarding manual delineation of the MS lesions, the 2-way ANOVA showed that both the type of FLAIR sequence and the type of reconstruction significantly affected the segmentations (P < .001 in all the cases) but without any significant interaction (Fig 2 and Online Supplemental Data). PPV was the only metric not significantly affected by the type of FLAIR sequence.

Boxplots of quantitative metrics to evaluate the manual and automatic segmentation. The median values are connected with dotted lines. One, 2, and 3 asterisks indicate P < .05, P < .01, and P < .001, respectively, for post hoc paired comparisons with Wilcoxon signed-rank test after 2-way ANOVA with the aligned rank transform procedure. † indicates voxelwise metric; §, lesion-wise metric.
The differences in terms of segmentation volumes compared with the criterion standard progressively increased with the shorter FLAIR sequences. Nevertheless, dDLR significantly reduced such differences in all cases (P = .038, P = .022, P < .01, P < .001 for standard, fast, ultrafast, and shortest FLAIR, respectively; Fig 2A). Such lower volume differences compared with the criterion standard were mainly driven by a reduction in false-negative voxels, as indicated by a significant improvement in TPR in all cases (P < .001, P < .001, P < .001, P < .001 for standard, fast, ultrafast, and shortest FLAIR, respectively; Fig 2B). There were also more voxels considered false-positives with dDLR for the standard and fast FLAIR as indicated by a significant reduction in the PPV (P < .001 and P = .047 for standard and fast FLAIR, respectively; Fig 2C), but this effect was less pronounced than that on TPR. The DSC was essential to analyze because it is a composite metric attempting to summarize all such influences onto a single scalar measure. The DSC progressively decreased with shorter FLAIR sequences, but dDLR significantly improved the DSCs in all cases (P < .001, P < .001, P < .001 for fast, ultrafast, and shortest FLAIR, respectively; Fig 2D), also in line with shorter HD (Fig 2E). The dark arrows in Fig 3 and the Online Supplemental Data show a few examples of manual segmentations (blue) becoming indeed closer to the criterion standard (red) after applying dDLR on an ultrafast FLAIR sequence (which would translate into lower AVD, higher TPR, higher DSC, and lower HD).

Illustrative axial slices of ultrafast FLAIR without and with dDLR. Standard FLAIR without dDLR is also shown for reference. The red mask represents the criterion standard that comes from the delineation of standard FLAIR by 2 expert readers; the blue mask is the manual delineation from a third reader; and the green mask is the automatic segmentation from volBrain software. After we applied dDLR, some lesions showed contours closer to the criterion standard (black arrows). dDLR also retrieved lesions that were missed on the original image (white arrows and arrowhead).
To understand whether dDLR could also help to correctly capture more individual MS lesions, even more clinically relevant than the accuracy of the segmentation contours, we also computed SeL, PL, and F1 score. The details of SeL and PL are shown in the Online Supplemental Data. The resulting F1 score progressively decreased with shorter FLAIR sequences, but most interesting, dDLR improved this metric, especially when used on the shortest sequences (P < .001 for shortest FLAIR; Fig 2F and the Online Supplemental Data). The white arrows in Fig 3 and the Online Supplemental Data illustrate a few lesions that were missed on an ultrafast FLAIR sequence without dDLR but were correctly captured after denoising (blue) according to the criterion standard (red).
We used equivalence tests to understand whether 1 accelerated strategy could replace the current standard FLAIR. Fast FLAIR with dDLR showed equivalency to standard FLAIR without dDLR in regard to DSC and AVD, and ultrafast FLAIR with dDLR also showed equivalency to standard FLAIR without dDLR in regard to DSC and TPR.
To evaluate whether dDLR would still be beneficial for automatic detection of MS lesions by software, we computed the same metrics after running the lesionBrain module. We observed the same profiles as those for the effects on the manual delineations even though the impact of dDLR was less pronounced (Figs 2 and 3 and Online Supplemental Data).
DISCUSSION
In this article, we provided qualitative and quantitative evidence for combining accelerated FLAIR sequences with a denoising approach using deep learning–based reconstruction to maintain accurate lesion-load quantification in patients with MS while reducing the scan time. We expect that this strategy promoting short MR imaging examinations could improve comfort and help scan more patients.23
The SNR, spatial resolution, and scan time are closely related; if one of them is prioritized, the others will inevitably degrade. Denoising is one of the strategies that can break this close link. Several denoising methods have been reported for many years and are traditionally classified into 3 categories:24 filtering, transform domain, and statistical approaches. All of them can have problems achieving a high accuracy of denoising, which has stimulated the development of adaptive approaches and their combinations.25 In this context, recent studies have shown the flexibility of machine learning approaches, especially deep learning techniques and their robustness for any type of noise.26,27 Most important, the reconstruction speed of the deep learning–based approach outperforms conventional methods.28 The objective of this study was not to compare denoising performances of different approaches but rather to take advantage of 1 solution that is clinically viable, due to almost instantaneous results, and to investigate its clinical validation. Indeed, new deep learning–based denoising algorithms have become accessible in clinical practice recently, but only the first few articles have demonstrated their benefits in some clinical situations.29-31 However, possible interest in the context of MS, for which lesion detectability is crucial, has never been explored before. Validation inevitably requires tedious manual delineation or lesion counting by expert readers, which we report here.
We found a clear benefit of dDLR in improving image quality due to a higher apparent SNR as measured in vivo and in a phantom (Online Supplemental Data). Our results showed that the major impact of dDLR is on the lesion edge with improved identification of the voxels at the transition between the lesion “core” and the normal-appearing parenchyma. This finding was expected, considering the concentric model of MS plaques32 with an inflammatory attack that starts around a central vein and progresses centrifugally. In this model, histologic modifications are less pronounced at the periphery, and we can expect that this feature translates into voxels with intermediate gray levels on FLAIR, which can be missed if confounded with noise. The improvement of lesion-contour detection can be particularly relevant in the clinic to facilitate the monitoring of a subtype known as a slowly expanding lesion.33,34 Furthermore, the detection of additional lesions is also very important because it will impact whether the objectives of no evidence of disease activity are reached.35 The effect of dDLR on lesion detectability was more challenging to demonstrate, but we identified several examples of “difficult-to-recognize lesions” that were small, with low signal, and in locations where the noise was higher (central location around the deep nuclei or posterior fossa) that were overlooked without dDLR. This finding translated into an improvement of the F1 score that reached statistical significance for the shortest FLAIR sequences. It is likely that 2 individual-but-close lesions could finally be considered as 1 confluent lesion after dDLR by the lesion-counting algorithm, possibly obscuring part of the positive effect on lesion counting.
The results of automatic segmentation followed the same trend as for manual segmentation but with a lower effect. A denoising process was already implemented inside volBrain;36 in other words, the denoising effect was duplicated. Nonetheless, dDLR still showed beneficial consequences because the dDLR algorithm is fundamentally different from the conventional denoising technique and works complementarily. T1WI is used for such automatic segmentation, and we always used the same nonaccelerated and nondenoised sequence in this study, which could also contribute to these results.
The progressive loss of lesion detectability from standard-to-ultrafast FLAIR sequences likely resulted from the combined effects of lower apparent SNR and a lower contrast-to-noise ratio. The denoising procedure positively influenced both the apparent SNR and the contrast-to-noise ratio (Online Supplemental Data). However, dDLR could not compensate for all the effects of this acceleration strategy. The dDLR applied to the ultrafast or shortest FLAIR sequences did not allow to recover the same performances as standard FLAIR. Clinical use of such extreme accelerations may pose a concern. However, the fast FLAIR combined with dDLR, which already cuts scan time by a factor of close to 2, caught up to the standard FLAIR in image quality and provided equivalent DSC performances for manual segmentation. In the future, we could test the benefit of dDLR with other acceleration strategies.
This study has limitations. First, the number of participants was small. However, we conducted sequence-wise and lesion-wise analyses, which already provided a reasonable amount of data (total of 224 FLAIR sequences). Second, our results came from a specific population of patients with MS monitored under second-line therapy. How this would translate at an earlier stage (clinically isolated syndrome) and for MS diagnosis performances is unknown. Similarly, generalization to other sequences and other magnets has not been tested in this single-center and single-scanner study. Third, only 1 reader manually segmented lesions, and a few segmentation errors cannot be excluded even though they should not have favored 1 type of sequence. Fourth, we cannot exclude the fact that the reader, while blinded, could recognize the type of FLAIR sequence because of relatively strong noise in ultrafast and the shortest implementations. However, the time spent drawing was within the same range for all types of sequences (Online Supplemental Data), ensuring that all the images were considered equally. It was possible as well that the reader could remember the delineation of lesions from ≥1 FLAIR sequence from the same patient segmented before. However, this recognition bias was likely minor because of the random presentation of 224 sequences segmented intermittently during several months. Fifth, we conducted only 1 automatic segmentation, while new segmentations using deep learning technologies have become mainstream.37 Finally, the criterion standard was created on the basis of the standard FLAIR without dDLR. Additional FLAIR hyperintense areas detected on standard FLAIR with dDLR explained the decrease in PPV, but the underlying histologic substrate (authentic lesions or real false-positives) cannot be known without conducting a postmortem study.
CONCLUSIONS
In this study, dDLR allows a reduced FLAIR scan time while preserving the image quality in the context of MS. dDLR is adaptable to different noise levels with significant positive effects at different acceleration levels and awaits further clinical validation in several applications.
Footnotes
T. Yamamoto and C. Lacheret are co-first authors and have contributed equally to this study.
This study was supported by Roche Laboratory and the public grant from the French Agence Nationale de la Recherche within the context of the investments for the future program referenced ANR-10-LABX-57 and named TRAIL. The work was also supported by the fondation pour l’aide à la recherche sur la sclérose en plaques foundation.
The sponsors did not participate in any aspect of the design or performance of the study, including data collection, management, analysis and the interpretation or preparation, review, and approval of the manuscript.
Disclosure forms provided by the authors are available with the full text and PDF of this article at www.ajnr.org.
Indicates open access to non-subscribers at www.ajnr.org
References
- Received December 20, 2021.
- Accepted after revision June 13, 2022.
- © 2022 by American Journal of Neuroradiology


