
Abstract
BACKGROUND AND PURPOSE: Supervised deep learning is the state-of-the-art method for stroke lesion segmentation on NCCT. Supervised methods require manual lesion annotations for model development, while unsupervised deep learning methods such as generative adversarial networks do not. The aim of this study was to develop and evaluate a generative adversarial network to segment infarct and hemorrhagic stroke lesions on follow-up NCCT scans.
MATERIALS AND METHODS: Training data consisted of 820 patients with baseline and follow-up NCCT from 3 Dutch acute ischemic stroke trials. A generative adversarial network was optimized to transform a follow-up scan with a lesion to a generated baseline scan without a lesion by generating a difference map that was subtracted from the follow-up scan. The generated difference map was used to automatically extract lesion segmentations. Segmentation of primary hemorrhagic lesions, hemorrhagic transformation of ischemic stroke, and 24-hour and 1-week follow-up infarct lesions were evaluated relative to expert annotations with the Dice similarity coefficient, Bland-Altman analysis, and intraclass correlation coefficient.
RESULTS: The median Dice similarity coefficient was 0.31 (interquartile range, 0.08–0.59) and 0.59 (interquartile range, 0.29–0.74) for the 24-hour and 1-week infarct lesions, respectively. A much lower Dice similarity coefficient was measured for hemorrhagic transformation (median, 0.02; interquartile range, 0–0.14) and primary hemorrhage lesions (median, 0.08; interquartile range, 0.01–0.35). Predicted lesion volume and the intraclass correlation coefficient were good for the 24-hour (bias, 3 mL; limits of agreement, −64−59 mL; intraclass correlation coefficient, 0.83; 95% CI, 0.78–0.88) and excellent for the 1-week (bias, −4 m; limits of agreement,−66−58 mL; intraclass correlation coefficient, 0.90; 95% CI, 0.83–0.93) follow-up infarct lesions.
CONCLUSIONS: An unsupervised generative adversarial network can be used to obtain automated infarct lesion segmentations with a moderate Dice similarity coefficient and good volumetric correspondence.
ABBREVIATIONS:
- AIS
- acute ischemic stroke
- BL
- baseline
- DSC
- Dice similarity coefficient
- FU
- follow-up
- FU2BL-GAN
- follow-up to baseline generative adversarial network
- GAN
- generative adversarial network
- 24H
- 24 hours
- HT
- hemorrhagic transformation
- ICC
- intraclass correlation coefficient
- IQR
- interquartile range
- L1-loss
- voxelwise absolute difference between generated baseline and real baseline NCCTs
- L1+adv
- L1 and adversarial loss
- LoA
- limits of agreement
- nnUnet
- no new Unet
- PrH
- primary hemorrhagic lesions
- 1W
- 1 week
Hemorrhagic transformation (HT) and malignant cerebral edema are severe complications after acute ischemic stroke (AIS), which frequently result in functional deterioration and death.1⇓-3 Computer-guided visualization and segmentation of these hemorrhagic and infarct lesions can assist radiologists in detecting small lesions.4,5 Furthermore, lesion volume computed from a segmentation predicts long-term functional outcome3,6 and can be used to guide additional treatment such as decompressive craniectomy.7 Compared with an AIS baseline (BL) NCCT, follow-up (FU) NCCT imaging of a hemorrhagic lesion is characterized by an attenuation increase, while infarct lesions are characterized by an attenuation decrease.8,9 This attenuation change between NCCT scans can be exploited by specific deep learning algorithms to identify tissue changes and, in turn, can be used to obtain lesion segmentations.
Supervised deep learning with convolutional neural networks is the state-of-the-art computer-guided method for volumetric segmentation of hemorrhagic and infarct lesions in NCCT.4,5,8⇓-10 The supervised part in the case of segmentation refers to the use of human-, often an expert radiologist, guided annotations per voxel that represent the ground truth of the lesion on NCCT. These annotations are subsequently used to optimize a convolutional neural network for automated segmentation.11 However, acquiring manual annotations is time-consuming and is subject to intra- and interrater variability. As a result, it is difficult to create large data sets with comprehensive ground truth annotations. This issue is a challenge for the training of supervised deep learning models, affecting the performance and generalizability of these models.
Generative adversarial networks (GANs) are a type of deep learning model that can be used to generate new images or transform existing images.12,13 Because a GAN is optimized without an explicitly defined ground truth, such as manual lesion annotations, it is considered an unsupervised deep learning method. Recently, Baumgartner et al14 introduced the use of a GAN to transform an MR image of a patient with symptoms to a scan before symptom onset of Alzheimer disease. From this transformation, structural maps were extracted to visually represent pathologic changes relative to a generated BL MR imaging scan without Alzheimer disease.14 Such structural pathology maps could subsequently be used to segment and quantify the pathologic changes.
The aim of this study was to accurately segment stroke lesions on follow-up NCCT scans with a GAN trained in an unsupervised manner. In line with Baumgartner et al,14 we developed a GAN to remove hemorrhagic and ischemic stroke lesions from follow-up NCCT scans by generating difference maps with a lesion and BL NCCT scans without a lesion.
MATERIALS AND METHODS
GANs for BL NCCT Generation
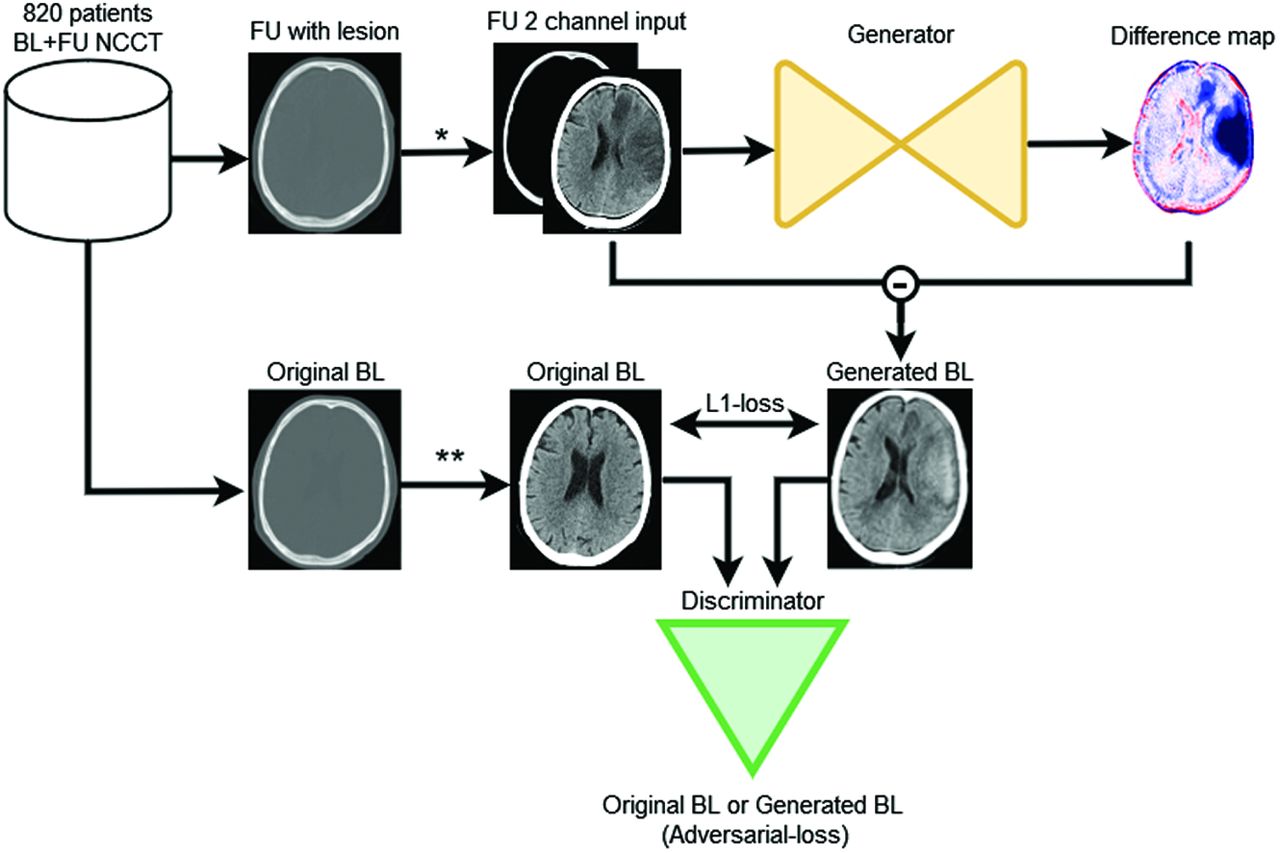
The GAN structure as adopted in this study consists of 2 competing deep learning models, referred to as generator and discriminator models. The generator model generates artificial images, while the discriminator model tries to distinguish the generated artificial image from the original images.12,13 In this study, the generator receives as input a follow-up NCCT scan with the lesion and generates a difference map. This difference map is subtracted from the input follow-up NCCT scan with the lesion to generate an artificial BL NCCT scan without the lesion. Because an infarct lesion is visually subtle in AIS BL NCCTs acquired in the acute stage (0–6 hours after symptom onset), the transformation from a follow-up scan at 24 hours (24H) or 1 week (1W) with a well-defined lesion to a BL scan entails essentially the removal of the lesion. Subsequently, the discriminator model classifies the presented images as being either an original BL or a generated BL NCCT. This classification is used to provide feedback to the generator model and to optimize the difference map.12,13 The generated difference map is expected to have high positive values at the location of a hemorrhagic lesion and negative values at the location of an infarct lesion on a follow-up NCCT. Similarly, the attenuation change between BL and follow-up NCCT is positive in the case of a HT and negative if edema or brain tissue necrosis occurs in the infarct lesion. Thresholding of the generated difference map values can then be used to obtain a lesion segmentation.
The proposed GAN method is optimized with 2 types of loss functions: the voxelwise absolute difference between generated BL and real BL NCCTs (L1-loss) and the binary cross-entropy of the discriminator (adversarial-loss) for classifying generated and real BL NCCTs.12,13 Figure 1 presents the GAN model architecture we refer to as the follow-up to BL GAN (FU2BL-GAN).

The FU2BL-GAN global architecture (asterisk). The follow-up (FU) NCCT with lesion is clipped between Hounsfield unit ranges of 0−100 and 100−1000 and normalized to (−1) (double asterisks). The original BL NCCT is only clipped between 0 and 100 HU and normalized to (−1). The FU NCCT with a lesion is passed through the generator network to compute a difference map. This difference map is subtracted from the input FU NCCT to construct a generated BL NCCT. Original BL and generated BL are optimized on the basis of the absolute voxelwise difference (L1-loss) and the binary cross-entropy loss (adversarial-loss) of the discriminator networks classification (original or generated BL).
Patient Populations
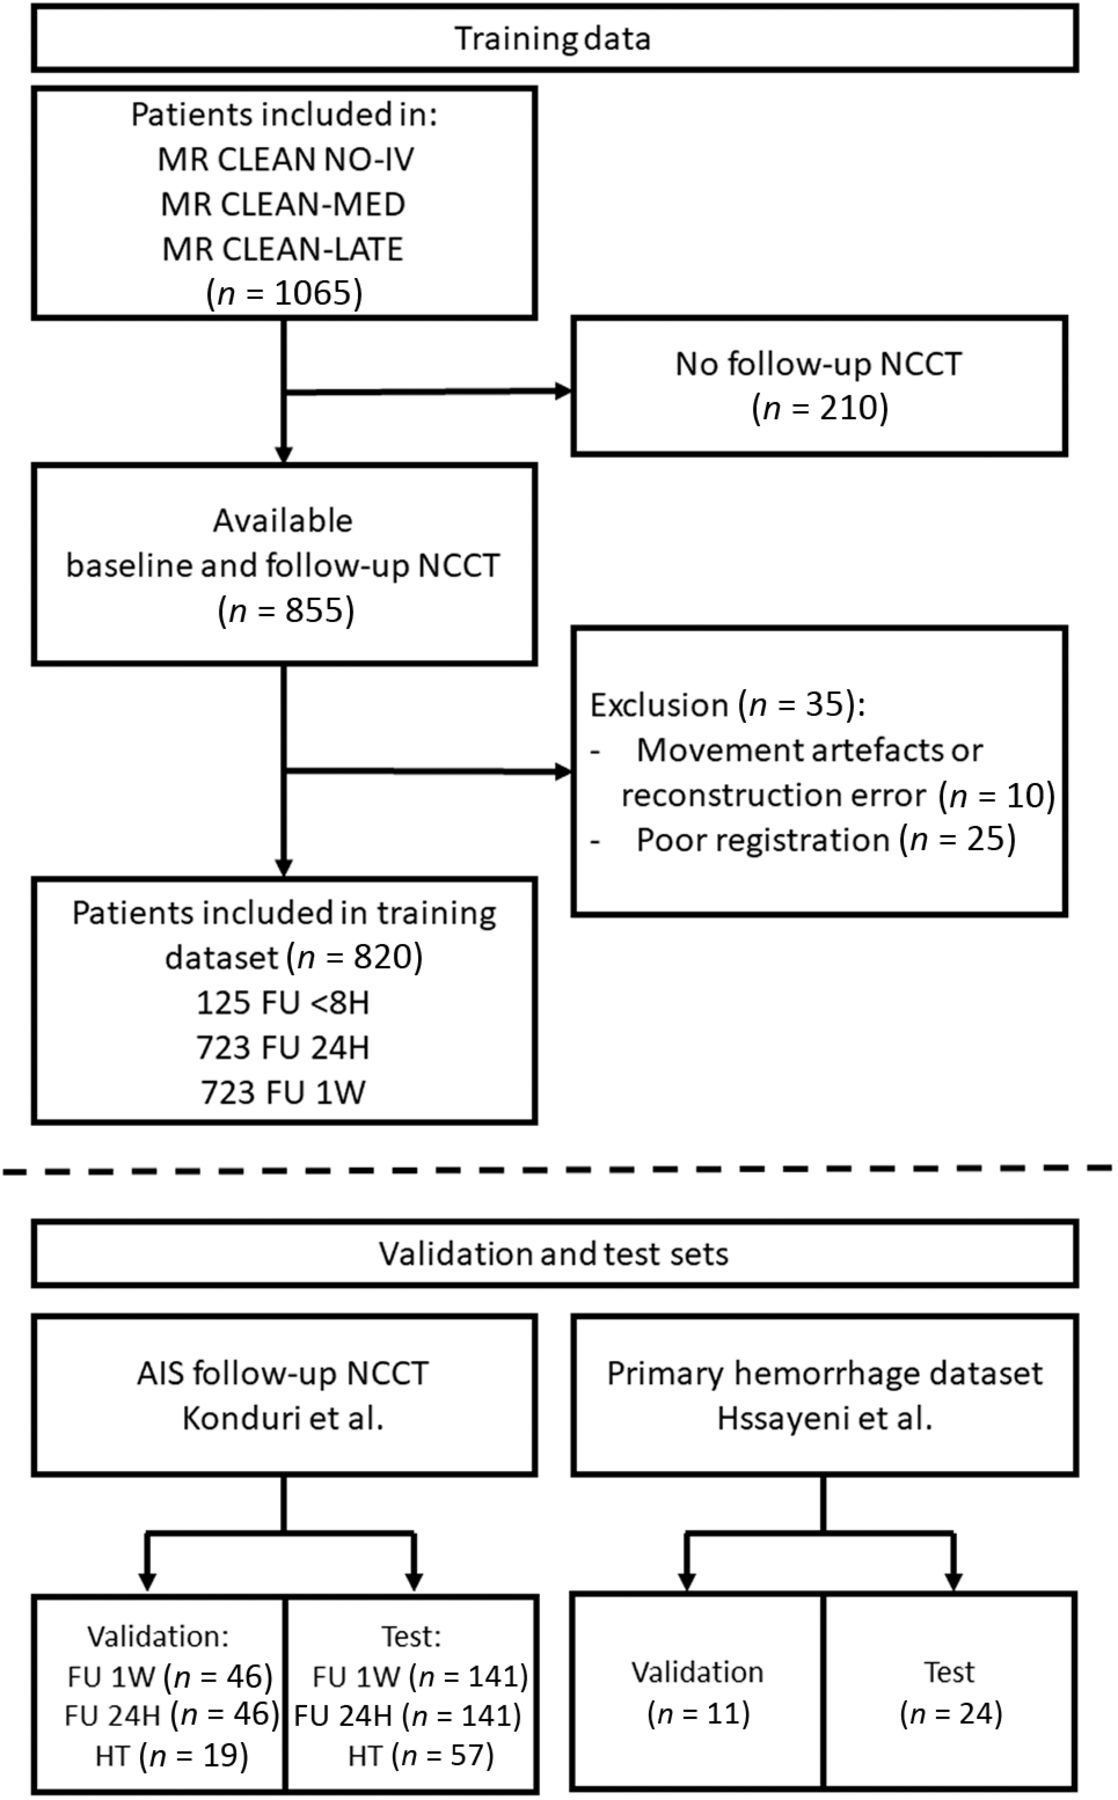
In this study, 820 patients were included between January 2018 and July 2021 in the training data set from the MR CLEAN-NO-IV (n = 297), MR CLEAN-MED (n = 377), and MR CLEAN-LATE (n = 146) randomized controlled trials if BL and follow-up NCCTs were available. Specific imaging protocols, inclusion, and exclusion criteria of each of these randomized controlled trials have been published previously.15⇓-17 Scans of these 820 patients were used to train the FU2BL-GAN. NCCT scans with lesion annotation from previously published studies by Konduri et al18 and Hssayeni et al19 were used to construct 4 randomly split dedicated validation and test sets (depicted in Fig 2): ischemic stroke lesions between 8- and 72-hour (24H infarct; N validation: 46; N test: 141) and 72-hour and 2-week (1W infarct; N validation: 46; N test: 141) follow-up after endovascular treatment or randomization; hemorrhagic transformation lesions after AIS (HT; N validation: 19; N test: 57);20 and primary hemorrhagic lesions (PrH; N validation: 11; N test: 24). The data from Konduri et al was originally included in the MR CLEAN trial between December 2010 and March 2014.21 In compliance with the declaration of Helsinki, informed consent has been received for the use of data for substudies from patients included in the training data randomized controlled trials and the validation and test data of ischemic and HT lesions.15⇓⇓-18,20 The PrH data from Hssayeni et al19 was accessed through physionet.org and obtained with a “Restricted Health Data License 1.5.0,” because the authors stated that collection and sharing of the retrospectively collected anonymized and defaced CTs were authorized by the Iraq Ministry of Health Ethics board.

Patients included in the training, validation, and test sets. The training data consisted of a BL and at least 1 follow-up (FU) NCCT. FU of <8 hours: FU NCCT acquired within 8 hours; FU 24H: FU NCCT acquired 8–72 hours; FU 1W: FU NCCT acquired 72 hours to 2 weeks after endovascular treatment or randomization. Validation and test sets were constructed with data from the studies by Konduri et al18 and Hssayeni et al.19 8H indicates 8 hours.
Training Data and Training Protocol
All NCCT volumes were converted from DICOM to NIfTI format with dcm2niix available in MRIcroGL, Version 1.2.20211006.22 Elastix, Version 5.0.0 (https://elastix.lumc.nl/) was used to coregister the follow-up and BL NCCTs of the training data;23 the scan with the thinnest slices was used as a moving image. Poor coregistration was detected by inspecting the overlay of the 2 images at the 30th, 50th, and 80th percentile sections. Up to 3 follow-up NCCTs were used per patient if clinical deterioration occurred within 8 hours after endovascular treatment or randomization (8 hours) and as part of the imaging protocols of 8–72 hours (24H) and 72 hours to 2 weeks (1W) after AIS.15⇓-17 To ensure stable optimization and prevent overfitting, per training iteration, we used 1 follow-up NCCT and 1 corresponding BL NCCT section (512 × 512). Slices were sampled at random on the 10th and the 95th percentile sections. Furthermore, to emphasize the variation in attenuation between different tissues, the generator model received 2D slices from follow-up NCCTs with 2 channels on the basis of different Hounsfield unit ranges as input: The attenuation was clipped between both 0 and 100 HU for brain and infarct differentiation and 100 and 1000 HU for hemorrhage and skull differentiation. The images were subsequently normalized to a −1 to 1 range. BL NCCTs were only clipped between 0 and 100 HU and normalized to a −1 to 1 range. The discriminator network receives 2D slices of either generated BL or real BL NCCT scans. To make the FU2BL-GAN robust to differences in contrast and noise between the BL and follow-up NCCTs, we applied multiple intensity and noise-altering image augmentations (details available in the Online Supplemental Data). A batch size of 2 with a learning rate of 0.00002 for 500 epochs was used, subsequently linearly reduced to zero over the following 500 epochs (Nvidia TITAN V [https://www.nvidia.com/en-us/titan/titan-v/] with 12-gb RAM). The Online Supplemental Data contains a detailed description of the FU2BL-GAN architecture.
Lesion Segmentation
To obtain lesion segmentations, we passed validation and test set NCCTs through the generator model to generate difference maps. Due to computational constraints, the validation set difference maps were computed every 10th training epoch. Subsequently, segmentations were obtained by applying a threshold to the difference maps. The resulting Dice similarity coefficient (DSC) of the segmentations relative to the ground truth was used to determine the optimal threshold for the difference map −0.2 to +0.3 with steps of 0.01 (equivalent to 0.5 HU). An automatically computed brain mask based on intensity thresholds and region growing was used to remove false-positive segmentations that were not allocated inside the skull.9 In the Online Supplemental Data, validation set results are depicted. Finally, the optimal epoch and threshold were used to obtain segmentations for the test sets.
Evaluation and Outcome Metrics
Reported results were based on test set segmentations and were reported relative to expert-based ground truth segmentations. The DSC and Hausdorff distance in millimeters were used to compute spatial correspondence. Results from the FU2BL-GAN approach trained with L1 and adversarial loss (L1+adv) were compared statistically with the Wilcoxon rank-sum test with a simpler approach trained with L1-loss (L1) only. Furthermore, the results of the FU2BL-GAN were compared with two 2D Unets trained on segmentations from the 24H and 1W infarct validation sets using the no new Unet (nnUnet) framework as a conventional supervised learning BL.24 Volumetric correspondence between the ground truth and predicted segmentations were analyzed with Bland-Altman plots with bias (mean between methods) and limits of agreement (LoA, ±1.96 SDs from the bias) and the intraclass correlation coefficient (ICC) with 95% CIs. The 2-way mixed-effects approach for consistency of a single fixed rate was used to describe differences between the FU2BL-GAN-based segmentations and the expert-based ground truth lesion segmentations. A subgroup analysis was performed for lesions of >10 mL to address the effect of lesion size on our outcome metrics. Results were reported as median with interquartile range (IQR) or mean with 95% CIs.
RESULTS
Ischemic and hemorrhagic lesions in our test sets were relatively small; the distribution of volumes was skewed toward smaller lesions. Ground truth lesion volume of test sets had a median of 35 mL (IQR, 16–78 mL) in the 24H and 66 mL (IQR, 29–125mL) and in the 1W infarct NCCTs, respectively. For the HT and PrH test sets respectively, the mean lesion size was 6 mL (IQR, 2—12 mL) and 6 mL (IQR, 1–12 mL). Characteristics of the training data can be found in the Online Supplemental Data. Training characteristics and the optimal difference map thresholds are available in the Online Supplemental Data.
Quantitative Results
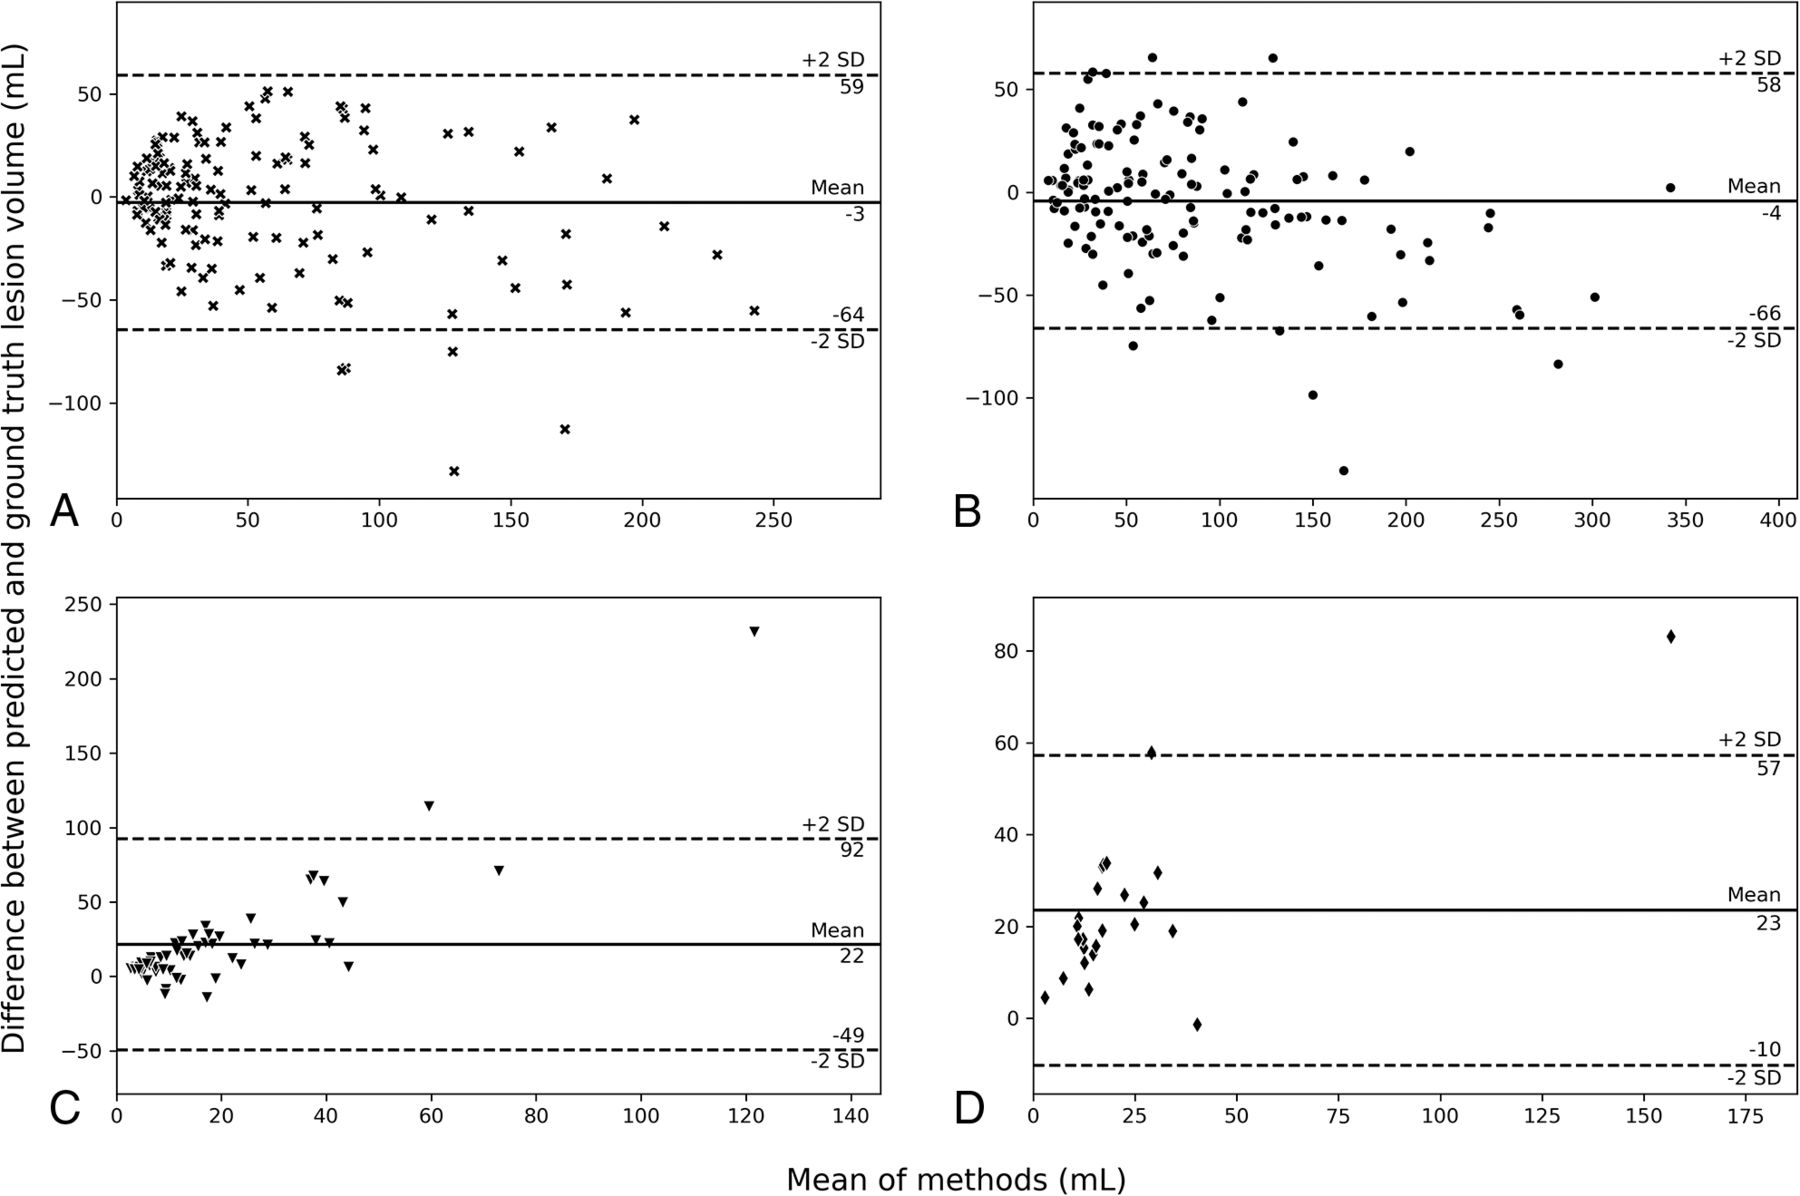
As depicted in Figs 3 and the Online Supplemental Data, DSC and lesion volume were positively related. The median DSC of the FU2BL-GAN was 0.31 (IQR, 0.08–0.59) in the 24H infarct test set, 0.59 (IQR, 0.29–0.74) for the 1W infarct test set, 0.02 (IQR, 0–0.14) for the HT test set, and 0.08 (IQR, 0.01–0.35) for the PrH test set. The FU2BL-GAN (L1+adv) had a statistically significant higher DSC than the model trained with only L1-loss (L1) for all test sets but a significantly lower DSC compared with the nnUnet approach (Fig 3). The subgroup of lesions of >10 mL (Fig 3B) had a higher DSC than the overall population (Fig 3A), especially for the HT (median, 0.46; IQR, 0.07–0.51) and PrH (median, 0.44; IQR, 0.24–0.55) test sets but also for the follow-up infarct (24H infarct: median, 0.41; IQR, 0.15–0.62; 1W infarct: median, 0.60; IQR, 0.35–0.75) test sets. For all the infarct and hemorrhage test sets, the Hausdorff distances of both the FU2BL-GAN and L1 approach were poor with a median varying between 83 and 87 mm (Online Supplemental Data). Bland-Altman plots of the 4 test sets are depicted in Fig 4. Bias and LoA for the FUB2BL-GAN of the 24H (bias, −3 mL; LoA, −64–59 mL) and 1W (bias, –4 mL; LoA, –66–58 mL) test sets were low, representing good correspondence of the segmentations with ground truth annotations. However, both the HT (bias, 22 mL; LoA, –49–92 mL) and PrH (bias, 23 mL; LoA, –10–57 mL) segmentations overestimated lesion volume and had several outliers that affected volumetric correspondence. The ICC for the FUB2BL-GAN was excellent in the 1W infarct test set (ICC, 0.90; 95% CI, 0.83–0.93), good in the 24H infarct (ICC, 0.83; 95% CI, 0.78–0.88) and PrH (ICC, 0.84; 95% CI, 0.66–0.93) test sets, and poor in the HT (ICC, 0.11; 95% CI, –0.15–0.36) test sets. However, the nnUnet approach resulted in a lower bias and LoA, a higher ICC, and a lower Hausdorff distance than the FU2BL-GAN for both the 24H (bias, –14 mL; LoA, −57–29 mL; ICC, 0.91; 95% CI, 0.88–0.92; Hausdorff distance, 28 mm; IQR, 18–42 mm) and 1W (bias, –6 mL; LoA, –36–23 mL; ICC, 0.98; 95% CI, 0.97–0.99; Hausdorff distance, 21 mm; IQR, 14–37 mm) infarct lesions test sets (Online Supplemental Data).

Dice similarity coefficients of test sets: 24-hour follow-up after AIS (24H infarct), 1-week follow-up after AIS (1W infarct), HT, and PrH. A, The results of all the test set data. B, Only results from lesions that are >10 mL. Each shade of color represents the results based on the supervised nnUnet approach, the FU2BL-GAN approach trained with L1+adv, and the generator trained with L1-loss only (L1) respectively. The Asterisk indicates P < .05; double asterisks, P < .001; triple asterisks, P < 1e-10; NS, nonsignificant difference.

Bland-Altman plots of predicted lesion size for the FU2BL-GAN. A, 24H infarct follow-up. B, 1W infarct follow-up. C, HT. D, PrH.

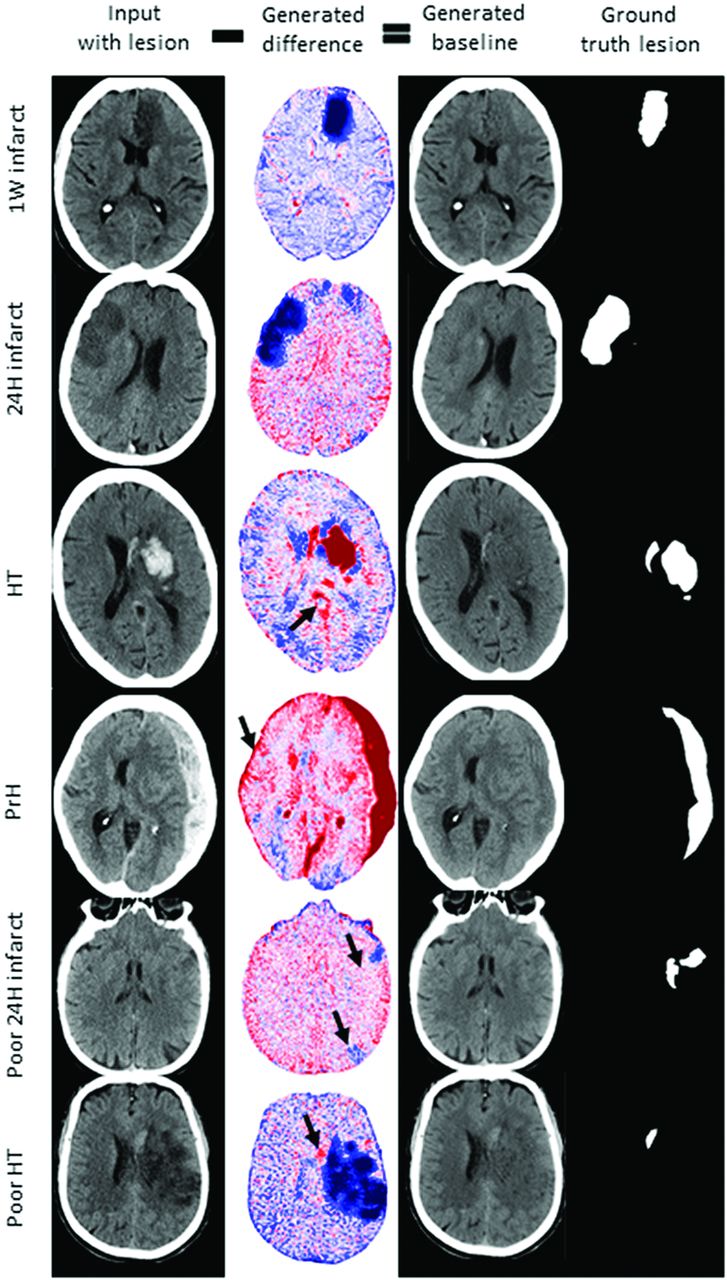
Visual results of the FU2BL-GAN. The first column contains the input NCCT with lesion used as input for the generator model to generate a difference map (column 2). The difference map is subtracted from the input NCCT (column 1) to obtain a generated BL scan (column 3). The negative (blue) and positive (red) values of the difference map correspond to the deviation of the difference map from zero. A higher deviation from zero implies a higher attenuation adjustment of the follow-up NCCT to generate the BL NCCT without a lesion. Column 4 contains the ground truth lesion annotations. Arrows show false-positive hemorrhage (rows 3 and 4), false-negative infarct (row 5, upper arrow), false-positive infarct (row 5, lower arrow), and false-negative hemorrhage segmentation (arrow, row 6).
Qualitative Visual Results
Figure 5 depicts visual examples of each test set in the first 4 rows, while the last 2 rows depict examples with poor segmentation performance. In contrast to the examples shown in the first 3 rows, the input NCCT of the PrH test set is the acute-phase NCCT with hemorrhagic lesions. For this case, the generated scan can be regarded as a prehemorrhagic stroke NCCT scan. Although lesions visually appear to be removed accurately, the generator model was not able to completely reconstruct 24H infarcted brain tissue similar to the BL NCCTs (columns 1 versus 3). False-positive hemorrhage segmentations were present when the input NCCT scan had beam-hardening artifacts in the brain close to the skull or when the overall scan attenuation was higher (arrows in PrH and HT column 2). False-negative hemorrhage segmentations were present if the hemorrhage was small and the attenuation increase was low (row 6, poor HT). False-positive infarct segmentations occurred close to the ventricles and other locations, where CSF results in a hypoattenuated region (row 5). False-negative infarct segmentation errors mainly occurred in the 24H infarct data set because the infarct lesion was not yet significantly hypoattenuated (row 5).
DISCUSSION
Our study shows that when one uses a GAN deep learning structure, it is possible to obtain follow-up ischemic and large hemorrhagic lesion segmentations without using manually annotated training data. Although the visual quality of generated BL scans was not always optimal, lesion segmentation quality was often not affected. External validation in 4 test sets revealed reasonable segmentation quality in terms of DSC and good-to-excellent volumetric correspondence with the ground truth for follow-up infarct lesions in NCCT at 24H and 1W follow-up after AIS. In terms of DSC and volumetric correspondence, our work performs on a par with previous work on supervised deep-for-follow-up infarct lesion segmentation (DSC median, 0.57 [SD:0.26]; ICC, 0.88).9 However, the presented unsupervised FU2BL-GAN did not outperform the supervised nnUnet benchmark model with respect to all outcome measures. Kuang et al25 also used a GAN to segment infarct lesions but achieved much higher segmentation quality (DSC mean, 0.70 [SD, 0.12]). However, the approach by Kuang et al required a training set with manual lesion annotations because the adversarial (GAN) loss was used in addition to the supervised loss functions. DSC and volumetric correspondence for segmenting the HT and PrH lesions were worse than those of existing supervised methods.4,5,8,10 Poor detection and segmentation of hemorrhagic lesions are likely due to the small lesion size in our test sets and an under-representation of hemorrhages in the training data.
The unsupervised approach to training is a major advantage compared with conventional supervised deep learning methods. With the growing availability of unlabeled and weakly labeled imaging data bases, unsupervised GAN-based approaches can be used without the manual annotation effort for automated lesion segmentation. However, the downside of the presented approach is the requirement of paired training images, coregistered images with and without lesions from the same patient. Such high-quality registration is often difficult to achieve when considering medical imaging because most organs, tissues, and body parts deform or move between acquisition moments. Because the brain only slightly deforms and moves between acquisition moments, the use of a GAN-based lesion segmentation method similar to the presented FU2BL-GAN seems promising for other brain pathologies.
One of the main shortcomings of the presented FU2BL-GAN is that it can only be trained on CT slices sampled at random. Because not every section in an NCCT volume of a patient contains an initial AIS lesion and only a minority of the volumes contain a hemorrhagic lesion, the FU2BL-GAN likely experienced an under-representation of brain lesions. This under-representation during the training of NCCT slices with a lesion, especially with a hemorrhagic lesion, compared with slices without lesions, is known to result in poorer segmentation performance; in technical literature, this is often referred to as the “class imbalance problem.”26 In contrast, supervised deep learning methods often use adjusted sampling techniques that require ground truth annotations;8 most class (nonlesion tissue) is undersampled relative to the minority class (the lesion) to balance class representation. A valuable improvement in our FU2BL-GAN would be to manually classify slices for lesion presence and volumes for the presence of a hemorrhage. Although these section- or volume-level annotations would take some time to acquire, such sparse annotation methods are still less time-consuming than manually segmenting lesions required for supervised deep learning. Alternatively, automated NCCT-section classification algorithms for infarct or hemorrhage presence can be used to classify NCCT slices on the basis of lesion presence.27 Subsequently, this information can be used to select training data for further improvement of the FU2BL-GAN.
Although the test sets used in this study are from multiple centers, it remains largely unclear what scanners, settings, and postprocessing methods were used. Furthermore, Konduri et al18 reported extensive exclusion criteria related to the image quality and noise level, excluding 93 of 280 patients in their data set. These factors influence the ability to generalize results from this study and require additional external validation on subgroups and other data sets.
CONCLUSIONS
The presented FU2BL-GAN is an unsupervised deep learning approach trained without manual lesion annotations to segment stroke lesions. With the FU2BL-GAN, it is feasible to obtain automated infarct lesion segmentations with moderate DSC and good volumetric correspondence.
Acknowledgments
CONTRAST Clinical Trial Collaborators
Research Leaders
Diederik Dippel (MD, PhD),1 Charles Majoie (MD, PhD)3
Consortium Coordinator
Rick van Nuland, (PhD)24
Imaging Assessment Committee
Charles Majoie (MD, PhD)–Chair,3 Aad van der Lugt (MD, PhD)–Chair,1 Adriaan van Es, (MD, PhD),1,2 Pieter-Jan van Doormaal (MD),1 René van den Berg, (MD, PhD),3 Ludo Beenen (MD),3 Bart Emmer (MD, PhD),3 Stefan Roosendaal (MD, PhD),3 Wim van Zwam (MD, PhD),4 Alida Annechien Postma (MD, PhD),25 Lonneke Yo (MD, PhD),6 Menno Krietemeijer (MD),6 Geert Lycklama (MD, PhD),7 Jasper Martens (MD),8 Sebastiaan Hammer (MD, PhD),10 Anton Meijer (MD, PhD),10 Reinoud Bokkers (MD, PhD),15 Anouk van der Hoorn (MD, PhD),15 Ido van den Wijngaard (MD, PhD),2,7 Albert Yoo (MD, PhD),26 Dick Gerrits (MD)27
Adverse Events Committee
Robert van Oostenbrugge (MD, PhD)–Chair,4 Bart Emmer (MD, PhD),3 Jonathan M. Coutinho (MD, PhD),3 Martine Truijman (MD, PhD),4 Julie Staals (MD, PHD),4 Bart van der Worp (MD, PhD),5 J. Boogaarts (MD, PhD),10 Ben Jansen (MD, PhD),16 Sanne Zinkstok (MD, PhD)28
Outcome Assessment Committee
Yvo Roos (MD, PhD)–Chair,3 Peter Koudstaal (MD, PhD),1 Diederik Dippel (MD, PhD),1 Jonathan M. Coutinho (MD, PhD),3 Koos Keizer (MD, PhD),5 Sanne Manschot (MD, PhD),7 Jelis Boiten (MD, PhD),7 Henk Kerkhoff (MD, PhD),14 Ido van den Wijngaard (MD, PhD)2,7
Data Management Group
Hester Lingsma (PhD),1 Diederik Dippel (MD, PhD),1 Vicky Chalos (MD),1 Olvert Berkhemer (MD, PhD)1,3
Imaging Data Management
Aad van der Lugt (MD, PhD),1 Charles Majoie (MD, PhD),3 Adriaan Versteeg,1 Lennard Wolff (MD),1 Matthijs van der Sluijs (MD),1 Henk van Voorst (MD),3 Manon Tolhuisen (MSc),3
Biomaterials and Translational Group
Hugo ten Cate (MD, PhD),4 Moniek de Maat (PhD),1 Samantha Donse-Donkel (MD),1 Heleen van Beusekom (PhD),1 Aladdin Taha (MD),1 Aarazo Barakzie (MD)1
Local Collaborators
Vicky Chalos (MD, PhD),1 Rob van de Graaf (MD, PhD),1 Wouter van der Steen (MD),1 Aladdin Taha (MD),1 Samantha Donse-Donkel (MD),1 Lennard Wolff (MD),1 Kilian Treurniet (MD),3 Sophie van den Berg (MD),3 Natalie LeCouffe (MD),3 Manon Kappelhof (MD),3 Rik Reinink (MD),3 Manon Tolhuisen (MD),3 Leon Rinkel (MD),3 Josje Brouwer (MD),3 Agnetha Bruggeman (MD),3 Henk van Voorst (MD),3 Robert-Jan Goldhoorn (MD),4 Wouter Hinsenveld (MD),4 Anne Pirson (MD),4 Susan Olthuis (MD),4 Simone Uniken Venema (MD),4 Sjan Teeselink (MD),10 Lotte Sondag (MD),10 Sabine Collette (MD)15
Research Nurses
Martin Sterrenberg,1 Naziha El Ghannouti,1 Laurine van der Steen,3 Sabrina Verheesen,4 Jeannique Vranken,4 Ayla van Ahee,5 Hester Bongenaar,6 Maylee Smallegange,6 Lida Tilet,6 Joke de Meris,7 Michelle Simons,8 Wilma Pellikaan,9 Wilma van Wijngaarden,9 Kitty Blauwendraat,9 Yvonne Drabbe,11 Michelle Sandiman-Lefeber,11 Anke Katthöfer,11 Eva Ponjee,12 Rieke Eilander,12 Anja van Loon,13 Karin Kraus,13 Suze Kooij,14 Annemarie Slotboom,14 Marieke de Jong,15 Friedus van der Minne,15 Esther Santegoets16
Study Monitors
Leontien Heiligers,1 Yvonne Martens,1 Naziha El Ghannouti1
On behalf of the CONTRAST consortium collaborators.
Affiliations
1Erasmus MC University Medical Center, Rotterdam, the Netherlands; 2Leiden University Medical Center, Leiden, the Netherlands; 3Amsterdam University Medical Centers, location AMC, Amsterdam, the Netherlands; 4Cardiovascular Research Institute Maastricht (CARIM), Maastricht University Medical Centre, Maastricht, The Netherlands; 5University Medical Center Utrecht, Brain Center Rudolf Magnus, Utrecht, the Netherlands; 6Catharina Hospital, Eindhoven, the Netherlands; 7Haaglanden Medical Centre, the Hague, the Netherlands; 8Rijnstate Hospital, Arnhem, the Netherlands; 9St. Antonius Hospital, Nieuwegein, the Netherlands; 10Radboud University Medical Center, Nijmegen, the Netherlands; 11HagaZiekenhuis, the Hague, the Netherlands; 12Isala, Zwolle, the Netherlands; 13Amphia Hospital, Breda, the Netherlands; 14Albert Schweitzer Hospital, Dordrecht, the Netherlands; 15University Medical Center Groningen, Groningen, the Netherlands; 16Elisabeth-TweeSteden Hospital, Tilburg, the Netherlands; 17University Hospital of Nancy, Nancy, France; 18Foch Hospital, Suresnes, France; 19Fondation Rothschild Hospital, Paris, France; 20University Hospital of Bordeaux, Bordeaux, France; 21Pitié-Salpêtrière University hospital, Paris, France; 22John Radcliffe Hospital, Oxford, United Kingdom; 23University of Washington, Seattle, Washington, United States; 24Lygature, Utrecht, the Netherlands; 25School for Mental Health and Sciences (Mhens), Maastricht University Medical Center, Maastricht, The Netherlands; 26Texas Stroke Institute, Dallas-Fort Worth, Texas, United States of America; 27Medisch Spectrum Twente, Enschede, The Netherlands; 28TerGooi, Hilversum, The Netherlands.
We would also like to thank Nvidia Corporation, Santa Clara, California, for the providing of a graphics processing unit.
Footnotes
The funding sources were not involved in study design, monitoring, data collection, statistical analyses, interpretation of results, or manuscript writing.
This study was funded by the CONTRAST consortium. The CONTRAST consortium acknowledges the support from the Netherlands Cardiovascular Research Initiative, an initiative of the Dutch Heart Foundation (CVON2015-01: CONTRAST) and from the Brain Foundation of the Netherlands (HA2015.01.06). The collaboration project is additionally financed by the Ministry of Economic Affairs by means of the Public-private partnerships Allowance made available by the Top Sector Life Sciences & Health to stimulate public-private partnerships (LSHM17016). This work was funded, in part, through unrestricted funding by Stryker, Medtronic, and Cerenovus.
Disclosure forms provided by the authors are available with the full text and PDF of this article at www.ajnr.org.
Indicates open access to non-subscribers at www.ajnr.org
References
- Received January 27, 2022.
- Accepted after revision June 2, 2022.
- © 2022 by American Journal of Neuroradiology


Jump to section
Related Articles
Cited By...
- No citing articles found.