
Abstract
BACKGROUND AND PURPOSE: Sinus CT is critically important for the diagnosis of chronic rhinosinusitis. While CT is sensitive for detecting mucosal disease, automated methods for objective quantification of sinus opacification are lacking. We describe new measurements and further clinical validation of automated CT analysis using a convolutional neural network in a chronic rhinosinusitis population. This technology produces volumetric segmentations that permit calculation of percentage sinus opacification, mean Hounsfield units of opacities, and percentage of osteitis.
MATERIALS AND METHODS: Demographic and clinical data were collected retrospectively from adult patients with chronic rhinosinusitis, including serum eosinophil count, Lund-Kennedy endoscopic scores, and the SinoNasal Outcomes Test-22. CT scans were scored using the Lund-Mackay score and the Global Osteitis Scoring Scale. CT images were automatically segmented and analyzed for percentage opacification, mean Hounsfield unit of opacities, and percentage osteitis. These readouts were correlated with visual scoring systems and with disease parameters using the Spearman ρ.
RESULTS: Eighty-eight subjects were included. The algorithm successfully segmented 100% of scans and calculated features in a diverse population with CT images obtained on different scanners. A strong correlation existed between percentage opacification and the Lund-Mackay score (ρ = 0.85, P < .001). Both percentage opacification and the Lund-Mackay score exhibited moderate correlations with the Lund-Kennedy score (ρ = 0.58, P < .001, and ρ = 0.58, P < .001, respectively). The percentage osteitis correlated moderately with the Global Osteitis Scoring Scale (ρ = 0.48, P < .001).
CONCLUSIONS: Our quantitative processing of sinus CT images provides objective measures that correspond well to established visual scoring methods. While automation is a clear benefit here, validation may be needed in a prospective, multi-institutional setting.
ABBREVIATIONS:
- AI
- artificial intelligence
- CRS
- chronic rhinosinusitis
- CNN
- convolutional neural network
- GOSS
- Global Osteitis Scoring Scale
- LKS
- Lund-Kennedy score
- LMS
- Lund-Mackay score
- mHU
- mean Hounsfield Units
- %OST
- percentage of osteitis
- %SO
- percentage sinus opacification
- SNOT-22
- SinoNasal Outcomes Test-22
CT provides invaluable visualization of sinus anatomy and plays an essential role in the work-up of chronic rhinosinusitis (CRS), with an estimated 713,482 scans ordered in 2010 by otolaryngologists alone.1 The presence of sinus inflammation on CT is an objective diagnostic criterion for CRS.2-4 While CT has been used for objective sinus evaluation for decades, visual assessment of images is limited by variable interpretations, and results are generally reported in nonstandard or imprecise terms, which may or may not carry particular clinical significance.5 There exists a clear need for efficient, quantitative assessment of the degree of paranasal sinus inflammation on CT. Detailed, reproducible, and objective reports could be extremely valuable in clinical and research settings if performed in a simple, automated, and universal fashion.
Our group has developed a novel approach that uses deep learning, a form of artificial intelligence (AI) whereby a computer algorithm may “learn” to recognize image patterns in exemplar data.6,7 Using a convolutional neural network (CNN), one of the primary information-processing models of deep learning, this fully automated system produces precise 3D segmentations of the individual paranasal sinuses and allows quantitation of sinus cavity opacification (Fig 1). Initial validation of this approach was recently published, examining all comers presenting for multidisciplinary airway evaluation at a single tertiary care respiratory institution, and demonstrated very good correlation of the algorithm to the existing criterion standard visual scoring system, the Lund-Mackay score (LMS). However, certain outcome measures were not universally available in that cohort, such as surgical status, disease-specific quality-of-life indices, and endoscopic scores, and images were obtained from only 2 scanners at a single institution.

3D reconstructed sinus CT scan with bony overlay (gray) and segmentation of the paranasal sinuses (colored) produced by the algorithm.
The objectives of the current investigation expand the initial study in a number of ways. Here, we aimed to test a refinement of the initial algorithm, now capable of segmenting separate sinus cavities, in a strict CRS cohort with an extended set of disease-specific outcomes. Furthermore, segmentation and analysis were applied to images obtained from a variety of scanners and protocols commonly used in clinical practice to ascertain real-world applicability. Finally, we introduced and performed initial clinical validation of algorithmic characterization of 2 potentially important radiologic biomarkers in CRS, sinus osteitis and opacification density.
MATERIALS AND METHODS
Study Population
Subjects were enrolled from an institutional review board–approved (Colorado Multi-Institutional Review Board No. 14–0269) prospective cohort of patients undergoing rhinologic surgery at the University of Colorado Hospital from 2012 to 2018. Subjects who met the diagnostic criteria for CRS4 were included in the present study when all the following were available: thin cut (<1.25 mm) sinus CT images, serum eosinophil count within 6 months of surgery, and corresponding surgical pathology specimens stored at the University of Colorado Biorepository. Demographic and clinical data from these subjects were prospectively collected, including preoperative SinoNasal Outcomes Test 22 (SNOT-22) and the Lund-Kennedy score (LKS), performed and documented on the day of surgery by the senior surgeon (V.R.R.).
CT Image Acquisition and Quantitative Analysis
Subjects underwent sinus CT at the University of Colorado Hospital system as well as a number of different institutions in the metropolitan Denver area and beyond, with scans being performed on machines from various manufacturers. Scans were generally completed within 6 months before the date of surgery. Patients with scans obtained using in-office conebeam CT were excluded due to the substantial differences in image characteristics compared with traditional CT and the lack of pixel-intensity standardization to the Hounsfield unit scale.8 All CT examinations were downloaded from the PACS at the University of Colorado Hospital, de-identified, and then electronically transferred to the Quantitative Imaging Laboratory at National Jewish Health for analysis.
An initial CNN was developed, trained, tested, and validated as previously described.6 Details regarding the development of the current CNN are described in the Online Supplemental Data. The resulting algorithm was used to perform all quantitative analyses on the transferred scans using an Intel Core i9 7980XE CPU, Dual NVIDIA GeForce GTX 1080Ti GPUs, and 64GB RAM. The algorithm segments each sinus cavity individually, combining left and right sides except for the maxillary sinuses, which are segmented separately. A visual, qualitative assessment was performed on each segmentation produced by the algorithm to grossly check for accuracy.
Percentage sinus opacification (%SO) is determined by calculating the percentage of each segmentation cavity volume occupied by CT pixels ranging from −500 to +200 HU, a range corresponding to soft-tissue density; the individual cavity percentage volume opacifications were then averaged to control the effects of volume as follows:

We used an averaged sinus volume to calculate %SO as opposed to an overall total opacification percentage, given that the LMS does not factor in cavity size into its scoring system.
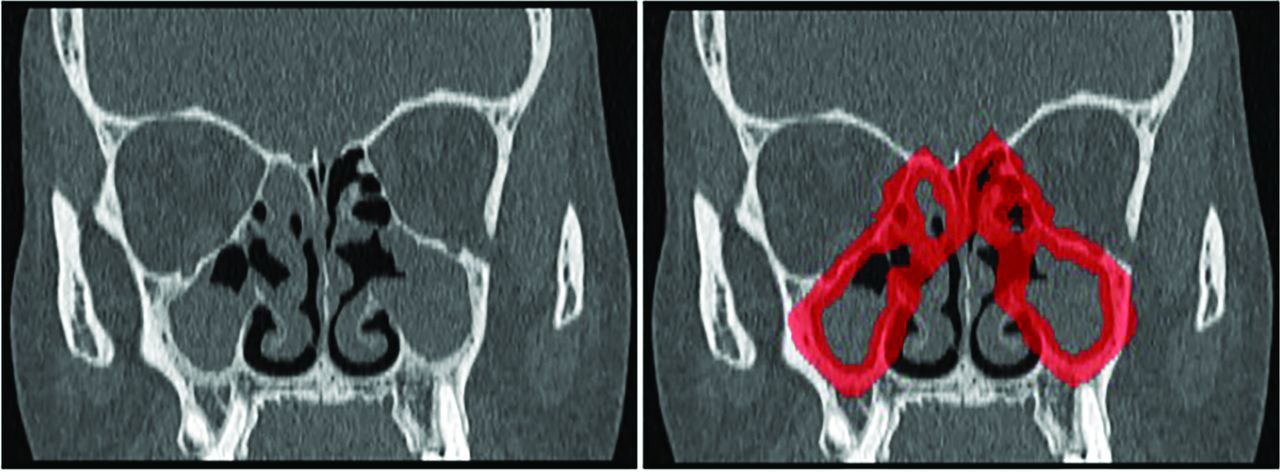
mHU is the mean Hounsfield unit value of the opacified regions within the total segmentation cavity, and it was applied to investigate soft-tissue hyperdensity that may be indicative of eosinophilic processes.9 The algorithm was also used to assess osteitis by generation of a 7-mm “rind” around the sinus cavity (Fig 2). This was achieved through dilation of the segmented sinus cavities by 5 mm, with subsequent subtraction of a copy of the sinus cavity segmentation that had been eroded by 2 mm. The percentage of this space occupied by bone (corresponding to a Hounsfield unit of ≥150) was used to calculate the percentage of osteitis (%OST). Additional details, including a schematic of the image-processing operations used to achieve %OST, are found in the Online Supplemental Data. This operation works to capture any bony expansion of the sinus cavity that one would expect in osteitic disease states.10

Illustration demonstrating application of osteitis segmentation rind. Left, Coronal CT with total GOSS score of 32. Right, Segmentation rind overlaid in red. Forty-eight percent of the rind is occupied by CT voxels corresponding to bone.
Visual Scoring
Lund-Mackay scoring was performed by 2 independent scorers (C.J.M., V.R.R.). Any difference of >1 between scores was resolved by consensus between the 2 parties. Scores differing by 1 point were averaged. If consensus was not achieved, a third party would decide the score (L.R.). Osteitis was assessed using the Global Osteitis Scoring Scale (GOSS).10 Scoring was also performed by 2 independent assessors (C.J.M., L.R.). A difference of >2 between scores was resolved in a similar fashion to that of the LMS with a third-party evaluator (V.R.R.). Scores differing by ≤2 points were averaged. All scorers had considerable experience interpreting sinus CT as senior rhinology faculty (V.R.R.) or otolaryngology resident physicians (C.J.M., L.R.).
Quantification of Tissue Eosinophilia
H&E-stained sections of sinus mucosa from surgical pathology specimens were retrieved from the University of Colorado Biorepository. Tissue eosinophil counts were performed as previously described, blinded to patient metadata and CT.11 Counts were performed in areas of densest cellular infiltrate to consistently determine eosinophil levels on the basis of areas of high inflammation. The absolute number of eosinophils per high-power field was recorded. This process was repeated in triplicate for each specimen, and the counts were averaged.
Statistical Analysis
Descriptive statistics on the study population were generated and reviewed. Univariate associations between algorithm-generated readouts, eg, %SO and %OST, and various clinical parameters were analyzed with the Spearman rank correlation. All statistical calculations and data visualization were performed in R, Version 3.6.0 (April 16, 2019; http://www.r-project.org/).
RESULTS
Study Population
Eighty-eight subjects met the inclusion criteria (Fig 3). Demographic data are summarized in Table 1. The mean age was 48.5 years, and 59% of subjects were women. Sixty-seven percent of subjects had a diagnosis of CRS with nasal polyps; 60% had comorbid asthma. Fifty-five percent of subjects reported a history of prior sinus surgery; validation of algorithmic performance in postsurgical patients has been previously performed.6 SNOT-22 and LKSs were incomplete or missing in 7 and 4 subjects, respectively.

Flow diagram demonstrating the cohort-selection process.
Demographics of the study population
Quantitative Percentage Opacification and Correlation with LMS
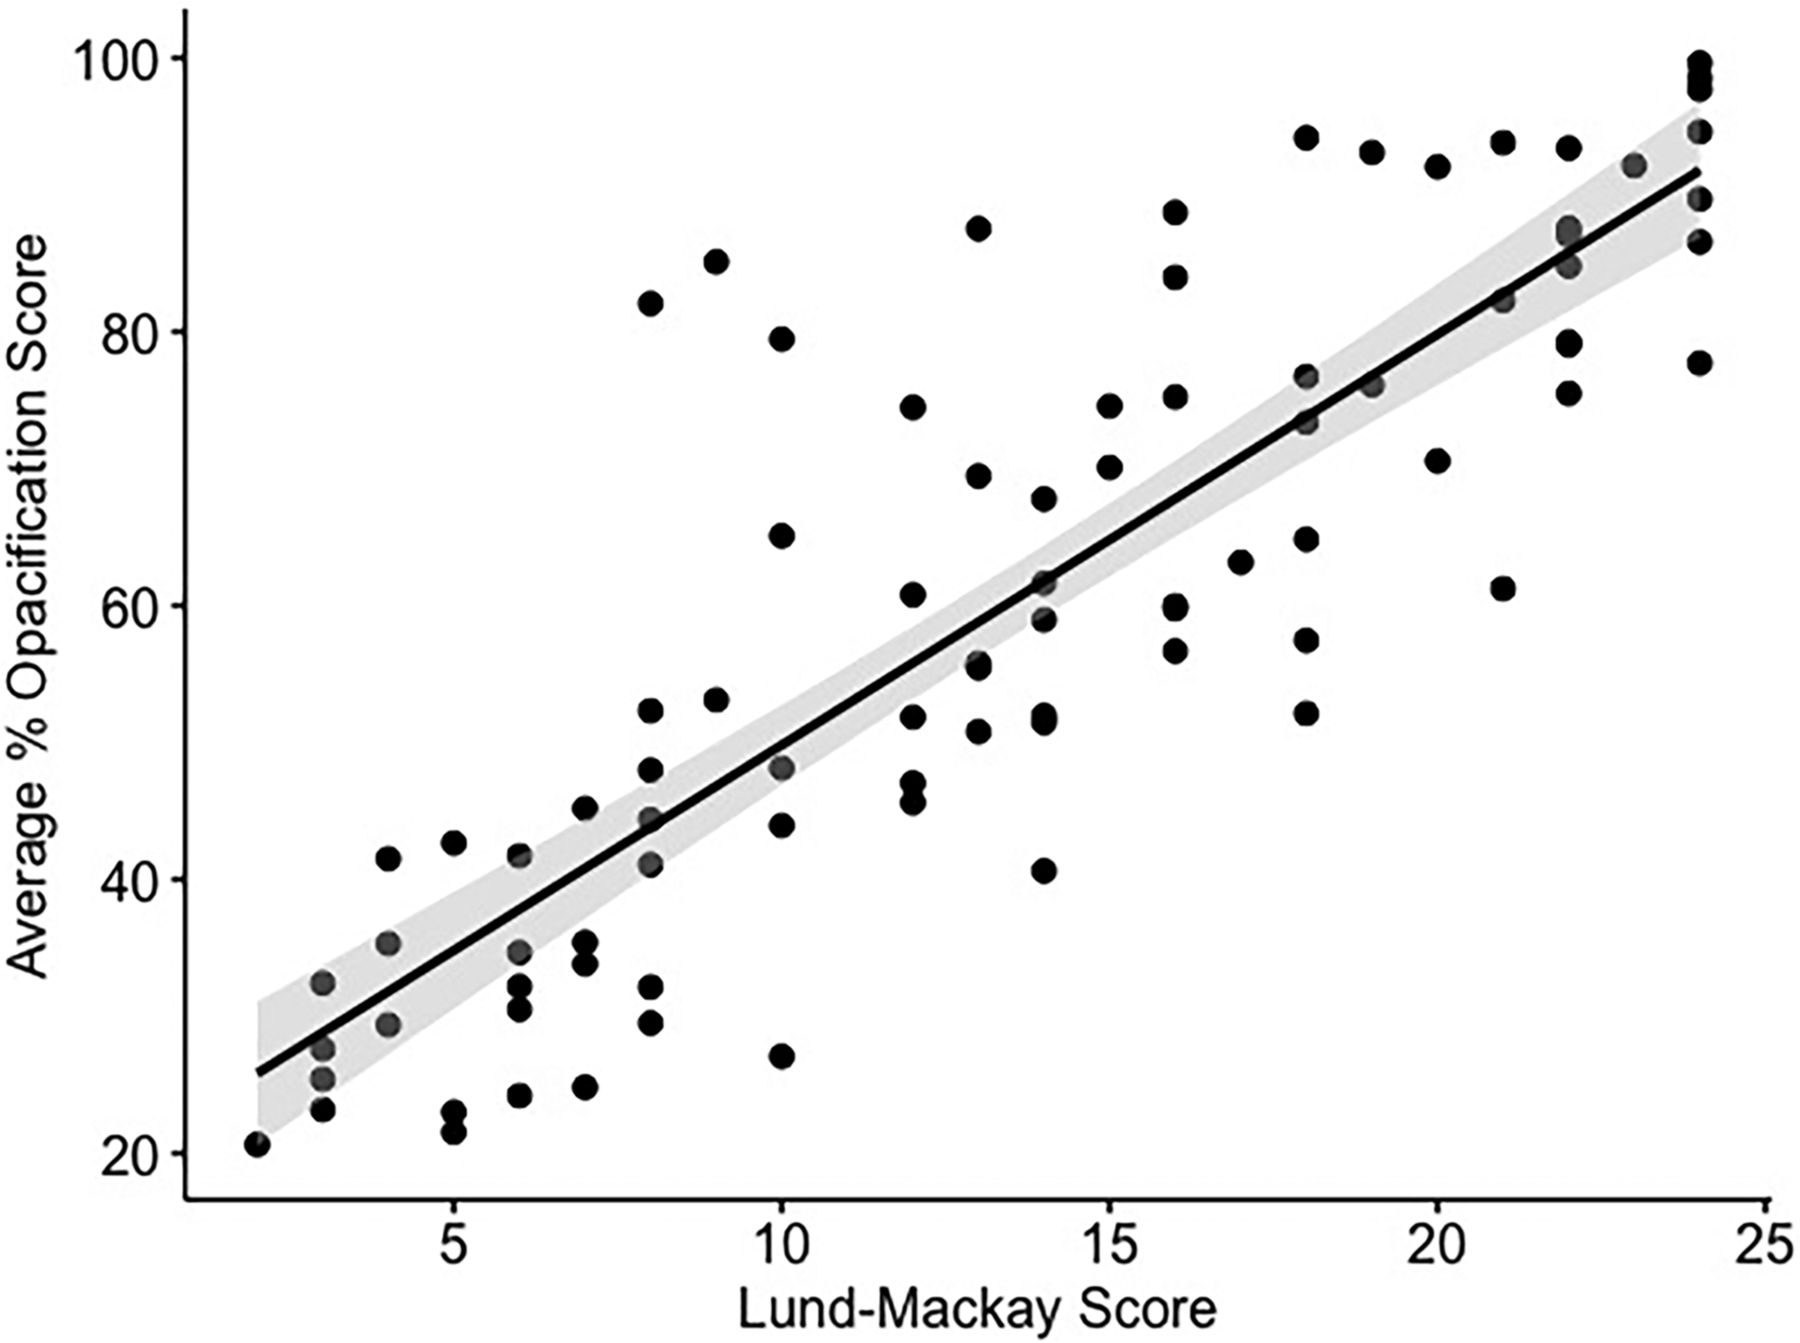
The CNN-based algorithm successfully segmented all 88 scans, which were acquired on scanners from 4 different manufacturers using 10 different reconstruction kernels (Table 2). The study population average %SO was 60.1% (range, 20.7%–99.6%). %SO correlated well with the LMS, as shown in Fig 4 (ρ = 0.85, P < .001). The intraclass correlation coefficient between LMS scorers demonstrated strong agreement (ρ = 0.92, P < .001).

Scatterplot demonstrating algorithm-generated %SO versus LMS. The gray shaded area represents a 95% confidence interval for the regression line (ρ = 0.85, P < .001).
CT scanner metrics and acquisition protocols used for the included scans
Osteitis Quantitation and Correlation with GOSS
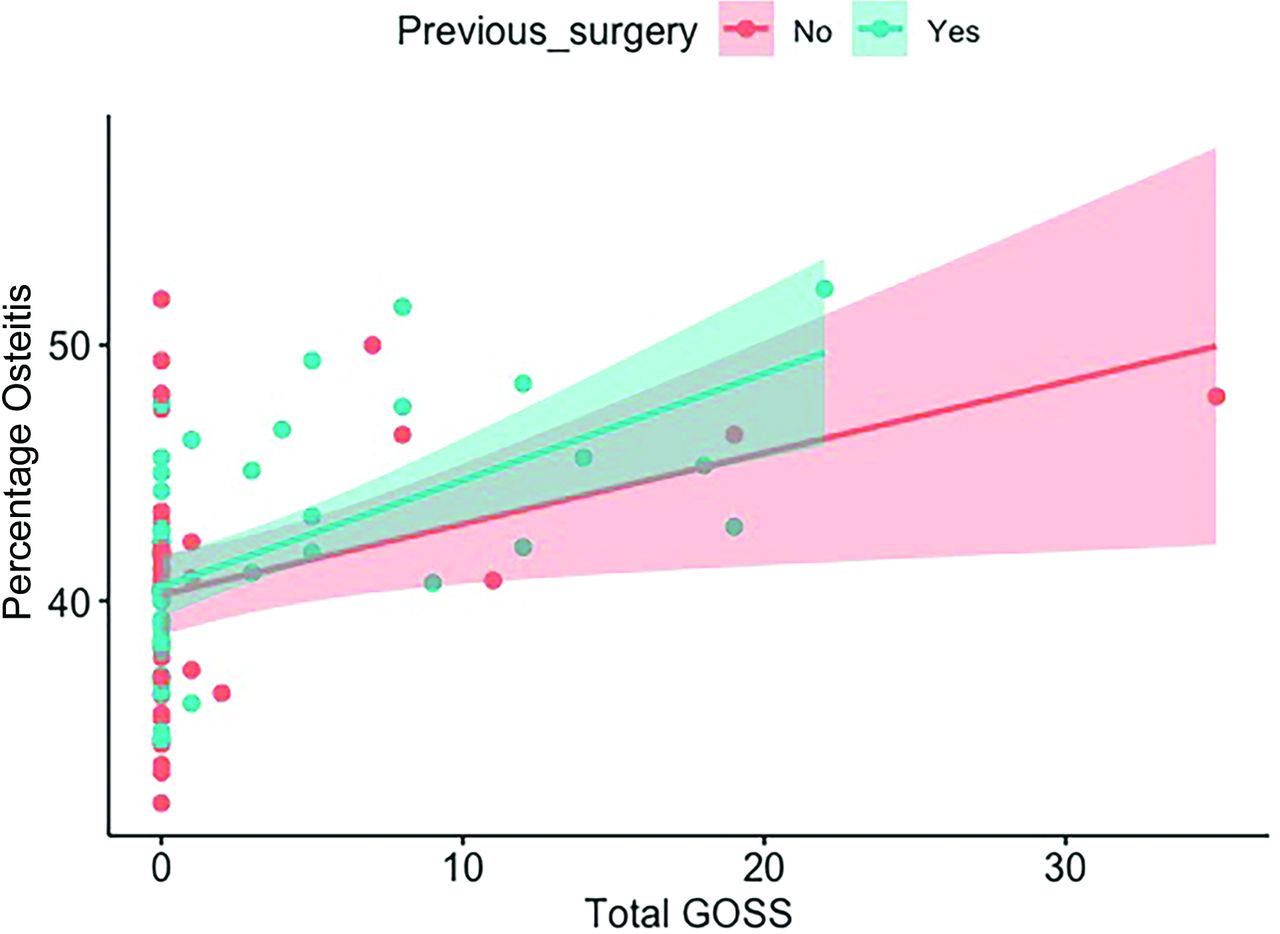
The overall average percentage of pixels corresponding to bone contained within the 7-mm segmentation rind (%OST) was 41% (range, 32%–52%). %OST exhibited a moderate-but-significant correlation with GOSS (ρ = 0.48, P < .001). The surgical status impacted correlation, with a weaker correlation demonstrated in the surgically naïve patients compared with patients with prior surgery, as shown in Fig 5. Linear regression was used to assess the impact of sinus cavity volume on the interaction between GOSS and %OST (R2 = 0.20, and 0.24 when adjusted for volume). The intraclass correlation coefficient between GOSS scorers demonstrated strong agreement (ρ = 0.83, P < .001).

Algorithm-derived %OST versus total GOSS as stratified by surgical status. Overall ρ = 0.48 (P < .05). For surgically naïve patients, ρ = 0.29 (P = .08), and for postoperative subjects, ρ = 0.59 (P < .001).
Associations between Algorithm-Derived Readouts and Clinical Parameters (LKS, SNOT-22, Tissue and Serum Eosinophil Levels)
Moderate associations were seen between algorithm-derived readouts (%SO, mHU) and endoscopic LKS. Weak associations were seen between algorithm-derived readouts and tissue eosinophil levels. Weak correlations were seen across the board with serum eosinophil counts, though statistical significance for mHU was not reached. No correlation was seen between CT-derived measures and SNOT-22. Associations between LMS and clinical parameters were similar to algorithm-generated associations and are presented in Table 3.
Correlation (ρ) values for CT-derived metrics and clinical parameters
Correlation between clinical parameters and percentage sinus opacification was also performed and is shown in Table 4. In general, stronger correlations were seen in the anterior and posterior ethmoid cavities for LKS, absolute serum eosinophil counts, and tissue eosinophil counts. These correlations illustrate that the bulk of the correlation strength seen in overall %SO is carried by these cavities.
Correlation (ρ) values for percentage sinus opacification stratified by sinus cavity and clinical parameters
DISCUSSION
Objective quantification of sinus mucosal disease is important for several reasons. From a clinical perspective, detailed quantification would allow a more nuanced understanding of inflammatory burden and response to therapy. For researchers, quantification systems are frequently used to objectively compare disease burden among different patients in cross-sectional analysis or longitudinally within-subject to document the efficacy of therapeutic interventions. Current objective CT scoring measures may not offer the necessary sensitivity for such comparisons.
Semiquantitative visual assessment of radiologic disease severity involves visual estimation of sinus opacification and grading with standardized scoring systems. While dozens of such scoring systems exist, the most widely accepted method used today is the LMS.12 While the LMS has demonstrated good interrater reliability and relative ease of use, a drawback of the LMS is that a score of 1 for a given cavity encompasses 99% of the radiologic disease spectrum, under which most sinus cavities will likely be classified. In other words, the LMS can distinguish those without disease and those with the most severe disease but has poor discrimination among patients with mild-to-moderate levels of disease for a given sinus cavity. Furthermore, the importance of ostiomeatal complex opacification has been reconsidered, and given the potential subjectivity of the 0-versus-2 score, it is not clear whether this measure is truly meaningful.13
Several groups have recognized this shortcoming and have sought to improve the LMS using computer-assisted volumetric analysis of sinus opacification.14,15 These methods aim to calculate the percentage of sinus cavity occupied by soft-tissue density, allowing characterization of mucosal inflammation on a continuous scale. While shown to improve the clinical utility of the LMS for the most part, these staging systems have failed to gain wide acceptance due to their unwieldy implementation. These methods rely on an experienced clinician or radiologist with knowledge of complex sinus anatomy to manually segment the sinus cavities for each patient. Even when using semiautomated computerized techniques, these methods are heavily time-consuming and potentially prone to human error.
Methods that strive to create more objective computer analysis of sinus CT have surfaced only recently. Chowdhury et al16 used deep learning to classify opacification of the ostiomeatal complex on selected 2D coronal sections. Using a CNN trained on 296 CT scans from patients with CRS, the authors reported that their method was able to correctly detect ostiomeatal complex opacification 85% of the time. To our knowledge, our group was the first to develop, test, and validate a fully automated deep learning–based algorithm capable of 3D volumetric segmentation of the paranasal sinuses on CT.6 In this proof-of-principle study, the algorithm was tested on subjects presenting for multidisciplinary respiratory evaluation at a single institution. The results showed that algorithm-derived quantitative assessment of the total percentage sinus opacification correlated well with the current criterion standard visual grading system, the LMS.
The current study expands on this work in several ways, with an overarching goal being further demonstrating the applicability and utility of a fully automated system for disease quantification, while also exploring novel radiologic disease-specific readouts. The current algorithm is capable of individual sinus cavity segmentation, a feature that was not yet developed in our initial report of our technique. Averaging of individual sinus cavities represents an improvement in overall characterization of sinus disease burden, considering that in this work, we demonstrate an overall %SO-versus-LMS correlation of 0.85, which is an increase compared with our initial work in which we reported a correlation of 0.82. While the study cohort in this work is smaller, it is an independent cohort consisting exclusively of patients with well-characterized CRS. We used a number of disease-specific metrics that were not available in the initial study, including polyp status, endoscopic disease assessments, quality-of-life surveys, and serum/tissue eosinophil measurement. Additionally, CT scans in the present study were obtained using several different scanner manufacturers with varied reconstruction kernel protocols, illustrating potential broad applicability of such an algorithm. That this approach was capable of successfully analyzing a diverse set of scans while producing an improved association with LMS to the initial study demonstrates promise in the wide-spread application of this AI technology.
We also explored the clinical significance of novel automated CT metrics that have been proposed in the literature. The significance of Hounsfield unit values of sinus opacities has been investigated previously, with 1 study showing that when the LMS is weighted by certain Hounsfield unit values, correlation of the weighted LMS score to symptom indices increased.17 Opacification hyperdensity has also been found to be a key radiologic biomarker for certain CRS subtypes, such as allergic fungal rhinosinusitis18 and eosinophilic mucin rhinosinusitis. Our algorithm is capable of calculating the mHU of opacified regions across all sinus cavities for a given study, a readout that has not been studied before. In the current study, mHU correlations to clinical parameters, in particular tissue and serum eosinophils, were lower than we had expected. While we had hypothesized that radiologic density measures would have correlated with eosinophilic inflammatory markers based on the known relationship between allergic fungal concretions and eosinophilic mucin, there is, in fact, a dearth of published data to support this theory, probably, in part, because an objective radiologic metric examining this issue has not been easily obtainable until now. Furthermore, our study was not powered to examine opacification density characteristics for diseases in which this may be important, such as eosinophilic CRS or allergic fungal rhinosinusitis. More study is needed to examine how this newly available radiologic measure can be used in these conditions.
We also investigated osteitis of bony lamellae in the sinus cavities, an important clinical marker that typically indicates recalcitrant or long-standing CRS disease status and may portend worse outcomes after endoscopic sinus surgery.19-22 This investigation was performed by assessing a 7-mm rind along the perimeter of each sinus cavity and determining what percentage of the rind was occupied by bone. We hypothesized that subjects with a greater degree of bony thickening would correlate to having a higher total GOSS, a currently applied radiologic measure of paranasal sinus osteitis. Our results showed a moderate correlation between the algorithm readout and the visual assessment. Stratifying the correlation by surgical status strengthened the correlation in postoperative subjects, possibly because these patients had more recalcitrant disease or from repeat insults from the surgery itself. Our initial method of assessment may be limited by patients who naturally have thicker bone but lack osteitic change; further refinement of this technique may be needed in the future.
We had hypothesized that an AI-based quantitative algorithm would offer a sensitive method to measure disease severity, and it seems to have performed similar to LMS measurements. Neither LMS nor quantitative %SO demonstrated any meaningful association with SNOT-22 scores in this cohort, supporting prior literature observations that likewise showed no relationship between CT disease burden and symptoms.23-25 As has been proposed in other work, biologic factors may play only a partial role in the determination of symptom burden and expression,26 and we are still a long way from deciphering how certain radiologic findings such as Hounsfield units can be used as biomarkers or as a method of endotyping patients with CRS.
Performing well compared with the criterion standard LMS, our AI-based approach has marked and obvious advantages in that it is rapid and completely automated and eliminates any bias or human error that may be part of a visual assessment. The algorithm, now demonstrating successful segmentation from scanners from multiple different manufacturers, also allows quantitation or detection of other important radiologic entities for clinical and research purposes, such as osteitis and assessment of opacification density.
Limitations of the current work include the retrospective study design. While use of a diverse set of scans may be argued as a potential drawback for a validation study, we think that this, in fact, represents a strength that showcases algorithm robustness with respect to varied scan-acquisition parameters, especially because initial validation work using a homogeneous cohort of scans has already been published by our group. Further validation and utility assessment will be of interest in a prospective multi-institutional trial setting.
CONCLUSIONS
Our CNN-based approach to sinus CT evaluation is capable of rapid and automated quantitative assessment, as demonstrated in this CRS cohort with images obtained from a diverse set of scanners. This AI technology performs well compared with the current criterion standard visual-assessment system. With further testing and continued refinement, quantitative assessment of sinus CT enabled by AI is poised to become a valuable tool for quantification of radiologic disease burden in both clinical and research applications.
Footnotes
This work was supported by an American Academy of Otolaryngology–Head and Neck Surgery CORE Grant and Xoran Technologies (C.J.M.); and Colorado Advanced Industries Accelerator Program (S.M.H.). V.R.R. and C.J.M. were supported, in part, by a grant from the National Institute on Deafness and Other Communication Disorders, one of the National Institutes of Health, Bethesda, Maryland (K23DC014747 and K23DC014747-04S1).
These funding organizations did not contribute to the design or conduct of this study, preparation, review, approval, or decision to submit this manuscript for publication.
Disclosure forms provided by the authors are available with the full text and PDF of this article at www.ajnr.org.
Indicates open access to non-subscribers at www.ajnr.org
References
- Received February 8, 2022.
- Accepted after revision June 18, 2022.
- © 2022 by American Journal of Neuroradiology


Jump to section
Related Articles
Cited By...
- No citing articles found.