
Abstract
BACKGROUND AND PURPOSE: MR imaging–based cerebral perfusion metrics can be obtained by tracing the passage of a bolus of contrast through the microvasculature of the brain parenchyma. Thus, the temporal signal pattern of the contrast agent is typically measured over a large artery such as the MCA to generate the arterial input function. The largest intracranial arteries in the brain may not always be suitable for selecting the arterial input function due to skull base susceptibility artifacts or reduced size from steno-occlusive disease. Therefore, a suitable alternative arterial input function window would be useful. The choroid plexus is a highly vascular tissue composed essentially of arterialized blood vessels and acellular stroma with low metabolic requirements relative to its blood flow and may be a suitable alternative to identify the arterial input function.
MATERIALS AND METHODS: We studied 8 healthy participants and 7 patients with gliomas who were administered a bolus of gadolinium. We selected an arterial input function from both the left and right M1 segments of the MCA and both lateral ventricles of the choroid plexus for each participant. We compared the changes in the T2* signal and the calculated resting perfusion metrics using the arterial input functions selected from the MCA and choroid plexus.
RESULTS: We found no systematic difference between resting perfusion metrics in GM and WM when calculated using an arterial input function from the MCA or choroid plexus in the same participant.
CONCLUSIONS: The choroid plexus provides an alternative location from which an arterial input function may be sampled when a suitable measure over an MCA is not available.
ABBREVIATIONS:
- AIF
- arterial input function
- CNR
- contrast-to-noise ratio
- CP
- choroid plexus
- ΔS
- voxelwise T2* signal changes
- GBCA
- gadolinium-based contrast agent
- rCBF
- relative CBF
- rCBV
- relative CBV
Resting perfusion metrics including MTT, relative CBF (rCBF), and relative CBV (rCBV) in the cerebral parenchyma as measured with MR imaging, require the introduction of a DSC agent as a tracer. The time course of the resulting T2*-weighted signal reduction measured in a major cerebral artery such as the MCA during the first pass of the contrast bolus is used to generate the required arterial input function (AIF). The resting perfusion metrics are calculated from the resulting signal change as the contrast agent passes through the microvasculature of the brain parenchyma, by applying the principles of tracer kinetic modeling. The idealized model is one of instantaneous entry of the contrast bolus into a voxel, ie, an impulse function.1 However, in practice, a gadolinium-based contrast agent (GBCA) injected IV as a tight bolus becomes increasingly dispersed at the confluence of veins during centripetal flow and in the passage through the cardiac chambers before it arrives in the cerebral arteries. Despite the dispersion of the bolus of contrast, reasonably accurate blood flow metrics can be achieved through deconvolution of the AIF with the bolus-induced signal changes at the tissue level.
The MCA is the largest intracranial artery measuring up to 3.5 mm in diameter2 and is responsible for most hemispheric blood flow. It is, therefore, the obvious choice for sampling the AIF. However, there are 2 issues that can confound accurate measurement of the AIF. The first is that the signal induced by the contrast is quadratic within the blood vessel and linear in the tissue outside the vessel.3 It was therefore suggested that voxels for sampling the AIF should be immediately adjacent to, but not from within, the MCA.4 Voxel sizes are typically similar in size to the MCA, and maintaining placement proximity while avoiding signal averaging from IV extravascular signals can be difficult. The second issue is that in some instances, there are susceptibility effects at the skull base distorting the B0 field homogeneity through which the major supply vessels must pass. The signal loss induced by these effects impairs accurate measurement of an AIF. As a result of these effects, it may not be possible to locate suitable voxels from which to obtain a reliable AIF in either MCA.
Here we explore a novel window from which to measure the AIF when MCAs are unsuitable for this purpose. In our experience of measuring increases of CBF in response to hypercapnia,5 we observed that there were no blood oxygen level–dependent signal changes in the choroid plexus (CP). This observation suggested that either the blood flow in the CP did not increase with hypercapnia (which is unlikely) or the CP did not contain venous blood that could be diluted by an increase in flow of arterial blood.6,7 The CP consists of small arteries embedded in an acellular matrix with an endothelium, which extracts little Oxygen relative to that available in the blood flow. We hypothesized that the “arterialized” blood vessels in the CP would be well-suited to provide an AIF of similar quality to that of the MCA for measuring resting perfusion measures. To test this hypothesis, we compared the calculated resting relative perfusion metrics obtained from the CP with those obtained from the MCA in healthy participants and patients with gliomas.
MATERIALS AND METHODS
Participants and Ethics Approval
This study conformed to the standards set by the latest revision of the Declaration of Helsinki and was approved by the Research Ethics Board of the University Health Network. Eight healthy participants (6 men) between the ages of 23 and 60 (mean, 33.0 [SD, 15.34] years) and 7 patients (5 men) between the ages of 39 and 67 (mean, 46.29 [SD, 12.22] years) with gliomas were recruited. All healthy participants were nonsmokers, not taking any medications, and had no history of neurologic, cardiovascular, or kidney disease. All participants provided written, informed consent before scanning.
MR Imaging Protocol
Imaging in the healthy participants was acquired using a 3T HDx Signa system (GE Healthcare) with an 8-channel head coil. Patient images were acquired during their routine clinical scans and were obtained on the institution's designated clinical scanner, a 3T Magnetom Vida system (Siemens) with a 32-channel head coil. Each participant underwent a protocol that consisted of a 3D T1-weighted sequence (∼5.5 minutes) followed by a T2*-weighted sequence (∼1.5 minutes) paired with an IV injection of GBCA. For the healthy participants, a 3D T1-weighted inversion recovery fast-spoiled gradient-recalled sequence was used with the following parameters: TI = 450 ms, TR = 7.88 ms, TE = 3.06 ms, flip angle = 12°, voxel size = 0.859 × 0.859 × 1 mm, matrix size = 256 × 256, 146 slices, FOV = 220 mm, no interslice gap. DSC data were acquired using a T2*-weighted gradient-echo echo-planar imaging sequence with the following parameters: TR = 1500 ms, TE = 30 ms, flip angle = 73°, 29 slices, voxel size = 3-mm isotropic, matrix size = 64 × 64. The patient group underwent a 3D T1-weighted MPRAGE (anatomical) sequence with the following parameters: TI = 900 ms, TR = 2200 ms, TE = 2.45 ms, flip angle = 8°, voxel size = 1 mm isotropic, matrix size = 256 × 256, 176 slices, FOV = 220 mm, no interslice gap. The DSC data for the patient group used T2*-weighted gradient EPI multiband sequence parameters: TR = 1750 ms, TE = 30 ms, flip angle = 80°, 56 slices, voxel size = 2.5 mm isotropic. During the DSC sequence for both groups, 5 mL of Gadovist (Bayer Schering Pharma) was injected IV at a rate of 5 mL/s (with no preload and a baseline delay of 30 seconds before injection) followed by 30 mL of saline at a rate of 5 mL/s.
Basic Data Analysis
The DSC images were first volume-registered, slice-time-corrected, and coregistered to their respective axial anatomical T1-weighted images using Analysis of Functional Neuroimaging software (National Institutes of Health).8 Analytic processing software (Statistical Parametric Mapping software [SPM8]) was used to segment the T1-weighted anatomical images into CSF, GM, and WM.9 The segmented masks for the patients with tumors included the nonenhancing tumor tissue and excluded the gadolinium-enhanced tissue.
AIF Selection
A cluster of 6–8 voxels from both the left and right M1 segments of the MCA (AIF-MCA) and both trigones of the lateral ventricles of the CP (AIF-CP) with the largest signal change were selected manually. From this cluster of voxels, the lowest full width at half maximum signal was chosen as the AIF. A total of 4 suitable AIFs were selected from the left and right MCAs (AIF-MCA1, AIF-MCA2) and from the left and right CP (AIF-CP1, AIF-CP2) for subsequent DSC analysis. MCA and CP voxel locations were confirmed by a neuroradiologist (D.J.M.).
Calculation of Contrast
Voxelwise T2* signal changes (ΔS) were calculated as the ratio of the difference between the signal at each timepoint (S) minus the minimum intensity (min [S]) divided by the baseline mean ( ) (Equation 1):

Signal variability in the MCA and CP AIFs was examined in the selected voxels. The percentage standard deviation (ΔSD) of the percentage signal changes (ΔS) was then calculated, and the contrast to noise ratio (CNR) was determined for each of the selected AIFs using the following equation:

Calculating Resting Perfusion Metrics
To account for arrival delay, we manually time-shifted the selected AIF-CP by approximately 1.4 seconds, the average time delay found between the T2* signal AIF-CP and AIF-MCA across all subjects. This step aligned the AIF-CP with the corresponding AIF-MCA. The T2* signal was converted to tissue concentration (R2*) as per Equation 3. Standard tracer kinetic modeling was used to calculate MTT and rCBV for both AIF selections, using the following parametrized method for deconvolving and fitting the residue function with an exponential as per Equation 4:


 represents the residue function. MTT and rCBV were determined using a least squares fitting procedure with MTT bound between 1 and 8 seconds. This method is described in greater detail in Poublanc et al.10
rCBF was calculated using the central volume theorem according to the following equation:

DSC perfusion maps were generated and overlayed onto their respective anatomical images. Average values for MTT, rCBF, and rCBV were calculated for GM and WM excluding values of >3 SDs as outliers that are assumed to be from noise and partial volume effects (MTT from 1 to 8 seconds; rCBF from 0 to 120 a.u. and rCBV from 0 to 10 a.u.).
Statistical Analysis
Statistical comparisons were performed within the healthy volunteer and patient groups on the ΔS and CNR calculated for each selected voxel (AIF-MCA1, AIF-MCA2, AIF-CP1, AIF-CP2) using a 1-way analysis of variance with an all pair-wise multiple comparisons correction (Holm-Sidak method) and α = .05 (Prism 9 software; GraphPad). Each of the selected AIFs were used to calculate MTT, rCBF, and rCBV. The coefficient of variation, defined as the SD divided by the mean, was calculated among the ΔS, CNR, and perfusion metrics determined between the 2 AIFs chosen in the MCA and CP, independently. Statistical comparisons within each were performed on average MTT, rCBF, and rCBV values for GM and WM among the multiple locations in the MCA and CP using a 1-way analysis of variance with an all pair-wise multiple comparisons correction (Holm-Sidak method) with α =.05. From the means of the calculated GM and WM perfusion averages, Bland-Altman plots were generated comparing the multiple locations in the MCA and CP.
RESULTS
AIF T2* Signals
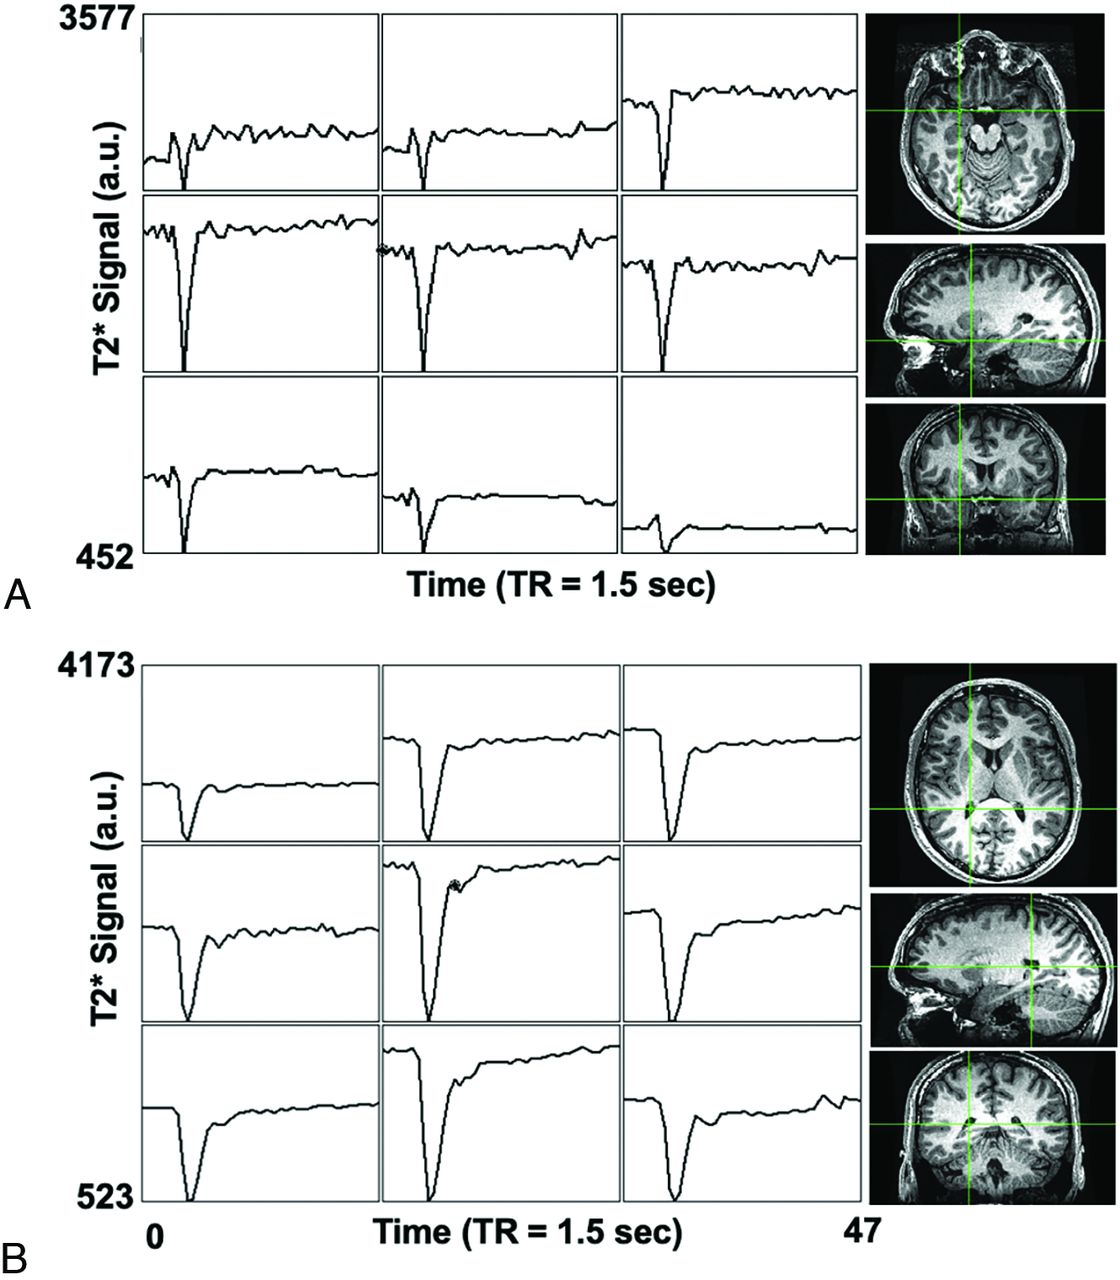
The MCA and CP DSC signal magnitude and time course were similar in all subjects. Figure 1 illustrates signal changes in contiguous voxels in the vicinity of the MCA and from the CP in a representative healthy participant. The temporal signal change in the CP AIF followed that of the MCA AIF, preceding a voxel T2* signal change located in a vein (Fig 2).

DSC voxel time-series in a representative healthy participant. The raw T2* signal time course in neighboring voxels adjacent to the MCA is shown in A and the CP in B. The green crosshairs in the T1 anatomical images show the corresponding locations of the center voxel in 3 planes for the MCA and CP AIF.

The scaled percentage signal changes across time after an injection of GBCA in the same healthy participant shown in Fig 1. A, The location of a voxel selected adjacent to the MCA, the superior sagittal sinus, and the CP. B, The scaled percentage signal change for each voxel as indicated in A.
AIF T2* Signal Comparisons
The T2* signal variability (percentage coefficient of variation) within and between the right and left MCA and CP AIF locations is presented in Table 1. The AIF 1-way analysis of variance factoring the AIF location (right and left MCA and CP) found no significant differences among any of these locations for ΔS and CNR in both groups. Each participant's ΔS and CNR for the 4 AIF locations are found in the Online Supplemental Data.
ΔS, CNR, and coefficient of variation (mean ± standard error of the mean) indices associated with the GBCA bolus time courses in the right-versus-left MCA and CP
Resting Perfusion Metrics
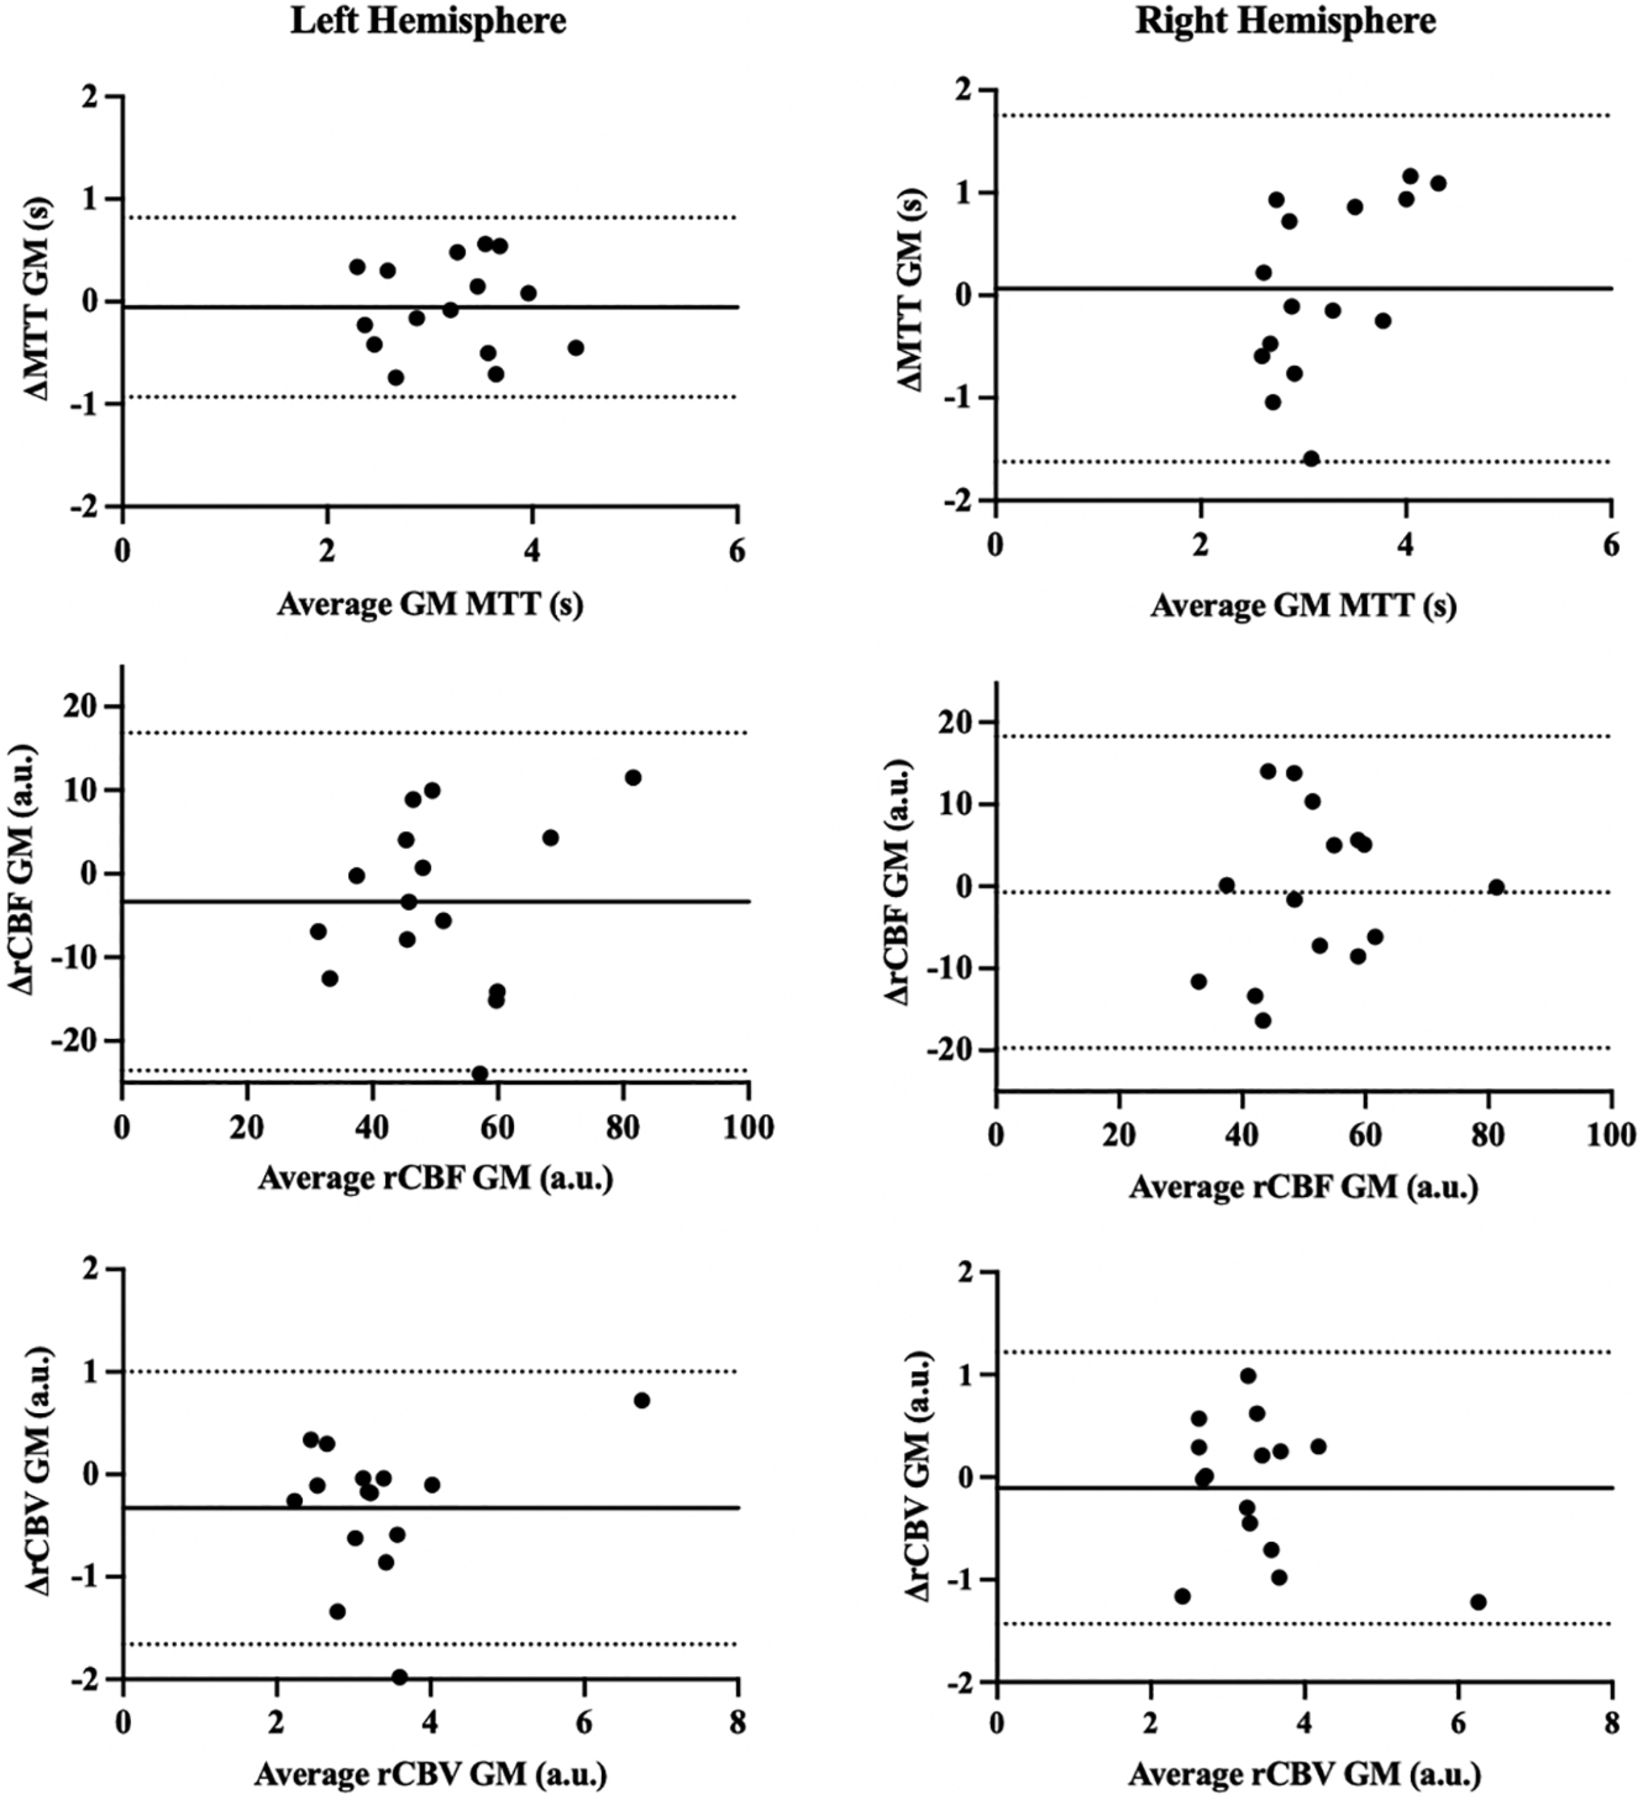
The 1-way analysis of variance comparison of resting perfusion measures for GM and WM factoring the AIF location (right MCA AIF, left MCA AIF, right CP AIF, left CP AIF) found no significant differences among any of these locations for MTT, rCBF, and rCBV in both groups. Each participant's average perfusion measures for GM and WM for the 4 AIF locations are found in the Online Supplemental Data. Bland-Altman plot analysis comparing the difference between perfusion metrics calculated using the MCA and CP (MCA1 versus CP1 and MCA2 versus CP2) in GM is presented in Fig 3 (WM plots are found in the Online Supplemental Data). Bland-Altman plot analysis comparing the variability between perfusion metrics using AIFs within the same location (MCA1 versus MCA2 and CP1 versus CP2) is presented in the Online Supplemental Data. The Bland-Altman plots have negligible constant bias or proportional bias among the AIF location choices.

Bland-Altman plots comparing GM perfusion metrics (MTT, rCBF, and rCBV) calculated using the MCA AIF and CP AIF selected from the left and right hemispheres. Δ GM perfusion metrics (MTT, rCBF, and rCBV) = AIF MCA – AIF CP. The solid line depicts bias, and the dashed lines show the 95% upper and lower limits of agreement as the mean difference.
Figures 4 and 5 illustrate the pattern and distribution of resting perfusion measures in a healthy volunteer and a patient with a glioma for an AIF selected in the MCA and CP. Each resting perfusion measure variability for GM and WM within and between the chosen AIF locations is summarized in Table 2.


Perfusion maps calculated using an AIF selected from both the MCA and the CP for a patient with a right frontal high-grade glioblastoma. Also shown are the patient's T1-weighted MPRAGE images. Note that leakage correction was not used.
Coefficient of variation between resting perfusion measures (MTT, rCBF, and rCBV) calculated using AIFs from the right-versus-left MCA and right-versus-left CP in the GM and WM
DISCUSSION
Main Findings
The main finding of this study is that there were no systematic differences in resting cerebral perfusion metrics calculated from an AIF measured at either the MCA or CP. These findings suggest that an AIF chosen from within the CP is comparable with one chosen from the MCA and may, therefore, be a useful alternative when there is no suitable MCA location to interrogate, for example, due to susceptibility artifacts at the skull base. An AIF selected from the CP is easier to acquire because of its larger size relative to the MCA and its location in a homogeneous magnetic environment. In addition, an AIF from the CP can be more consistently localized than the MCA as shown in Fig 1. It is therefore less sensitive to voxel placement for assessing signal changes induced by the passage of the contrast bolus.
AIF from the MCA versus the CP
Unlike CT perfusion in which a bolus of iodinated contrast agent shows a linear relationship between the concentration and x-ray attenuation, the signal intensity changes induced with GBCA are more complex. The pulse sequence used to acquire flow information following the administration of a bolus of GBCA measures the magnetic susceptibility effects of GBCA in the blood and in the adjacent tissue. The intravascular signal change with concentration is known to be quadratic,11 whereas the extravascular signal effects are linear. Therefore, the signal changes in a voxel used to measure the AIF will depend on the percentage of arterial blood in the voxel. In an ideal setting, the susceptibility would arise from outside the voxel and remain linear with GBCA concentration. The MCAs are located at the skull base where there are susceptibility effects generated by aerated paranasal sinuses that can obscure the vessels of interest. The position of the CP, on the other hand, is sufficiently distant from the skull base to be in a homogeneous B0 magnetic environment and can provide optimal voxel selection for measuring an AIF (Fig 1).
Several features of the CP, nevertheless, require additional consideration. The high amplitude of the AIF obtained from the CP may be attributed to the CP vessels remaining highly arterialized throughout their course, having a high flow comparable with that of other arteries. Furthermore, the extensive arterialization of CP vessels also produces a uniform T2* signal change.12 The pattern of contrast that is taken as the AIF is maintained (ie, not disrupted or dispersed) with successive branching of the arteries. In the case of an upstream stenosis, there should be no disruption of the AIF unless there is also collateral blood flow, which would then distort the AIF. This principle would be true, and thus limiting, for intracranial perfusion patterns distal to the MCA as well. The CP AIF was identified from the glomus of the CP.
There is a slight delay of AIF in the CP compared with the MCA because the path to the CP is longer than that to the MCA (Fig 2B). The MCA is a primary supply artery as opposed to the CP, which is a branch vessel with inherently longer blood-arrival times. Time-shifting of the selected AIF CP signal curves was required to align with the signal curves from the MCA to account for this delay.
Resting Perfusion Metrics Maps
In the maps presented in Fig 4, the rCBF scales differ between those using an MCA AIF and those using a CP AIF. This scaling difference arises because the rCBF and rCBV were not scaled to actual values but to show the range of values and emphasize the similarity in the spatial pattern of contrast. Consequently, the resting perfusion metrics maps based on AIFs for either the MCA or the CP generate the same pattern of MTT and rCBV when compared. By contrast, rCBF is presented with the same scale for maps calculated with AIFs from the MCA or the CP because it is calculated as the ratio of rCBV/MTT.
Limitations
The use of the CP for an AIF can be compromised by large cysts, calcifications, and xanthogranulomas, which represent desquamated epithelium into choroid plexus cysts.13 Selecting a CP AIF with calcifications and cysts would decrease the amplitude of the AIF but would not prevent its application. We suspect that these histologic variations would not induce major changes in the homogeneity of B0 to substantially alter the AIF calculation, but a larger series of subjects will be required for confirmation. Although there are other locations where the CP can be found, they are often not of sufficient size for selecting an AIF. CP-derived AIF may be confounded by partial volume effects. However, partial volume effects are less likely to occur in the CP because the structure is larger than the voxel size used, limiting the potential partial volume effects from adjacent CSF and/or cerebral tissue. Finally, comparing MCA-versus-CP AIF perfusion metrics against CBF metrics acquired using the current criterion standard Oxygen-15 labeled water PET CBF would be informative in ranking the accuracy of the 2 AIF selection methods.
The segmented masks used to calculate perfusion metrics for the patients with tumors excluded the gadolinium-enhanced tumor tissue, where effects of contrast leakage would confound flow measures. However, if this method were to be implemented clinically, existing leakage-correction methodologies including a low-preload-dose gadolinium injection,15 low flip angle gradient-echo,14 or a tissue residue function correction16 should be applied. As an additional note, Fig 1 shows that the signal baseline in the CP before the GBCA bolus and after it did not change. Gadolinium leakage occurs over a longer time scale than the passage of an initial Gadovist preload dose and whatever leakage that did occur was insufficient to shorten the T1 relaxation and therefore will not influence the AIF.
CONCLUSIONS
The findings from this study demonstrates that the selection of an AIF from the CP yields hemodynamic measures similar to those when selecting an AIF from the MCA. A CP AIF may be a useful alternative when the MCA is unsuitable for this purpose.
Footnotes
Disclosure forms provided by the authors are available with the full text and PDF of this article at www.ajnr.org.
Indicates open access to non-subscribers at www.ajnr.org
REFERENCES
- Received September 26, 2023.
- Accepted after revision November 2, 2023.
- © 2024 by American Journal of Neuroradiology


