Advertisement

Main menu

  • Home
  • Content
    • Current Issue
    • Accepted Manuscripts
    • Article Preview
    • Past Issue Archive
    • AJNR Case Collection
    • Case of the Week Archive
    • Classic Case Archive
    • Case of the Month Archive
  • Special Collections
    • Spinal CSF Leak Articles (Jan 2020-June 2024)
    • 2024 AJNR Journal Awards
    • Most Impactful AJNR Articles
  • Multimedia
    • AJNR Podcast
    • AJNR Scantastics
    • Video Articles
  • For Authors
    • Submit a Manuscript
    • Author Policies
    • Fast publishing of Accepted Manuscripts
    • Graphical Abstract Preparation
    • Manuscript Submission Guidelines
    • Imaging Protocol Submission
    • Submit a Case for the Case Collection
  • About Us
    • About AJNR
    • Editorial Board
  • More
    • Become a Reviewer/Academy of Reviewers
    • Subscribers
    • Permissions
    • Alerts
    • Feedback
    • Advertisers
    • ASNR Home
  • Other Publications
    • ajnr

User menu

  • Alerts
  • Log in

Search

  • Advanced search
American Journal of Neuroradiology

American Journal of Neuroradiology

ASHNR American Society of Functional Neuroradiology ASHNR American Society of Pediatric Neuroradiology ASSR
  • Alerts
  • Log in

Advanced Search

  • Home
  • Content
    • Current Issue
    • Accepted Manuscripts
    • Article Preview
    • Past Issue Archive
    • AJNR Case Collection
    • Case of the Week Archive
    • Classic Case Archive
    • Case of the Month Archive
  • Special Collections
    • Spinal CSF Leak Articles (Jan 2020-June 2024)
    • 2024 AJNR Journal Awards
    • Most Impactful AJNR Articles
  • Multimedia
    • AJNR Podcast
    • AJNR Scantastics
    • Video Articles
  • For Authors
    • Submit a Manuscript
    • Author Policies
    • Fast publishing of Accepted Manuscripts
    • Graphical Abstract Preparation
    • Manuscript Submission Guidelines
    • Imaging Protocol Submission
    • Submit a Case for the Case Collection
  • About Us
    • About AJNR
    • Editorial Board
  • More
    • Become a Reviewer/Academy of Reviewers
    • Subscribers
    • Permissions
    • Alerts
    • Feedback
    • Advertisers
    • ASNR Home
  • Follow AJNR on Twitter
  • Visit AJNR on Facebook
  • Follow AJNR on Instagram
  • Join AJNR on LinkedIn
  • RSS Feeds

Welcome to the new AJNR, Updated Hall of Fame, and more. Read the full announcements.


AJNR is seeking candidates for the position of Associate Section Editor, AJNR Case Collection. Read the full announcement.


Research ArticleNeurovascular/Stroke Imaging

Reducing False-Positives in CT Perfusion Infarct Core Segmentation Using Contralateral Local Normalization

Alexander Rau, Marco Reisert, Christian A. Taschner, Theo Demerath, Samer Elsheikh, Benedikt Frank, Martin Köhrmann, Horst Urbach and Elias Kellner
American Journal of Neuroradiology March 2024, 45 (3) 277-283; DOI: https://doi.org/10.3174/ajnr.A8111
Alexander Rau
aFrom the Department of Neuroradiology (A.R., C.A.T., T.D., S.E., H.U.), Medical Center–University of Freiburg, Faculty of Medicine, University of Freiburg, Freiburg, Germany
bDepartment of Diagnostic and Interventional Radiology (A.R.), Medical Center–University of Freiburg, Faculty of Medicine, University of Freiburg, Freiburg, Germany
  • Find this author on Google Scholar
  • Find this author on PubMed
  • Search for this author on this site
  • ORCID record for Alexander Rau
Marco Reisert
cMedical Physics, Department of Diagnostic and Interventional Radiology (M.R., E.K.), Medical Center–University of Freiburg, Faculty of Medicine, University of Freiburg, Freiburg, Germany
dDepartment of Stereotactic and Functional Neurosurgery (M.R.), Medical Center–University of Freiburg, Faculty of Medicine, University of Freiburg, Freiburg, Germany
  • Find this author on Google Scholar
  • Find this author on PubMed
  • Search for this author on this site
  • ORCID record for Marco Reisert
Christian A. Taschner
aFrom the Department of Neuroradiology (A.R., C.A.T., T.D., S.E., H.U.), Medical Center–University of Freiburg, Faculty of Medicine, University of Freiburg, Freiburg, Germany
  • Find this author on Google Scholar
  • Find this author on PubMed
  • Search for this author on this site
Theo Demerath
aFrom the Department of Neuroradiology (A.R., C.A.T., T.D., S.E., H.U.), Medical Center–University of Freiburg, Faculty of Medicine, University of Freiburg, Freiburg, Germany
  • Find this author on Google Scholar
  • Find this author on PubMed
  • Search for this author on this site
  • ORCID record for Theo Demerath
Samer Elsheikh
aFrom the Department of Neuroradiology (A.R., C.A.T., T.D., S.E., H.U.), Medical Center–University of Freiburg, Faculty of Medicine, University of Freiburg, Freiburg, Germany
  • Find this author on Google Scholar
  • Find this author on PubMed
  • Search for this author on this site
  • ORCID record for Samer Elsheikh
Benedikt Frank
eDepartment of Neurology and Center for Translational Neuro- and Behavioral Sciences (B.F., M.K.), University Hospital Essen, Essen, Germany
  • Find this author on Google Scholar
  • Find this author on PubMed
  • Search for this author on this site
Martin Köhrmann
eDepartment of Neurology and Center for Translational Neuro- and Behavioral Sciences (B.F., M.K.), University Hospital Essen, Essen, Germany
  • Find this author on Google Scholar
  • Find this author on PubMed
  • Search for this author on this site
  • ORCID record for Martin Köhrmann
Horst Urbach
aFrom the Department of Neuroradiology (A.R., C.A.T., T.D., S.E., H.U.), Medical Center–University of Freiburg, Faculty of Medicine, University of Freiburg, Freiburg, Germany
  • Find this author on Google Scholar
  • Find this author on PubMed
  • Search for this author on this site
  • ORCID record for Horst Urbach
Elias Kellner
cMedical Physics, Department of Diagnostic and Interventional Radiology (M.R., E.K.), Medical Center–University of Freiburg, Faculty of Medicine, University of Freiburg, Freiburg, Germany
  • Find this author on Google Scholar
  • Find this author on PubMed
  • Search for this author on this site
  • ORCID record for Elias Kellner
  • Article
  • Figures & Data
  • Supplemental
  • Info & Metrics
  • Responses
  • References
  • PDF
Loading

Abstract

BACKGROUND AND PURPOSE: The established global threshold of rCBF <30% for infarct core segmentation can lead to false-positives, as it does not account for the differences in blood flow between GM and WM and patient-individual factors, such as microangiopathy. To mitigate this problem, we suggest normalizing each voxel not only with a global reference value (ie, the median value of normally perfused tissue) but also with its local contralateral counterpart.

MATERIALS AND METHODS: We retrospectively enrolled 2830 CTP scans with suspected ischemic stroke, of which 335 showed obvious signs of microangiopathy. In addition to the conventional, global normalization, a local normalization was performed by dividing the rCBF maps with their mirrored and smoothed counterpart, which sets each voxel value in relation to the contralateral counterpart, intrinsically accounting for GM and WM differences and symmetric patient individual microangiopathy. Maps were visually assessed and core volumes were calculated for both methods.

RESULTS: Cases with obvious microangiopathy showed a strong reduction in false-positives by using local normalization (mean 14.7 mL versus mean 3.7 mL in cases with and without microangiopathy). On average, core volumes were slightly smaller, indicating an improved segmentation that was more robust against naturally low blood flow values in the deep WM.

CONCLUSIONS: The proposed method of local normalization can reduce overestimation of the infarct core, especially in the deep WM and in cases with obvious microangiopathy. False-positives in CTP infarct core segmentation might lead to less-than-optimal therapy decisions when not correctly interpreted. The proposed method might help mitigate this problem.

ABBREVIATIONS:

MA
microangiopathic alteration
NoMA
no microangiopathic alteration
rCBF
relative CBF
rCBV
relative CBV
Tmax
maximum of the residue function

In most centers, indication for therapy of acute stroke is based on multimodal CT imaging protocols that comprise noncontrast CT, CTA, and CTP imaging.1 CTP is a powerful tool in stroke imaging with proved high accuracy for the detection of ischemic lesions and the delineation of irreversibly damaged tissue (the so-called infarct core) and the penumbra that represents tissue potentially salvageable if reperfused. CTP was successfully employed as a selection criterion for endovascular therapy in 2 important trials, showing benefit for patients with limited-size-predicted infarct core and substantial salvageable brain tissue.2,3 Therefore, current stroke guidelines require CTP in patients with extended and unclear time windows.4 Despite recent studies on thrombectomy in patients presenting with large ischemic core,5,6 estimation of the infarct core by CTP is of central importance for patient selection in the prolonged time window.2,4

To approximate the infarct core and the penumbra, metrics based on the perfusion bolus dynamics are calculated and compared between ischemic and healthy tissue.7 In detail, the time to peak of the contrast agent bolus (Tmax; ie, the maximum of the residue function) is employed to assess a delay in perfusion. The Tmax is given in absolute units of seconds, and the typically used threshold of Tmax > 6 seconds represents a relevant delay.8 The CBF, on the other hand, cannot be easily quantified and is therefore typically normalized to a reference value. Typically, as reference, the median value of the hemisphere contralateral to the stroke side or the median CBF of the patient’s normally perfused tissue identified as Tmax ≤4 seconds is used. The infarct core is obtained by thresholding this normalized relative map with rCBF <30%.1,9

This “global” normalization approach can easily be implemented and standardized but is potentially hampered by several factors: It does not account for the differences in perfusion dynamics in GM and WM10⇓-12 and patient-individual characteristics, such as microangiopathic WM alterations.13 Especially the latter constitutes a major challenge in the calculation of perfusion values as the WM gliotic tissue shows a delayed and reduced perfusion already without acute vessel occlusion present.11,12,14 Whereas in general, overestimation of ischemic core volume is uncommon,15 these and other limitations can lead to false-positives in CTP infarct core segmentation16⇓-18 and thus to misleading therapy decisions when not correctly interpreted.19

To overcome this technical challenge and account for microangiopathy as an important co-pathology in the context of cerebrovascular disease, we propose a dual approach. In addition to normalizing CBF values in each voxel with a global reference value, we suggest an additional normalization with local regions from the contralateral counterpart when calculating relative perfusion metrics. This comprehensive method accounts for both global and local factors, enhancing the accuracy of the analysis.

MATERIALS AND METHODS

Participants

For this retrospective study, we included patients who received neuroimaging, including CTP due to a suspected stroke between 2014 and 2021. For data management and image processing, all images were exported and anonymized to a local instance of the imaging platform NORA (www.nora-imaging.org). We excluded all patients with nonischemic lesions, such as tumors or hemorrhages. Image data were individually assessed for quality and patients with substantial image artifacts (ie, due to movement) were excluded from further analysis. Image data and patient records were assessed for the presence of microangiopathic brain damage.20 We identified patients with relevant WM microangiopathic alterations (MA, eg, Fazekas >1) and assigned them to the MA group, whereas patients without relevant WM lesions (Fazekas 0 and 1) were assigned to the NoMA group. To accomplish this, an experienced neuroradiologist evaluated noncontrast CT data in 5-mm axial reconstructions by using a soft kernel. Furthermore, we excluded cases with old and bilateral infarctions.

The study was approved by the Institutional Review Board (Ethics Committee–University of Freiburg; EK 20/1047) and carried out in accordance with the Declaration of Helsinki and its later amendments. Due to the retrospective nature of this study, the need for written informed consent was waived.

CT Imaging

CT scans were performed on a 128–detector row (Somatom Definition Flash; Siemens) or a 64–detector row multidetector CT scanner (Somatom Definition 64 AS; Siemens). CTP series were acquired in the axial scan mode with the following protocols for the Somatom Definition Flash: 80 kV, 180 mAs, collimation = 16 × 1.2 mm, no gantry tilt, tube rotation time = 0.3 seconds, toggle technique (5 blocks × 0.3 = 1.5 seconds), z-coverage = 100 mm, section thickness = 5 mm, increment = 5 mm, 27 series every 1.5 seconds = 42 seconds scan time (effective temporal resolution in the middle of the plane = 1.5 seconds, in the periphery = 2.6 seconds) after intravenous (16–18 G) injection of 40 mL of Imeron 400 (iopamidol; Bracco) + 30 mL of sodium chloride (NaCl) at a flow rate of 6 mL/seconds.

The parameters for Somatom Definition 64 AS were as follows: 80 kV, 180 mAs, collimation =32 × 1.2 mm, no gantry tilt, tube rotation time = 0.3 seconds, toggle technique (5 blocks × 0.3 seconds = 1.5 seconds), z-coverage = 90 mm, section thickness = 5 mm, increment = 3 mm, 30 series every 1.5 seconds = 45 seconds scan time (effective temporal resolution in the middle of the plane = 1.5 seconds, in the periphery = 2.6 seconds) after intravenous (16–18 G) injection of 40 mL of Imeron 400 + 30 mL of NaCl at a flow rate of 6 mL/seconds.

Calculation of Perfusion Values

Perfusion scans were analyzed by using a research version of the software package VEOcore (VEObrain, www.veobrain.com). The software provides fully automated processing of perfusion scans, including motion correction, denoising, deconvolution by using Tikhonov regularization, and automated quality control. The output of the software is perfusion maps of relative CBF (rCBF), relative CBV (rCBV), and Tmax, as well as segmentations of hypoperfusion, core and mismatch, and corresponding volumes in milliliters by using the commonly established thresholds of Tmax > 6 seconds for delayed perfusion and rCBF <30% for the infarct core.2,21,22 Good agreement of VEOcore with other perfusion software has been demonstrated.23,24

Our study employed 2 distinct normalization approaches for thresholding the rCBF maps. First, we adopted the conventional well-established global normalization method, wherein each voxel’s value is normalized to the average value of the contralateral hemisphere.9 Mathematically, this normalization is achieved by dividing each voxel’s value by a common factor (ie, the median value of normally perfused tissue defined as Tmax ≤4 seconds).25 It is important to note that this process globally scales the rCBF map but retains the relative differences between voxels.

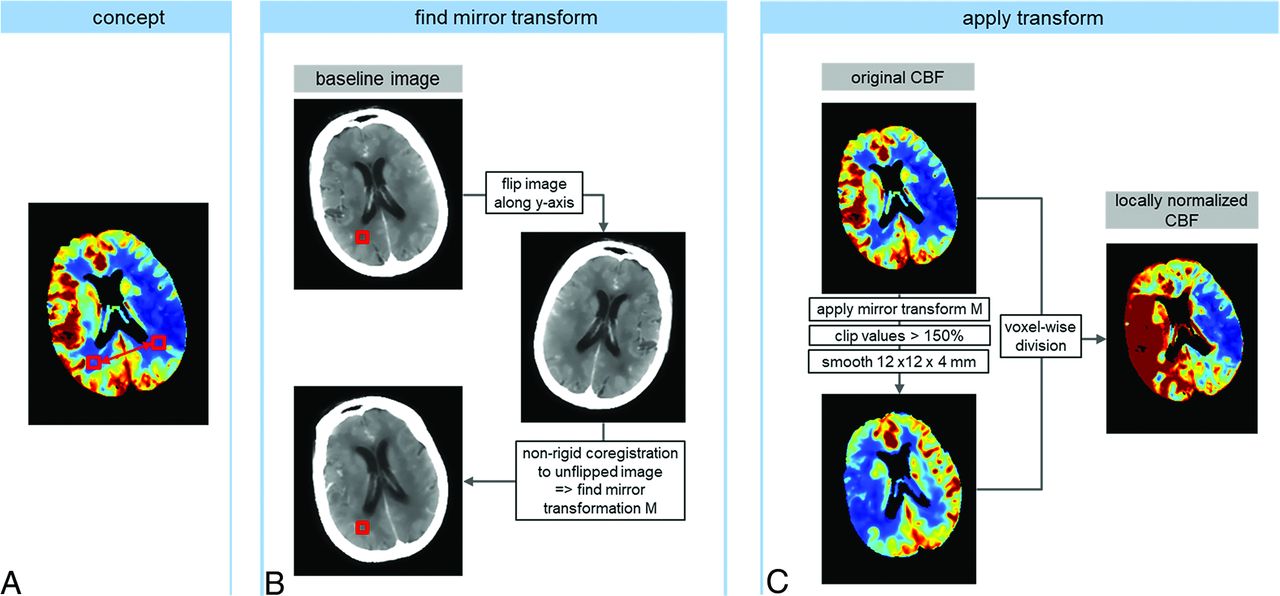
Additionally, we investigated the feasibility and potential of a more localized normalization approach (a schematic is provided in Fig 1). The concept behind this method is to normalize each voxel not to a global reference value but rather to its corresponding counterpart in the contralateral hemisphere. To achieve this, a transformation is required to map each voxel to its direct counterpart. This was obtained by nonrigid registration of the baseline image of the perfusion scan with a vertically mirrored copy of that image by using SPM12 (Wellcome Trust Center for Neuroimaging). When applying this transformation to the rCBF data array, a mirrored array can be obtained that directly relates each voxel to its contralateral counterpart. Normalization was then accomplished through voxelwise division of the original image (ie, the whole brain CBF map) by the mirrored one. However, several considerations were taken into account. Brain symmetry is rarely perfect, and registration inherently entails some degree of uncertainty. Moreover, division by noisy maps can introduce instabilities. Furthermore, very high flow values in the counterpart, particularly in large vessels, can result in very low values after division, potentially leading to false-positives. To address these issues, 2 precautionary measures were implemented before division: The mirrored image was clipped, meaning that any value exceeding 150% was capped at 150%, and the mirrored image then underwent smoothing with a Gaussian filter with a sigma of 12 × 12 × 4 mm.

FIG 1.
  • Download figure
  • Open in new tab
  • Download powerpoint
FIG 1.

Schematic of the workflow for global and local normalization of CT perfusion-derived CBF with subsequent thresholding to 30% to obtain a segmentation of the ischemic core. In the global approach, each voxel is normalized to the entire contralateral hemisphere, whereas in the local approach, a voxel is compared with a local region on the contralateral side. This leads to an equalization between GM and WM and thus a more distinct contrast in the perfusion maps.

The local approach allows each voxel’s value to be related to a local region of the contralateral hemisphere, inherently accommodating differences between GM and WM11 and accounting for patient-specific microangiopathic changes, which typically manifest symmetrically.26 With these locally normalized maps, a threshold of 30% can now be interpreted as 30% relative to a local contralateral region, rather than relative to an averaged reference value.

Finally, for both the globally and locally normalized rCBF maps, a threshold of relative rCBF <30% was applied. Subsequent morphologic image opening and closing operations were applied to remove speckle noise followed by the calculation of infarct volumes.27 To avoid false-positives on the healthy hemisphere, segmentations were restricted to the affected hemisphere only, determined as the one with the greater median Tmax.

Statistical Analyses

Statistical analyses were performed by using MATLAB (MathWorks). We generated correlation plots for both the NoMA and MA groups. The average changes in infarct volumes when comparing globally and locally normalized rCBF maps for both groups were assessed by relative means by using the linear regression coefficient and by absolute means by using the mean differences and SDs between both approaches derived from Bland-Altman plots between both approaches.

Data Availability

Data and code are available from the authors upon reasonable request and approval by the local ethics committee.

RESULTS

Participants

We retrospectively enrolled 2830 CTP scans of patients with suspected ischemic stroke (52% women, mean age 73 ± 15 years), of which 335 showed obvious signs of microangiopathy corresponding to the MA group. While age did not significantly differ between the MA and NoMA groups (P = .2), significantly more women had MA (P < .001). Further information is provided in the Table.

View this table:
  • View inline
  • View popup

Patient characteristics

Perfusion Values before and after Local Normalization

Correlation and Bland-Altman plots of the calculated core volumes by using both approaches are presented in Figure 2. On average, all volumes were reduced upon applying the local normalization approach. These reductions were significantly higher in the MA group (mean difference −14.7 mL, SD 14.6 mL, regression slope 0.62) and less pronounced in the NoMA group (mean difference −3.7 mL, SD 6.7 mL, regression slope 0.82) (P < .001). Visual assessment of the MA group perfusion maps revealed in particular a considerable reduction of positively scored voxels in the deep WM. Figures 3 and 4 show exemplary comparisons for both NoMa and MA cases.

FIG 2.
  • Download figure
  • Open in new tab
  • Download powerpoint
FIG 2.

Correlation plot (A) and Bland-Altman plot (B) comparing core volumes derived with global and local normalization for the NoMa and MA groups (black and red, respectively). Dashed lines indicate linear regression in the correlation plot, and 2 SDs in the Bland-Altman plot.

FIG 3.
  • Download figure
  • Open in new tab
  • Download powerpoint
FIG 3.

Comparison of global (left) and local (right) normalization for CBF maps and threshold-based ischemic core segmentations in 3 cases without and with WM small vessel disease.

FIG 4.
  • Download figure
  • Open in new tab
  • Download powerpoint
FIG 4.

Image data of an 83-year-old woman 5 hours after onset of a left MCA occlusion. CTP with global contralateral normalization (A) suggested an infarct core involving the centrum semiovale (B). In contrast, CTP with local contralateral normalization (C) did not display the deep WM as infarct core (D). The M1 segment was recanalized following one thrombectomy maneuver by using a 4 × 40 mm Solitaire stent (E, F). Follow-up MR imaging shows distinct microangiopathy (G, FLAIR), but only scattered subacute centrum semiovale infarct (H, DWI).

DISCUSSION

The proposed method of local normalization can significantly reduce the extent of false-positive voxels in infarct core segmentation, especially in the deep WM and in cases with obvious microangiopathy.

This is of considerable relevance for the application of CTP in clinical routine as perfusion imaging is an increasingly utilized component in the workup and management of patients with acute ischemic stroke, as the decision to use recanalizing therapy frequently relies on CTP results.4 False-positive voxels in perfusion imaging–derived calculations can thus erroneously influence therapy decisions.

Our data suggest that especially microangiopathic changes in the deep WM constitute a relevant influence on the calculation of infarct core volumes. In the context of cerebrovascular disease, microangiopathic changes are a frequent co-pathology in patients with vascular disease,28 so a correction of false-positive values caused by microangiopathy might be relevant in the presence of small vessel disease. This is corroborated by the fact that we noted a substantially higher reduction of core volumes in cases with microangiopathy versus without. Moreover, visual inspection of cases with small vessel disease revealed that the proposed correction method mainly removed false-positives in the deep WM, which is supported by the case in Figure 4.

However, in patients without obvious microangiopathy, the local normalization approach also resulted in a reduction of infarct volumes of ∼3.7 mL, or 18% on average. Again, this was attributed to WM regions, where the blood flow is naturally lower compared with the GM.10,11,29⇓⇓-32 In contrast to the global normalization, the introduced local approach allowed for a more distinct calculation of the perfusion in the GM and WM, thus leading to fewer voxels identified as ischemic upon applying the threshold of rCBF <30%. Whether such voxels truly are false-positives, or whether the threshold of rCBF <30% needs to be adapted to better delineate the ischemic tissue and avoid underestimation requires evaluation in future studies, including follow-up imaging.

Previously, the term “ghost infarct core” was introduced to characterize instances of false-positives in infarct core segmentation,16 and several underlying factors, such as poor collaterals, have been suggested.17⇓-19 In our study, we have identified and analyzed an additional factor that warrants consideration.

Novel infarct segmentation techniques leveraging deep learning are rapidly advancing.33⇓⇓⇓-37 These techniques not only perform with sufficient precision but also allow for a more multiparametric approach by simultaneously taking information from different raw data and derived features into account. Furthermore, some methods are able to account for contralateral asymmetries through innovative data augmentation methods, such as vertical image flipping.33 Against this, we perceive our local normalization approach not as a competitor to deep learning but rather as a potentially valuable contribution to both conventional and deep learning–based postprocessing. It is important to recognize that the effectiveness of deep learning substantially hinges on preprocessing steps and the judicious selection of appropriate training data sets, and our work offers insights that can potentially aid in refining deep learning models in both aspects.

In principle, differential GM and WM perfusion or microangiopathic damage may not only impact rCBF, but also Tmax.13 However, because Tmax is directly quantified in units of seconds and thus does not require normalization, and GM versus WM differences are less pronounced in Tmax,11 we did not consider a local normalization for Tmax in the context of this study.

For rCBV evaluation, on the other hand, a local contralateral normalization might also offer benefits regarding visual and quantitative scoring of collateralization, as illustrated in the Online Supplemental Data for exemplary cases. A more detailed analysis of rCBV was beyond the scope of the present study and might be part of future research.

A general limitation of our work is the fact that we do not have a consistent reference standard, for example, an MR imaging examination as close in time as possible or a follow-up MR imaging indicating the final infarct volume. Also, an underlying assumption of our approach is that microangiopathic changes are largely symmetrical, which may not be true in rare cases. Another limitation is associated with the “healthy” hemisphere. In cases involving old or bilateral infarctions, this might lead to biased results (Online Supplemental Data). This issue is also pertinent in the global approach, but more pronounced when using local normalizations. It is crucial in such instances to cross-reference with the globally normalized maps for a more comprehensive assessment. Moreover, the local normalization approach induced a rather unusual impression of the rCBF maps and might hamper the assessment of the “healthy” hemisphere as visible in the exemplary cases in which the image impression is more of a mirrored picture of the ischemic hemisphere and does not allow for an intrahemispheric assessment of rCBF values. Hence, the proposed approach of a local contralateral normalization must not replace the conventional rCBF calculation but rather supplement it in cases with suspected false-positives (eg, due to severe microangiopathy). Additionally, our results should raise attention to the potential impact of microangiopathy on rCBF values.

CONCLUSIONS

A local normalization of CTP parameters in addition to the global normalization might reduce false-positives in CTP infarct core segmentation that could potentially lead to suboptimal therapy decisions.

Footnotes

  • Disclosure forms provided by the authors are available with the full text and PDF of this article at www.ajnr.org.

REFERENCES

  1. 1.↵
    1. Demeestere J,
    2. Wouters A,
    3. Christensen S, et al
    . Review of perfusion imaging in acute ischemic stroke. Stroke 2020;51:1017–24 doi:10.1161/STROKEAHA.119.028337 pmid:32008460
    CrossRefPubMed
  2. 2.↵
    1. Albers GW,
    2. Marks MP,
    3. Kemp S
    , DEFUSE 3 Investigators, et al. Thrombectomy for stroke at 6 to 16 hours with selection by perfusion imaging. N Engl J Med 2018;378:708–18 doi:10.1056/NEJMoa1713973 pmid:29364767
    CrossRefPubMed
  3. 3.↵
    1. Nogueira RG,
    2. Jadhav AP,
    3. Haussen DC
    , DAWN Trial Investigators, et al. Thrombectomy 6 to 24 hours after stroke with a mismatch between deficit and infarct. N Engl J Med 2018;378:11–21 doi:10.1056/NEJMoa1706442 pmid:29129157
    CrossRefPubMed
  4. 4.↵
    1. Powers WJ,
    2. Rabinstein AA,
    3. Ackerson T, et al
    . Guidelines for the early management of patients with acute ischemic stroke. 2019 Update to the 2018 Guidelines for the Early Management of Acute Ischemic Stroke: a guideline for healthcare professionals from the American Heart Association/American Stroke Association. Stroke 2019;50:e344–e418 doi:10.1161/STR.0000000000000211 pmid:31662037
    CrossRefPubMed
  5. 5.↵
    1. Sarraj A,
    2. Hassan AE,
    3. Abraham MG
    , SELECT2 Investigators, et al. Trial of endovascular thrombectomy for large ischemic strokes. N Engl J Med 2023;388:1259–71 doi:10.1056/NEJMoa2214403 pmid:36762865
    CrossRefPubMed
  6. 6.↵
    1. Huo X,
    2. Ma G,
    3. Tong X
    , ANGEL-ASPECT Investigators, et al. Trial of endovascular therapy for acute ischemic stroke with large infarct. N Engl J Med 2023;388:1272–83 doi:10.1056/NEJMoa2213379 pmid:36762852
    CrossRefPubMed
  7. 7.↵
    1. Konstas AA,
    2. Goldmakher GV,
    3. Lee TY, et al
    . Theoretic basis and technical implementations of CT perfusion in acute ischemic stroke: 1. Theoretic basis. AJNR Am J Neuroradiol 2009;30:662–68 doi:10.3174/ajnr.A1487 pmid:19270105
    Abstract/FREE Full Text
  8. 8.↵
    1. Olivot JM,
    2. Mlynash M,
    3. Inoue M
    , DEFUSE 2 Investigators, et al. Hypoperfusion intensity ratio predicts infarct progression and functional outcome in the DEFUSE 2 cohort. Stroke 2014;45:1018–23 doi:10.1161/STROKEAHA.113.003857 pmid:24595591
    Abstract/FREE Full Text
  9. 9.↵
    1. Campbell BC,
    2. Christensen S,
    3. Levi CR, et al
    . Cerebral blood flow is the optimal CT perfusion parameter for assessing infarct core. Stroke 2011;42:3435–40 doi:10.1161/STROKEAHA.111.618355 pmid:21980202
    Abstract/FREE Full Text
  10. 10.↵
    1. Falcao AL,
    2. Reutens DC,
    3. Markus R, et al
    . The resistance to ischemia of white and gray matter after stroke. Ann Neurol 2004;56:695–701 doi:10.1002/ana.20265 pmid:15505775
    CrossRefPubMed
  11. 11.↵
    1. Chen C,
    2. Bivard A,
    3. Lin L, et al
    . Thresholds for infarction vary between gray matter and white matter in acute ischemic stroke: a CT perfusion study. J Cereb Blood Flow Metab 2019;39:536–46 doi:10.1177/0271678X17744453 pmid:29172990
    CrossRefPubMed
  12. 12.↵
    1. Arakawa S,
    2. Wright PM,
    3. Koga M, et al
    . Ischemic thresholds for gray and white matter: a diffusion and perfusion magnetic resonance study. Stroke 2006;37:1211–16 doi:10.1161/01.STR.0000217258.63925.6b pmid:16574931
    Abstract/FREE Full Text
  13. 13.↵
    1. Marstrand JR,
    2. Garde E,
    3. Rostrup E, et al
    . Cerebral perfusion and cerebrovascular reactivity are reduced in white matter hyperintensities. Stroke 2002;33:972–76 doi:10.1161/01.str.0000012808.81667.4b pmid:11935046
    Abstract/FREE Full Text
  14. 14.↵
    1. Shi Y,
    2. Thrippleton MJ,
    3. Makin SD, et al
    . Cerebral blood flow in small vessel disease: a systematic review and meta-analysis. J Cereb Blood Flow Metab 2016;36:1653–67 doi:10.1177/0271678X16662891 pmid:27496552
    CrossRefPubMed
  15. 15.↵
    1. Hoving JW,
    2. Marquering HA,
    3. Majoie CB, et al
    . Volumetric and spatial accuracy of computed tomography perfusion estimated ischemic core volume in patients with acute ischemic stroke. Stroke 2018;49:2368–75 doi:10.1161/STROKEAHA.118.020846 pmid:30355095
    CrossRefPubMed
  16. 16.↵
    1. Boned S,
    2. Padroni M,
    3. Rubiera M, et al
    . Admission CT perfusion may overestimate initial infarct core: the ghost infarct core concept. J Neurointerv Surg 2017;9:66–69 doi:10.1136/neurintsurg-2016-012494 pmid:27566491
    Abstract/FREE Full Text
  17. 17.↵
    1. Martins N,
    2. Aires A,
    3. Mendez B, et al
    . Ghost infarct core and admission computed tomography perfusion: redefining the role of neuroimaging in acute ischemic stroke. Interv Neurol 2018;7:513–21 doi:10.1159/000490117 pmid:30410531
    CrossRefPubMed
  18. 18.↵
    1. Rodrigues GM,
    2. Mohammaden MH,
    3. Haussen DC, et al
    . Ghost infarct core following endovascular reperfusion: a risk for computed tomography perfusion misguided selection in stroke. Int J Stroke 2021 Nov 19 [Epub ahead of print] doi:10.1177/17474930211056228 pmid:34796765
    CrossRefPubMed
  19. 19.↵
    1. Ballout AA,
    2. Oh SY,
    3. Huang B, et al
    . Ghost infarct core: a systematic review of the frequency, magnitude, and variables of CT perfusion overestimation. J Neuroimaging 2023;33:716–24 doi:10.1111/jon.13127 pmid:37248074
    CrossRefPubMed
  20. 20.↵
    1. Fazekas F,
    2. Chawluk JB,
    3. Alavi A, et al
    . MR signal abnormalities at 1.5 T in Alzheimer’s dementia and normal aging. AJR Am J Roentgenol 1987;149:351–56 doi:10.2214/ajr.149.2.351 pmid:3496763
    CrossRefPubMed
  21. 21.↵
    1. Lin L,
    2. Bivard A,
    3. Krishnamurthy V, et al
    . Whole-brain CT perfusion to quantify acute ischemic penumbra and core. Radiology 2016;279:876–87 doi:10.1148/radiol.2015150319 pmid:26785041
    CrossRefPubMed
  22. 22.↵
    1. Olivot JM,
    2. Mlynash M,
    3. Thijs VN, et al
    . Optimal Tmax threshold for predicting penumbral tissue in acute stroke. Stroke 2009;40:469–75 doi:10.1161/STROKEAHA.108.526954 pmid:19109547
    Abstract/FREE Full Text
  23. 23.↵
    1. Psychogios MN,
    2. Sporns PB,
    3. Ospel J, et al
    . Automated perfusion calculations vs. visual scoring of collaterals and CBV-ASPECTS: has the machine surpassed the eye? Clin Neuroradiol 2021;31:499–506
    CrossRefPubMed
  24. 24.↵
    1. Kellner E,
    2. Urbach H
    . Machine outputs must be checked. Clin Neuroradiol 2021;31:507–08 doi:10.1007/s00062-021-01012-6 pmid:33835191
    CrossRefPubMed
  25. 25.↵
    1. Amukotuwa S,
    2. Straka M,
    3. Aksoy D, et al
    . Cerebral blood flow predicts the infarct core: new insights from contemporaneous diffusion and perfusion imaging. Stroke 2019;50:2783–89 doi:10.1161/STROKEAHA.119.026640 pmid:31462191
    CrossRefPubMed
  26. 26.↵
    1. Veldsman M,
    2. Kindalova P,
    3. Husain M, et al
    . Spatial distribution and cognitive impact of cerebrovascular risk-related white matter hyperintensities. Neuroimage Clin 2020;28:102405 doi:10.1016/j.nicl.2020.102405 pmid:32971464
    CrossRefPubMed
  27. 27.↵
    1. Kellner E,
    2. Rau A,
    3. Demerath T, et al
    . Contrast bolus interference in a multimodal CT stroke protocol. AJNR Am J Neuroradiol 2021;42:1807–14 doi:10.3174/ajnr.A7247 pmid:34413063
    Abstract/FREE Full Text
  28. 28.↵
    1. Georgakis MK,
    2. Duering M,
    3. Wardlaw JM, et al
    . WMH and long-term outcomes in ischemic stroke: a systematic review and meta-analysis. Neurology 2019;92:e1298–308 doi:10.1212/WNL.0000000000007142 pmid:30770431
    Abstract/FREE Full Text
  29. 29.↵
    1. Bristow MS,
    2. Simon JE,
    3. Brown RA, et al
    . MR perfusion and diffusion in acute ischemic stroke: human gray and white matter have different thresholds for infarction. J Cereb Blood Flow Metab 2005;25:1280–87 doi:10.1038/sj.jcbfm.9600135 pmid:15889043
    CrossRefPubMed
  30. 30.↵
    1. Schaefer PW,
    2. Roccatagliata L,
    3. Ledezma C, et al
    . First-pass quantitative CT perfusion identifies thresholds for salvageable penumbra in acute stroke patients treated with intra-arterial therapy. AJNR Am J Neuroradiol 2006;27:20–25 pmid:16418350
    PubMed
  31. 31.↵
    1. Eilaghi A,
    2. d’Esterre CD,
    3. Lee TY, et al
    . Toward patient-tailored perfusion thresholds for prediction of stroke outcome. AJNR Am J Neuroradiol 2014;35:472–77 doi:10.3174/ajnr.A3740 pmid:24113471
    Abstract/FREE Full Text
  32. 32.↵
    1. d’Esterre CD,
    2. Boesen ME,
    3. Ahn SH, et al
    . Time-dependent computed tomographic perfusion thresholds for patients with acute ischemic stroke. Stroke 2015;46:3390–97 doi:10.1161/STROKEAHA.115.009250 pmid:26514186
    Abstract/FREE Full Text
  33. 33.↵
    1. Clèrigues A,
    2. Valverde S,
    3. Bernal J, et al
    . Acute ischemic stroke lesion core segmentation in CT perfusion images using fully convolutional neural networks. Comput Biol Med 2019;115:103487 doi:10.1016/j.compbiomed.2019.103487 pmid:31629272
    CrossRefPubMed
  34. 34.↵
    1. Rava RA,
    2. Podgorsak AR,
    3. Waqas M, et al
    . Investigation of convolutional neural networks using multiple computed tomography perfusion maps to identify infarct core in acute ischemic stroke patients. J Med Imaging (Bellingham) 2021;8:014505 doi:10.1117/1.JMI.8.1.014505 pmid:33585662
    CrossRefPubMed
  35. 35.↵
    1. Soltanpour M,
    2. Greiner R,
    3. Boulanger P, et al
    . Improvement of automatic ischemic stroke lesion segmentation in CT perfusion maps using a learned deep neural network. Comput Biol Med 2021;137:104849 doi:10.1016/j.compbiomed.2021.104849 pmid:34530336
    CrossRefPubMed
  36. 36.↵
    1. Werdiger F,
    2. Parsons MW,
    3. Visser M, et al
    . Machine learning segmentation of core and penumbra from acute stroke CT perfusion data. Front Neurol 2023;14:1098562 doi:10.3389/fneur.2023.1098562 pmid:36908587
    CrossRefPubMed
  37. 37.↵
    1. Shi T,
    2. Jiang H,
    3. Zheng B
    . C2MA-Net: cross-modal cross-attention network for acute ischemic stroke lesion segmentation based on CT perfusion scans. IEEE Trans Biomed Eng 2022;69:108–18 doi:10.1109/TBME.2021.3087612 pmid:34101581
    CrossRefPubMed
  • Received October 7, 2023.
  • Accepted after revision November 20, 2023.
  • © 2024 by American Journal of Neuroradiology
PreviousNext
Back to top

In this issue

American Journal of Neuroradiology: 45 (3)
American Journal of Neuroradiology
Vol. 45, Issue 3
1 Mar 2024
  • Table of Contents
  • Index by author
  • Complete Issue (PDF)
Advertisement
Print
Download PDF
Email Article

Thank you for your interest in spreading the word on American Journal of Neuroradiology.

NOTE: We only request your email address so that the person you are recommending the page to knows that you wanted them to see it, and that it is not junk mail. We do not capture any email address.

Enter multiple addresses on separate lines or separate them with commas.
Reducing False-Positives in CT Perfusion Infarct Core Segmentation Using Contralateral Local Normalization
(Your Name) has sent you a message from American Journal of Neuroradiology
(Your Name) thought you would like to see the American Journal of Neuroradiology web site.
CAPTCHA
This question is for testing whether or not you are a human visitor and to prevent automated spam submissions.
Cite this article
Alexander Rau, Marco Reisert, Christian A. Taschner, Theo Demerath, Samer Elsheikh, Benedikt Frank, Martin Köhrmann, Horst Urbach, Elias Kellner
Reducing False-Positives in CT Perfusion Infarct Core Segmentation Using Contralateral Local Normalization
American Journal of Neuroradiology Mar 2024, 45 (3) 277-283; DOI: 10.3174/ajnr.A8111

Citation Manager Formats

  • BibTeX
  • Bookends
  • EasyBib
  • EndNote (tagged)
  • EndNote 8 (xml)
  • Medlars
  • Mendeley
  • Papers
  • RefWorks Tagged
  • Ref Manager
  • RIS
  • Zotero
0 Responses
Respond to this article
Share
Bookmark this article
Reducing FP in CTP Infarct Core Segmentation
Alexander Rau, Marco Reisert, Christian A. Taschner, Theo Demerath, Samer Elsheikh, Benedikt Frank, Martin Köhrmann, Horst Urbach, Elias Kellner
American Journal of Neuroradiology Mar 2024, 45 (3) 277-283; DOI: 10.3174/ajnr.A8111
del.icio.us logo Twitter logo Facebook logo Mendeley logo
  • Tweet Widget
  • Facebook Like
  • Google Plus One
Purchase

Jump to section

  • Article
    • Abstract
    • ABBREVIATIONS:
    • MATERIALS AND METHODS
    • RESULTS
    • DISCUSSION
    • CONCLUSIONS
    • Footnotes
    • REFERENCES
  • Figures & Data
  • Supplemental
  • Info & Metrics
  • Responses
  • References
  • PDF

Related Articles

  • PubMed
  • Google Scholar

Cited By...

  • No citing articles found.
  • Crossref
  • Google Scholar

This article has not yet been cited by articles in journals that are participating in Crossref Cited-by Linking.

More in this TOC Section

  • Automated Detection of Vessel Occlusions
  • HIR in Unsuccessfully Reperfused AIS-LVO Patients
  • Outcomes After EV Treatment of Cerebral Vasospasm
Show more Neurovascular/Stroke Imaging

Similar Articles

Advertisement

Indexed Content

  • Current Issue
  • Accepted Manuscripts
  • Article Preview
  • Past Issues
  • Editorials
  • Editors Choice
  • Fellow Journal Club
  • Letters to the Editor

Cases

  • Case Collection
  • Archive - Case of the Week
  • Archive - Case of the Month
  • Archive - Classic Case

Special Collections

  • Special Collections

Resources

  • News and Updates
  • Turn around Times
  • Submit a Manuscript
  • Author Policies
  • Manuscript Submission Guidelines
  • Evidence-Based Medicine Level Guide
  • Publishing Checklists
  • Graphical Abstract Preparation
  • Imaging Protocol Submission
  • Submit a Case
  • Become a Reviewer/Academy of Reviewers
  • Get Peer Review Credit from Publons

Multimedia

  • AJNR Podcast
  • AJNR SCANtastic
  • Video Articles

About Us

  • About AJNR
  • Editorial Board
  • Not an AJNR Subscriber? Join Now
  • Alerts
  • Feedback
  • Advertise with us
  • Librarian Resources
  • Permissions
  • Terms and Conditions

American Society of Neuroradiology

  • Not an ASNR Member? Join Now

© 2025 by the American Society of Neuroradiology All rights, including for text and data mining, AI training, and similar technologies, are reserved.
Print ISSN: 0195-6108 Online ISSN: 1936-959X

Powered by HighWire