
Abstract
BACKGROUND AND PURPOSE: The habenula is a key node in the regulation of emotion-related behavior. Accurate visualization of the habenula and its reliable quantitative analysis is vital for the assessment of psychiatric disorders. To obtain high-contrast habenula images and allow them to be compatible with clinical applications, this preliminary study compared 3T MP2RAGE and quantitative susceptibility mapping with MPRAGE by evaluating the habenula segmentation performance.
MATERIALS AND METHODS: Ten healthy volunteers were scanned twice with 3T MPRAGE and MP2RAGE and once with quantitative susceptibility mapping. Image quality and visibility of habenula anatomic features were analyzed by 3 radiologists using a 5-point scale. Contrast assessments of the habenula and thalamus were also performed. The reproducibility of the habenula volume from MPRAGE and MP2RAGE was evaluated by manual segmentation and the Multiple Automatically Generated Template brain segmentation algorithm (MAGeTbrain). T1 values and susceptibility were measured in the whole habenula and habenula geometric subregion using MP2RAGE T1-mapping and quantitative susceptibility mapping.
RESULTS: The 3T MP2RAGE and quantitative susceptibility mapping demonstrated clear boundaries and anatomic features of the habenula compared with MPRAGE, with a higher SNR and contrast-to-noise ratio (all P < .05). Additionally, 3T MP2RAGE provided reliable habenula manual and MAGeTbrain segmentation volume estimates with greater reproducibility. T1-mapping derived from MP2RAGE was highly reliable, and susceptibility contrast was highly nonuniform within the habenula.
CONCLUSIONS: We identified an optimized sequence combination (3T MP2RAGE combined with quantitative susceptibility mapping) that may be useful for enhancing habenula visualization and yielding more reliable quantitative data.
ABBREVIATIONS:
- CNR
- contrast-to-noise ratio
- COV
- coefficient of variation
- FGATIR
- fast gray matter acquisition T1 inversion recovery
- GRE
- gradient recalled-echo
- Hb
- habenula
- ICC
- intraclass correlation coefficient
- MAGeTbrain
- Multiple Automatically Generated Template brain segmentation algorithm
- MDD
- major depressive disorder
- QSM
- quantitative susceptibility mapping
- UNI
- uniform T1-weighted image
The habenula (Hb) in the human brain is a small (5- to 9-mm diameter) strategic nucleus located at the posterior dorsal-medial end of the thalamus, in front of the pineal body. The Hb commissure connects the left and right Hbs of the 2 hemispheres and locally forms the Hb trigone in front of the posterior commissure. The Hb receives input mainly from the limbic forebrain and basal ganglia by the stria medullaris and output through the fasciculus retroflexus to the ventral tegmental area, substantia nigra, medial raphe, and raphe nucleus (Online Supplemental Data). It has been implicated in regulating behaviors such as anxiety, reward, depression, and circadian rhythm.1,2 Recent research indicates that the lateral Hb plays a major role in depression, and ketamine inhibits the N-methyl-D-aspartate receptor–dependent lateral Hb, leading to a quick relief of depressive symptoms.3 Moreover, the medial Hb is functionally important in regulating behavior and emotions.4
However, its accurate depiction and reliable quantitative analysis remain challenging with current clinical MR imaging sequences. Volume changes in the Hb have long been the focus of attention in neuropsychiatric diseases (Online Supplemental Data). Evaluation of Hb volume is widely used to investigate various disorders, including schizophrenia, bipolar disorder, and major depressive disorder (MDD).5⇓⇓⇓⇓⇓-11 A 3D T1-weighted high-resolution anatomic sequence is typically used to display and manually delineate the Hb. Among these techniques, MPRAGE imaging is a representative sequence that has been extensively used for manual Hb volume segmentation. Herein, on MPRAGE, the Hb manifests as slight hyperintensity with a surface landmark that extends medially from the thalamus. However, we found that the Hb on MPRAGE had poor contrast compared with the thalamus, with the lateral boundaries separating the Hb from the thalamus, which remains poorly marked, especially after being magnified many times, possibly causing differences in the volume of the Hb when manually delineated by physicians. Furthermore, MPRAGE is vulnerable to the inhomogeneity of both transmission (B1+) and reception (B1–) radiofrequency fields at both 3T and 7T, leading to a decrease in contrast between the gray and white matter.12 Meanwhile, the inhomogeneity and distortion of the main magnetic field (B0) may also influence image quality.13 Therefore, identifying a sequence that can improve the contrast of Hb compared with other structures is critical to enhance the performance of Hb segmentation and quantitative analysis.
In recent years, the emergence of MP2RAGE has resulted in higher contrast for gray/white matter, higher reproducibility of deep gray matter, and improved accuracy of the segmentation of brain structures.14⇓⇓-17 The MP2RAGE sequence is an extension of MPRAGE that requires a single echo and can significantly reduce image bias and prevent the effect of inhomogeneity. In MP2RAGE, 2 rapid gradient recalled-echo (GRE) images, INV1 (GRE TI1) and INV2 (GRE TI2), are acquired at different TIs and combined to produce a uniform T1-weighted image (UNI) that is free from B1 inhomogeneity.12,16 Quantitative T1-mapping is also obtained, allowing accurate measurement of tissue properties. Despite the availability of the 7T MP2RAGE sequence to manually segment Hb,8,18 an increase in field strength also induces nonuniformities in the transmission field (B1+), which can compromise image contrast nonuniformity.16 Furthermore, 7T MR imaging is not widely implemented in clinical practice.
Quantitative susceptibility mapping (QSM) is another promising technique for visualizing the Hb. QSM can quantify the magnetic susceptibility of tissue, which is highly nonuniform within the Hb because the susceptibility enhancement of the Hb is associated with paramagnetic sources such as iron.
Therefore, our preliminary study aimed to achieve the following: 1) better visualize the Hb anatomic features using 3T MP2RAGE and QSM, 2) compare the segmentation performance of MP2RAGE and MPRAGE, and 3) quantify Hb volume, T1 relaxation time, and susceptibility. The findings of this study may have important implications for improving the clinical assessment of Hb in neuropsychiatric disorders and, beyond, help guide future research in the development of normative data in this field.
MATERIALS AND METHODS
Participants
This prospective study was approved by the first hospital of Jilin University institutional review board (approval No. 22K027-001), and written informed consent was obtained from all participants. The study included 10 healthy volunteers (25–40 years of age; mean age, 31.5 [SD, 4.4] years; 5 men and 5 women) with no history of severe head trauma, tumor or neuropsychiatric disorders, large-vessel disease, and/or diseases with white matter lesions.
Imaging Acquisition
All participants were examined using a 3T MR imaging scanner (Magnetom Vida; Siemens) with a 20-channel head-and-neck coil. The scans were obtained on the sagittal plane parallel to the median sagittal position line. Earplugs and foam cushions were provided to ensure the participants’ comfort and reduced motion artifacts. The MPRAGE, MP2RAGE, and QSM acquisition parameters are listed in the Online Supplemental Data. MPRAGE and MP2RAGE were acquired twice for each participant, with a 1-week interval between scans. In contrast, QSM was performed after the second MP2RAGE and MPRAGE scans.
Image Analysis
MP2RAGE raw data were obtained using a Syngo Via-software MR imaging workstation (Siemens) to calculate UNI and T1 mapping (Fig 1). Manual segmentation of bilateral Hbs on MP2RAGE, MPRAGE, and QSM was performed in ITK-SNAP (www.itksnap.org). According to previous studies, the Hb boundaries were traced in the region of the triangular depression of the third ventricle, starting with the section above the posterior commissure and moving in the superior direction. The Hb was delineated as long as it protruded into the third ventricle or showed a visible contrast difference from the surrounding thalamus.

Representative MPRAGE, MP2RAGE-UNI, and T1-mapping images of the Hb from a healthy man 30 years of age (black arrow). Visual contrast between the Hb and the thalamus in UNI is better than that in MPRAGE.
Subjective Visual Score
The qualitative scores of the Hb in MPRAGE and MP2RAGE-UNI of the first scan, as well as QSM, were assessed by 3 radiologists (B.B., Z.L., and Z.H.M. with 8, 15, and 25 years of experience, respectively) blinded to participant information. To standardize the subjective assessment, 3 radiologists were directed to reach a consensus on the image series. In case of disagreement in the image analysis, a consensus was reached among the 3 observers. The radiologists reported their impressions of the overall image quality on a scale of 1 (unusable) to 5 (excellent). The scores were defined as the following: 1)The Hb was not visible; 2) the Hb was poorly visible with fuzzy borders; 3) the Hb was clearly differentiable from the third ventricle but not from the thalamus; 4) the Hb was better visible with clear borders; and 5) the Hb was well-defined and clearly differentiable.
Image Quality Analysis
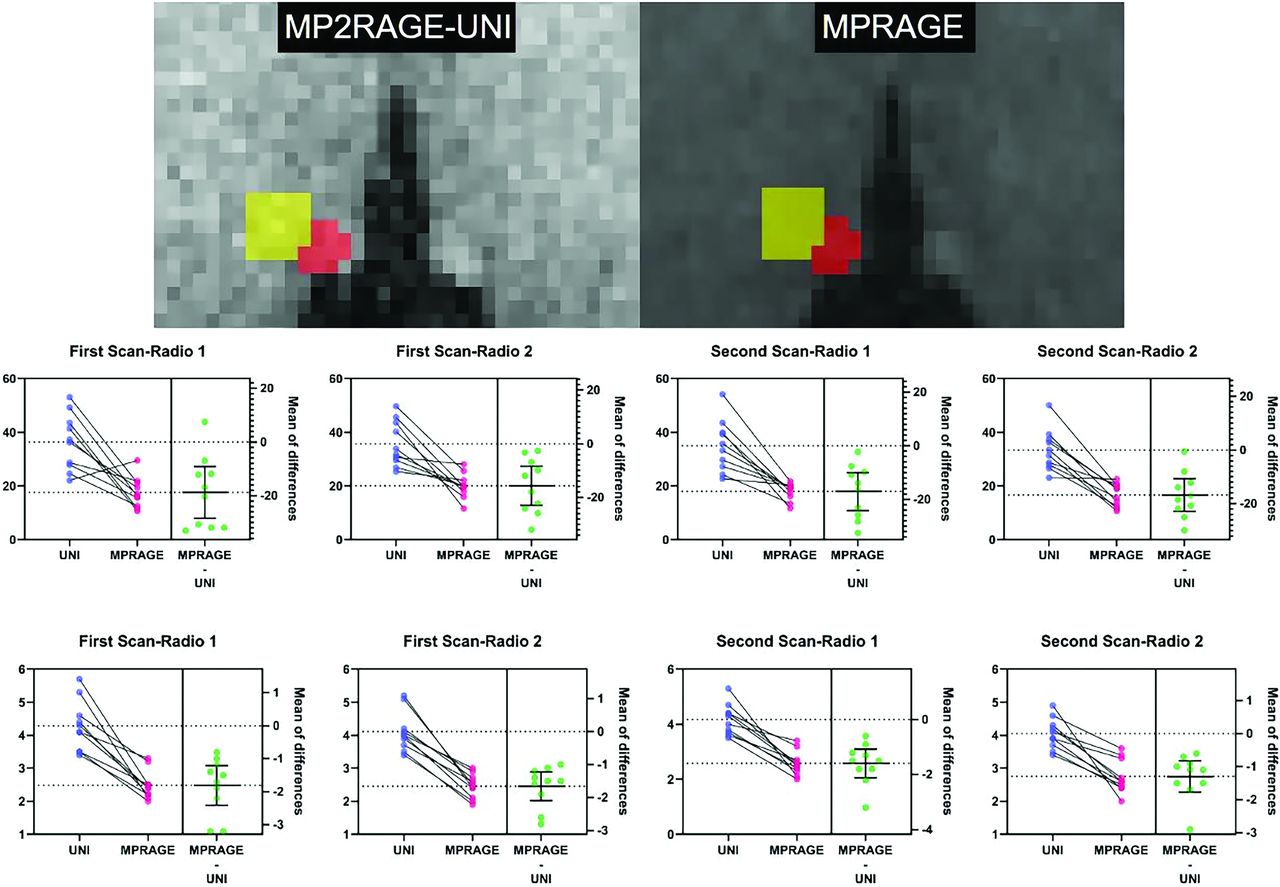
The section in which the Hb showed the largest axial image on MP2RAGE-UNI and MPRAGE was chosen for quantitative analysis. The Hb ROI as defined as the intersection of the manual segmentation results of 2 radiologists. The thalamic ROI was defined as twice the size of the Hb ROI and was in the anterolateral region of the Hb ROI (Fig 2). The SNR of the Hb and the contrast-to-noise ratio (CNR) of the Hb and the thalamus were calculated on the basis of MP2RAGE-UNI and MPRAGE, using the following equations:


The Hb ROI was chosen on the basis of the largest axial image on MP2RAGE-UNI and MPRAGE, and the thalamus ROI was defined as twice the size of the Hb ROI, which is located on the anterolateral side of the Hb ROI (first row). The CNR (middle row) and SNR (third row) of UNI is statistically higher than those of MPRAGE (paired samples t test). Radio indicates radiologist.
where SI is the signal intensity and noise is the SD. The mean values of the bilateral Hb and thalamus were calculated by 2 radiologists, with 8 and 25 years of experience in using ITK-SNAP.
Segmentation and Validation Evaluation
Manual segmentation of the Hb was performed on MP2RAGE-UNI and MPRAGE zoomed by a factor of 8 using ITK-SNAP software by 2 independent radiologists (B.B. and Z.L.) to obtain an ROI. A consensus segmentation was reached by the radiologists to offer the best delineation. The left and right Hbs were manually labeled using ITK-SNAP on all MPRAGE and UNI images, and volume estimations were calculated from manual labels by calculating the number of labeled voxels for each healthy subject. The segmentation was repeated twice with a 7-day interval for MP2RAGE-UNI and MPRAGE, respectively, and the changes in the number of labeled voxels and absolute volume were recorded each time (Online Supplemental Data). Manual segmentation of the Hbs in these participants was then repeated twice (the interval between the 2 times was 7 days) using UNI and MPRAGE, and changes in the number of labeled voxels and absolute volume were recorded each time.
A fully automated Hb atlas segmentation based on the Multiple Automatically Generated Template brain segmentation algorithm (MAGeTbrain) (http://cobralab.ca/software/MAGeTbrain/) was also applied. Full Hb atlases (https://github.com/CobraLab/atlases) provide a well-established method for Hb segmentation (Fig 3). The MP2RAGE-UNI and MPRAGE images were automatically segmented using the MAGeTbrain. Subsequently, interrater reliability was assessed manually by radiologist 1 (B.B.) versus MAGeTbrain and radiologist 2 (L.Z.) versus MAGeTbrain.19

Segmentations from 5 atlases are propagated via image registration to 21 selected template images before being propagated using image registration to each UNI and MPRAGE. This feature creates a large number (5 atlases × 21 templates = 105) of candidate segmentations that are fused using majority vote. This has 2 advantages: reducing atlas bias and averaging registration errors. Also, because the procedure is based on image registration rather than on contrast-based segmentation, it allows the neuroanatomic variability of the subjects to refine each individual subject’s final segmentation. Reg_result indicates registration result.
Quantitative Analysis
For quantitative analysis, the section in which the Hb showed the largest axial image of T1-mapping and QSM was selected. Two methods were used for analysis: The whole Hb was used to measure T1 values and susceptibility, and the Hb was geometrically divided into halves (the anterior-posterior and medial/lateral subregions) (Fig 4A, -B and Online Supplemental Data), to measure the T1 values and the susceptibility of each subregion. The QSM image reconstruction process is illustrated in the Online Supplemental Data.

ROI on the T1 mapping from the left-to-right Hb of a representative participant. A, Anterior (red) and posterior (green) subregions within the habenula. B, Medial (pink) and lateral (yellow) subregions within the Hb. C and D, The T1 values of the posterior halves of the Hb are higher than those in the anterior halves, and the medial halves are higher than those in the lateral halves.
Statistical Analysis
All statistical analyses were performed using SPSS software (Version 21.0; IBM). To evaluate the confidence of the Hb ROI, we conducted intraclass correlation coefficient (ICC) analysis for the subjective visual score, SNR, CNR, T1 values, and susceptibility in the 3 sequences. The SNR and CNR of the Hb were compared between the MPRAGE and MP2RAGE-UNI groups using paired t tests. The agreement between the MP2RAGE-UNI and MPRAGE Hb volume estimates from the manual segmentation and MAGeTbrain was assessed using Bland-Altman plots. To assess the reproducibility of the T1 values from MP2RAGE, we calculated the coefficient of variation (COV) of the T1 value of Hb by dividing the SD of each Hb level of the T1 value by the mean (expressed as a percentage). T1 values and the susceptibility of Hb geometric subregions were compared using a paired t test. A P value < .05 was considered statistically significant.
RESULTS
Subjective Visual Assessment
The ICCs of the qualitative scores among the 3 radiologists were 0.870, 0.602, and 0.859 for MP2RAGE-UNI, MPRAGE, and QSM, respectively. The Hb appeared slightly hyperintense on MPRAGE, as well as hyperintense on MP2RAGE and QSM. In MP2RAGE, stria medullaris and fasciculus retroflexus can be readily distinguished, compared with MPRAGE (Online Supplemental Data). The average subjective visual scores for the Hb by the 3 radiologists for the MP2RAGE-UNI, MPRAGE, and QSM images were 4.83, 4.20, and 4.63, respectively. Higher image contrast and optimal geometry were obtained from MP2RAGE-UNI images than from MPRAGE and QSM images (Online Supplemental Data), which was unanimously recognized. Furthermore, both MP2RAGE-UNI and QSM contrast images could be easily used to delineate the well-defined boundaries between the Hb and thalamus.
Difference in SNR and CNR of Hb
The ICCs of the SNR and CNR of the Hb for the first and second scans are presented in the Online Supplemental Data. The mean SNR of the Hb was 36.39 (SD, 10.01) and 17.55 (SD, 5.40) on the MP2RAGE-UNI and the MPRAGE images, respectively. In addition, the CNRs between the Hb and thalamus were 4.29 (SD, 0.72) and 2.48 (SD, 0.42) on the MP2RAGE-UNI and the MPRAGE images, respectively. Compared with MPRAGE, significantly higher SNRHb and CNRHb-thalamus were detected in MP2RAGE-UNI (all P < .05), as shown in Fig 2.
Difference in Hb Volume
The mean volumes of the right and left Hbs from the 10 volunteers after manual segmentation using the ITK-SNAP software are presented in the Online Supplemental Data. The UNI-based manual volume estimates were highly correlated with MPRAGE for both the left and right Hbs in the first and second scans (P < .001 for all simple linear regression models). The COVs in the right and left Hb volumes of the MAGeTbrain obtained from the UNI and MPRAGE images were low at 5.4%, 6.3%, 9.7%, and 8.6%, respectively. Figure 5 depicts a greater similarity in Hb volume measurements, including manual and MAGeTbrain segmentation, between the UNI and MPRAGE images.

Bland-Altman plot showing the volume differences of the right Hb (green dots) and left Hb (red dots) between the MAGeTbrain and manual segmentations in the first scan for MPR2RAGE-UNI and MPRAGE. Radio indicates radiologist.
T1 Values Measured by MP2RAGE T1-Mapping and Their COVs
The ICC of the T1 values of the Hb ranged from 0.884 (right Hb on the first scan) to 0.991 (right Hb on the second scan) (Online Supplemental Data). The measured T1 values of the 10 healthy volunteers are summarized in the Online Supplemental Data. The COVs of the T1 values ranged from 3.4% to 5.8% in the first and second MP2RAGE scans. The T1 values were not significantly different between the left and right Hbs (all P > .05; Online Supplemental Data). However, the bilaterally averaged T1 values obtained from the Hb subregion for the 10 participants varied from 835 to 1044 ms. The difference between the anterior and posterior halves, as well as the lateral and medial halves, was statistically significant (P = .002 and <.001, paired t test) (Fig 4).
Susceptibility Measured by QSM
The ICC for susceptibility to the Hb was 0.989 for the right side and 0.998 for the left side and was not significantly different between the left and right Hbs (P = .67). The mean susceptibility for the right and left Hbs was 15.74 (SD, 1.88) ppb and 15.83 (SD, 1.83) ppb, respectively. However, the posterior halves of the Hb were significantly higher than the anterior halves (P < .001, paired t test). The difference between the medial and lateral halves was not significant (paired t test, P = .467) (Online Supplemental Data).
DISCUSSION
The preliminary results indicate that MP2RAGE-UNI yielded superior visual scores, SNR, CNR, and reliability of Hb volume segmentation when directly compared with MPRAGE. MP2RAGE T1-mapping and QSM have the potential to notably advance quantitative analysis aimed at reflecting changes in the Hb composition. For Hb MR imaging, a homogeneous data set is required. Thus, we used a narrow age range for recruiting the healthy volunteers because it is well-documented that with aging, many structures in the brain accumulate iron and undergo atrophy.20 Future work should aim to collect needed data for different age groups, categorized by decade. This information would be beneficial for current age groups in terms of future references and comparisons with disease processes.
For patients with posttraumatic stress disorder, MDD, schizophrenia, and bipolar disorder, the volume of the Hb is the first concern (Online Supplemental Data). Savitz et al5 demonstrated that Hb volume increases in patients with MDD relative to controls by a 3T MPRAGE sequence. Schmidt et al6 reported no significant difference in the volume of Hb between unmedicated and medicated patients with MDD by a 7T MPRAGE sequence. In our study, we used bias-corrected T1-weighted images (MP2RAGE-UNI) and QSM to visualize the Hb of healthy volunteers. The preliminary results demonstrated that the MP2RAGE-UNI sequence provides superior tissue contrast between the thalamus and the Hb compared with MPRAGE, allowing improved subjective and objective assessment. Additionally, both manual and automatic segmentation methods yielded highly reliable results for Hb volume estimation. With excellent tissue contrast, the Bland-Altman plot shows good consistency between MAGeTbrain and manual segmentations. Additionally, COV in the right and left Hb volumes of MAGeTbrain obtained from the UNI were low (COV: 5.4% and 6.3%, respectively). Our COV results are better than those of previous semi-/fully automatic segmentations based on the myelin content in T1-weighted and T2-weighted images.21 Automated segmentation-based AI is accurate enough for use compared with manual segmentation. Future AI applications are expected to support and facilitate the establishment of an accurate Hb automated segmentation model, reducing the time spent by radiologists to manually sketch the Hb and avoiding errors caused by subjectivity.
Our study also found no significant differences in T1 values between the left and right Hb, which was inconsistent with the findings of Cho et al.22 Significant differences were observed between the anterior and posterior halves as well as the medial and lateral halves. The T1-relaxation time is a measure of how quickly the longitudinal magnetization recovers to its ground state. An increase in the volume fraction of myelin reduces the average T1 of white matter. Quantitative analyses of T1 values in the subregions of the human Hb are limited, and the interpretation of this imbalance remains unclear. The MP2RAGE sequence, which provides purely T1-weighted images, offers a promising foundation for subcortical nucleus segmentation. Our results provide further evidence supporting the use of MP2RAGE for accurate segmentation of Hb and exploring T1 value differences within the Hb and its subregions between healthy subjects and those with neuropsychiatric disorders.
Sands et al23 found that iron increased in the medial Hbs of cerebral mouse models of MS. However, our study found that susceptibility differences also existed in different subregions of the human Hb, with the posterior subregion showing increased susceptibility. Yoo et al24 previously reported that an increase in susceptibility is associated with iron deposition rather than a decrease in myelin and that the posterior region tends rewards increased susceptibility, a finding consistent with our results. Wang et al25 observed that late-life depression progression is associated with increased iron deposition in the whole Hb, but not the lateral Hb. Our results contribute to further studies investigating whether depression progression is associated with iron deposition in the Hb, particularly in the posterior subregion.
Although our results are not completely in accordance with those of previous studies, our ICC was generally higher than 0.8, indicating excellent reliability. This can be because MP2RAGE provides ideal tissue contrast and clear boundaries. Previous ex vivo imaging of the Hb using MP2RAGE at 7T proved the heterogeneity of the lateral Hb.26
Limitations
This study had some limitations: first, the small sample size, with only 10 cases in the 25- to 40-year age range. Furthermore, a multicenter study would have enhanced statistical representativeness. For our future research, we scanned volunteers of different age groups and sexes to obtain a range of Hb values, which will serve as the basis for normative data in a healthy-aging population. Second, MP2RAGE and QSM, respectively, are definitely more than twice and triple the duration to obtain MPRAGE, possibly limiting its widespread application in psychiatric patients. We are actively applying artificial intelligence to improve the acquired speed of MP2RAGE, QSM, and denoising. Third, the resolution of QSM appears challenging for achieving accurate quantitative evaluation due to Hb being an extremely small brain structure. In addition, veins in and around the Hb interfered with magnetic susceptibility characterization. Fourth, the fast gray matter acquisition T1 inversion recovery (FGATIR) sequence more clearly illustrates boundaries between the subcortical nuclei and is frequently used for electrode placement.27 We hope to use FGATIR and MP2RAGE to determine the visualization of the optimal sequence of the Hb. Fifth, other structures in the Hb pathway, such as the interpeduncular nucleus, ventral tegmental area of the midbrain, and raphe nuclei, were not visualized. A multiparametric MR imaging protocol to visualize multiple reward-pathway structures may be valuable for functional neurosurgery procedures in the future.
CONCLUSIONS
Our study demonstrates the utility of MP2RAGE-UNI and QSM sequences for the visualization and quantitative analysis of the Hb in healthy subjects. The high tissue contrast provided by the MP2RAGE-UNI sequence enables reliable and reproducible Hb segmentation. Thus, MP2RAGE and QSM sequences have the potential for clinical applications in the study of psychiatric disorders.
Footnotes
This study received funding from the National Natural Science Foundation of China (grant No. 82102143); Natural Science Foundation of Jilin Province (grant No. YDZJ202101ZYTS019); Jilin Province Science and Technology Department (grant No. YDZJ202201ZYTS679); National Natural Science Foundation of China (grant No. 32171145); Jilin Provincial Key Laboratory of Medical Imaging & Big Data (grant No. 20200601003JC); and Radiology and Technology Innovation Center of Jilin Province (grant No. 20190902016TC).
Disclosure forms provided by the authors are available with the full text and PDF of this article at www.ajnr.org.
References
- Received July 15, 2023.
- Accepted after revision December 18, 2023.
- © 2024 by American Journal of Neuroradiology


Jump to section
Related Articles
Cited By...
- No citing articles found.