
Abstract
BACKGROUND AND PURPOSE: GM pathology plays an essential role in MS disability progression, emphasizing the importance of neuroradiologic biomarkers to capture the heterogeneity of cortical disease burden. This study aimed to assess the validity of a patch-wise, individual interpretation of cortical thickness data to identify GM pathology, the “mosaic approach,” which was previously suggested as a biomarker for assessing and localizing atrophy.
MATERIALS AND METHODS: We investigated the mosaic approach in a cohort of 501 patients with MS with respect to 89 internal and 651 external controls. The resulting metric of the mosaic approach is the so-called thin patch fraction, which is an estimate of overall cortical disease burden per patient. We evaluated the mosaic approach with respect to the following: 1) discrimination between patients with MS and controls, 2) classification between different MS phenotypes, and 3) association with established biomarkers reflecting MS disease burden, using general linear modeling.
RESULTS: The thin patch fraction varied significantly between patients with MS and healthy controls and discriminated among MS phenotypes. Furthermore, the thin patch fraction was associated with disease burden, including the Expanded Disability Status Scale, cognitive and fatigue scores, and lesion volume.
CONCLUSIONS: This study demonstrates the validity of the mosaic approach as a neuroradiologic biomarker in MS. The output of the mosaic approach, namely the thin patch fraction, is a candidate biomarker for assessing and localizing cortical GM pathology. The mosaic approach can furthermore enhance the development of a personalized cortical MS biomarker, given that the thin patch fraction provides a feature on which artificial intelligence methods can be trained. Most important, we showed the validity of the mosaic approach when referencing data with respect to external control MR imaging repositories.
ABBREVIATIONS:
- AI
- artificial intelligence
- CamCAN
- Cambridge Center for Ageing and Neuroscience
- CIS
- clinically isolated syndrome
- CTh
- cortical thickness
- EDSS
- Expanded Disability Status Scale
- HC
- healthy controls
- IQR
- interquartile range
- MAP
- mosaic approach
- MuSIC
- Multiple Sclerosis Inventory of Cognition
- PMS
- progressive MS
- RRMS
- relapsing-remitting MS
- TPF
- thin patch fraction
- TUM
- Technical University of Munich
MS is a chronic disease of the CNS, which is characterized by a complex interplay of inflammatory and neurodegenerative processes.1,2 The significance of MR imaging for MS diagnosis and disease monitoring has increased during the past decades and has ultimately allowed the diagnosis of MS based on a single MR imaging assessment along a clinical symptoms.3
One problem in early and accurate patient management is the vast heterogeneity of the disease and the severity, which cannot be predicted at onset; moreover, highly individualized neuroradiologic and clinical patterns are observed.4,5 As a consequence of this diversity, the quest for a personalized approach to MS therapy has evolved, which requires biomarkers that can be assessed on a single-patient basis.6
Existing MR imaging biomarkers traditionally focus on the quantification of WM lesions, given their well-established association with disease burden.7⇓-9 However, the role of progressive GM pathology for the clinical course is increasingly recognized.10⇓⇓-13 Thus, the acquisition of 3D T1WI gradient recalled-echo sequences (inversion recovery or MPRAGE) has been optionally recommended for monitoring GM pathology in the latest consensus guidelines by the Consortium for Magnetic Resonance Imaging in MS (MAGNIMS).14
However, individualized assessment of subcortical and cortical GM atrophy is an ongoing-but-urgent challenge.15 One problem is the lack of a common standard on which GM can be rated. During the past years, increasingly large-scale MR imaging databases have been more freely available to the community,16,17 some of which are population-representative such as the UK Biobank.18 Such resources provide the exciting opportunity to define population-based reference standards on which an individual patient's GM can be assessed for signs of atrophy or even hypertrophy.19
Following this strategy, using external big data resources has been suggested to define age- and sex-matched reference standards for the assessment of cortical thickness (CTh) suggestive of atrophy.20 This strategy included a high-resolution parcellation of the cortex into roughly equal-sized “patches” or “mosaics”—hence referred to as the “mosaic-approach” (MAP)—and performing nonparametric statistical significance testing for CTh normality at each patch. This strategy allows precise anatomic allocation of individual cortical disease burden and has been shown to be clinically relevant in primary neurodegenerative disorders, including amyotrophic lateral sclerosis,20 progressive lateral sclerosis,21 and frontotemporal dementia.22
In this investigation, we examined the validity of MAP as a cortical biomarker for MS. Specifically, we tested the 3 following applications of MAP in MS: 1) discrimination between patients with MS and controls, 2) classification among different MS clinical phenotypes, and 3) association with established biomarkers and disease burden in MS, including the Expanded Disability Status Scale (EDSS), cognitive and fatigue scores, as well as WM lesion volume. If the MAP can be validated for these applications, it might be a useful method for monitoring GM cortical burden in MS clinical practice. Furthermore, the MAP could serve as a feature for artificial intelligence (AI) applications, allowing personalized interpretation of single-subject GM pathology.
MATERIALS AND METHODS
Study Cohort and Data Acquisition
We included cross-sectional data from 501 patients with MS (328 women) and 89 healthy controls (HC, 59 women) from a prospective, monocentric observational cohort for this study, acquired at the Technical University of Munich (TUM, Table). We focused our analysis on patients with relapsing-remitting MS (RRMS) (n = 465) and additionally included smaller patient subgroups, namely clinically isolated syndrome (CIS) (n = 19) and progressive MS (PMS) (n = 17, both primary and secondary PMS) to probe the MAP differences among phenotypes. Patients were diagnosed by a certified neurologist in accordance with the 2017 revisions of the McDonald cirteria.3 Structural T1WI MPRAGE data were acquired at the Klinikum Rechts der Isar of the TUM on 1 of two 3T Philips Healthcare MR imaging systems: Achieva dStream and Ingenia with identical scanning parameters: 267 sagittal slices, FOV = 240 × 252 mm, spatial resolution = 1.00 mm isotropic, TR = 9 ms, TE = 4 ms, flip angle = 8°, no parallel imaging. Additionally, a 3D FLAIR sequence was acquired, which we used to calculate WM lesion volume using the LST toolbox (https://www.appliedstatistics.de/lst.html).23 Demographic and clinical details, including age, sex, EDSS, and dominant hand (for patients) were obtained from our hospital's Neurology Department. Additionally, the Multiple Sclerosis Inventory of Cognition (MuSIC) was available for patients, evaluating neuropsychological function specifically in MS.24,25 For the present study, we used the MuSIC to quantify cognition (with a score ranging from 0 to 30) and fatigue (ranging from 3 to 21). We tested differences in mean age between all patients with MS and HC using Welch 2-sample tests and sex distributions using a χ2 test with a Yates continuity correction, correcting for age and sex.
Demographic details of the study population
The study was approved by the local ethics committee of the TUM and was in accord with the Declaration of Helsinki, and informed consent was collected from all subjects.
In addition, we considered external reference T1WI data from an open-source repository by the Cambridge Center for Ageing and Neuroscience (CamCAN).16 We refer to this external HC group as “CamCAN-HC” as opposed to the internally acquired “TUM-HC.” The CamCAN-HC repository shares 651 MPRAGE images (330 women) collected from a 3T Magnetom TrioTrim (Siemens) system at the University of Cambridge with the following sequence parameters: 256 sagittal slices, FOV = 240 × 192 mm, spatial resolution = 1 mm isotropic, TR = 2250 ms, TE = 2.99 ms, flip angle = 9°, and generalized autocalibrating partially parallel acquisition (GRAPPA) factor = 2. We tested differences in mean age between CamCAN-HC and TUM-HC using the Welch 2-sample t test and sex distributions using a χ2 test with a Yates continuity correction, correcting for age and sex.
Neuroimaging Data Analysis
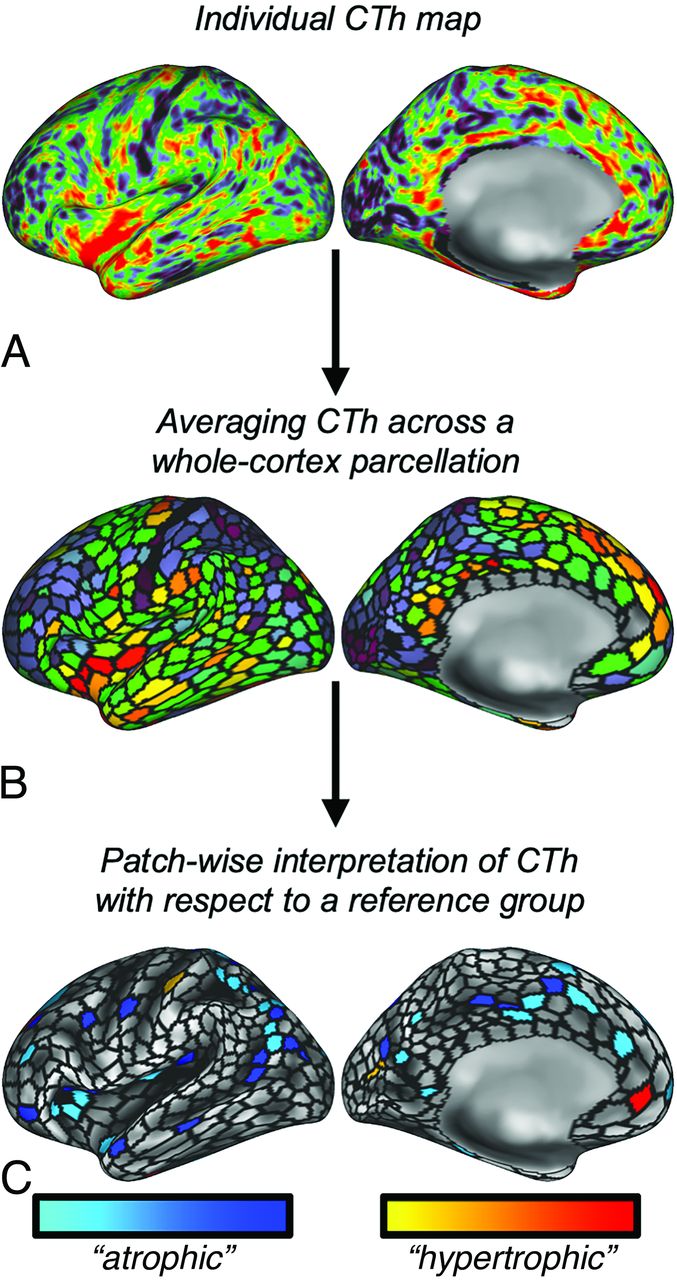
T1-weighted data were preprocessed using the fully-automated recon-all pipeline from the software FreeSurfer26⇓-28 (https://surfer.nmr.mgh.harvard.edu/fswiki/recon-all) and the Ciftify package (https://github.com/edickie/ciftify),29 which outputs surface-based CTh maps (“standard” CTh maps). Before FreeSurfer preprocessing, lesion filling was performed on the basis of T1WI and FLAIR data using the LST toolbox.23 The MAP approach evaluates regional CTh by a z score-based approach (Fig 1): Standard CTh maps19⇓⇓-22 of individual patients are subdivided into 1000 equal-sized mosaics30 and rated as significantly “thin” or “thick” with respect to a demographically matched HC group using nonparametric permutation testing.31 To account for the physiologic effects of sex and aging, subject-specific reference groups for each patient were generated (same sex, ± 2 years)20 from the collapsed TUM-/CamCAN-HC groups. The thin patch fraction (TPF) is calculated as the fraction of all significantly thin patches of a single subject from the total of 1000 patches (“whole-brain TPF”). Thick patch fractions were calculated analogously. In addition to whole-brain TPF, the TPF was also calculated for distinct brain lobes, including the frontal, parietal, insular, temporal, and visual cortices, as well as the motor cortex, which we refer to as super-ROIs. Further details on the parcellation-based estimation of individual atrophy, definition of reference groups, and definition of super-ROIs are provided in the Online Supplemental Data.

In the proposed MAP, atrophy (hypertrophy) was estimated on the basis of CTh maps (A). The cortical surface was subparcelled into 1000 “patches” (black lines in B), and the average CTh for each parcel was calculated (B). By referencing the value of each parcel to an age-/sex-matched control group, P maps can be calculated (C) so that the lower end of the spectrum is suggestive of “atrophy” (cool colors) and the higher end of “hypertrophy” (hot colors). MAP uses the fraction of any “atrophic” patches, ie, the TPF, as a metric to estimate cortical disease burden.
Statistics
The goal of this study was to validate MAP as a biomarker of several applications in MS using externally acquired MR imaging data. We followed a 3-fold strategy for this validation process:
First, we wanted to know whether MAP differentiates between patients with MS and HC. Therefore, we calculated the thin (thick) patch fraction for each patient with MS and HC and used a 1-way ANOVA to test for the main effect of the binary variable “MS diagnosis: yes/no” (notice that we did not differentiate among MS clinical phenotypes in this analysis). We included age, sex, and lesion volume as variables-of-no-interest into our model, and the α-level was set to P ≤ .05.
Second, we evaluated whether MAP discriminates among MS clinical phenotypes. We used 1-way ANOVA to compare differences of thin/thick patch fractions among 3 phenotypes (CIS, RRMS, PMS) and HC, testing for the main effect of phenotype. Age, sex, and lesion volume were modeled as variables-of-no-interest. When the ANOVA reached significance at P ≤ .05, we conducted post hoc pair-wise comparisons using Tukey Honestly Significant Difference testing, which outputs P values adjusted for multiple comparisons (Padj).
Third, we investigated whether MAP is associated with established measures reflecting disease burden in MS, including EDSS, cognition and fatigues scores (both from the MuSIC inventory), and lesion volume. Associations were tested using general linear modeling, in which the thin (thick) patch fractions across all patients were modeled as the dependent and the respective clinical measures as the independent variable. We tested for the main effect of the independent variable, setting the α level to P ≤ .05. Age, sex, and lesion volumes (except for the testing for the main effect, lesion volume) were included as variables-of-no-interest in the model.
Control Analysis: Standard Approach and Comparison with MAP
Given that we probed a novel biomarker in this study to quantify MS cortical disease burden on the basis of parcelled CTh, we also included a control analysis in which we considered unparcelled CTh data. We refer to this approach as a “standard approach.” We repeated all statistical comparisons for unparcelled CTh data, ie, using raw CTh values in millimeters, averaged across the cortex.
Given that we found a significant correlation between EDSS scores and MAP—but not the standard approach—we probed this difference formally in a post hoc analysis. We probed using bootstrapping, in which we first resampled the observed correlations for each method (with replacement, 999 replicates) and then calculated the respective bootstrapped correlation coefficients (r*Standard/r*Mosaic) and assessed their difference (Δr*). Notice that we flipped the sign of the standard approach to achieve comparability (given that atrophy corresponds to less but CTh to more thin patches). We calculated the 95% CI for Δr* and rejected the null hypothesis of no difference in correlations if Δr* = 0.00 was not included in the CI. Additionally, we ran another formal test comparing the correlation coefficients by using the cocor package in R (https://cran.r-project.org/web/packages/cocor/index.html),32 which offers various methods for comparing correlation differences. We chose a Monte Carlo testing scheme developed for comparing dependent correlations.33
Quantile Comparisons
In this study, we calculated TPFs using a mixed HC control data set, consisting of a smaller subset that was acquired at the same center as the MS patient cohort (TUM-HC) and a larger subset from an external center (CamCAN-HC). To estimate the effects of the different origins of the 2 HC data sets, we ran quantile (Q) analyses comparing the whole-brain TPF between TUM-HC and TUM-MS. We inspected QQ-plots between the 2 data sets and compared quantile ranks between the 2 groups for some exemplary quantile scores (corresponding to the 50%, 80%, and 95% quantile ranks in the TUM-HC group).
RESULTS
Demographics
The demographic profiles of the study populations are summarized in the Table. Adequate age-matching between all patients with MS (mean, 40.56 [SD, 10.22] years) and TUM-HC (mean, 37.36 [SD, 15.06] years) was suggested by a nonsignificant t test (t = −1.92, P = .056). Furthermore, χ2 testing confirmed comparable sex distributions between the study groups (χ2 < 0.001, P = .976). The clinical scores suggested relatively mild disease burden of the MS study group, as evidenced by a median EDSS score of 1.5 (interquartile range [IQR] = 2.0), a mean cognitive MuSIC score of 27.09 (SD, 3.66), a mean MuSIC fatigue score of 7.67 (SD, 4.56), and mean lesion volume of 5.45 (SD, 8.40) mL. TUM-HC differed from CamCAN-HC, both in terms of age (t = 9.78, P < .001) and sex distributions (χ2 = 7.03, P = .008). The control group sizes for each individual were roughly equal, with a median of n = 30.0 (IQR = 6.0).
MAP Differentiates Patients with MS from HC
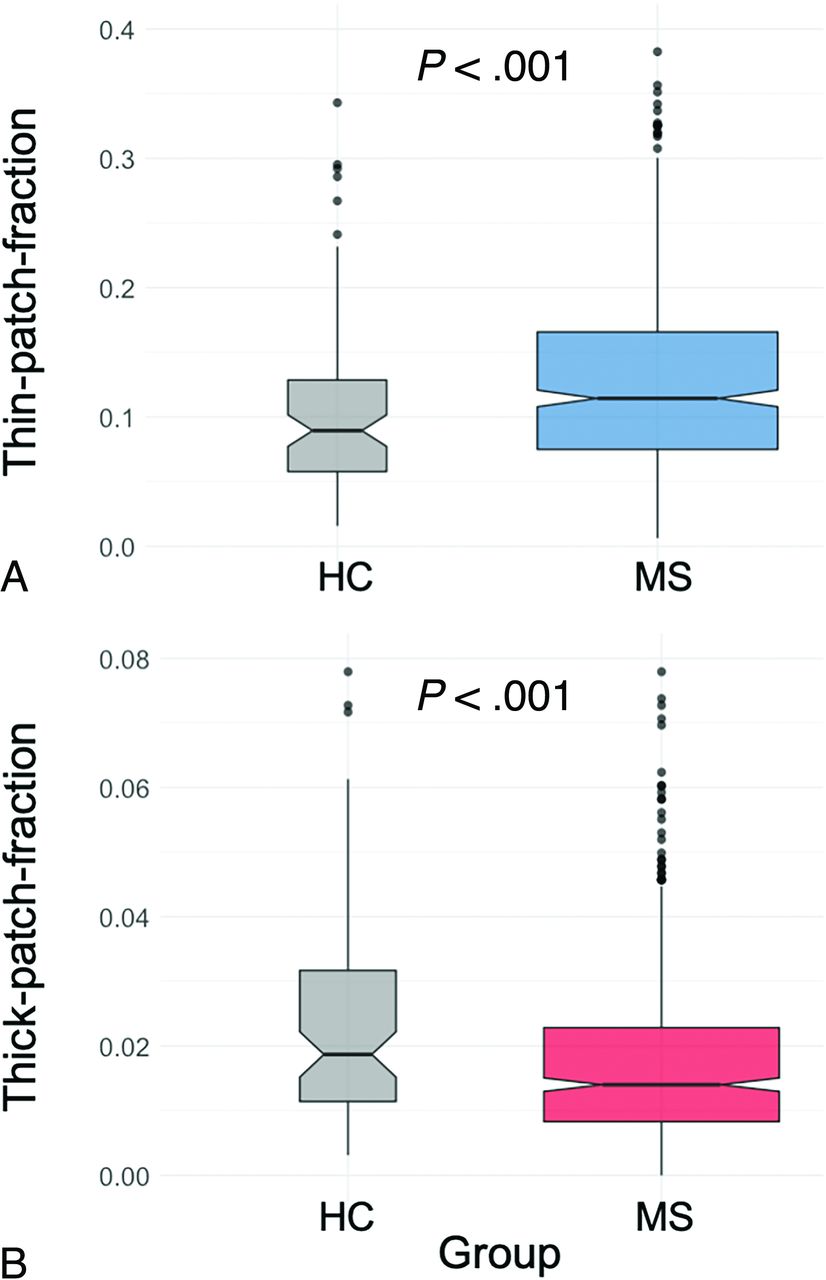
First, we tested whether MAP differentiates patients with MS from HC (Fig 2, note that thin and thick patches were found for MS as well as HC). T tests revealed that both thin (Fig 2A) as well as thick patch counts (Fig 2B) were significantly different between the study groups. Note that patients with MS had more thin patches (P < .001) but fewer thick patches (P = .002) than HC. Also, the standard approach showed thinner mean CTh in patients with MS versus HC (P < .001). See the Online Supplemental Data for further statistical details.

We investigated whether MAP differentiates patients with MS from HC. We found that both the primary outcome of MAP, ie, the TPF (A), as well as its opposite, the thick patch fraction (B), significantly discriminate MS from HC. Notice the opposed directionality: MS yields more thin but fewer thick patches. Boxplots show median (notched), IQRs, and outliers (dots); boxplot width reflects square root of sample sizes.
MAP Discriminates between MS Phenotypes
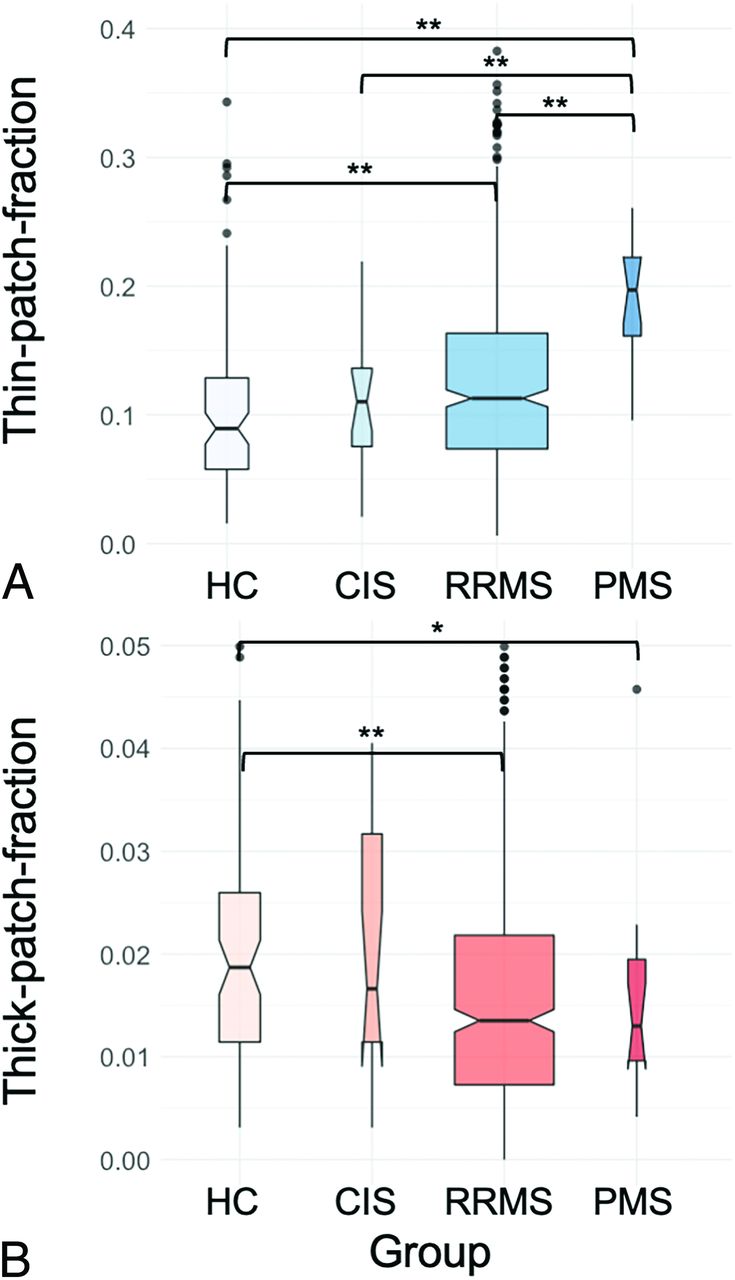
Second, we tested whether MAP discriminates among MS phenotypes (Fig 3): One-way ANOVAs suggested significantly different thin (F [4558] = 13.84, P < .001, Fig 3A) as well as thick (F [4558] = 7.663, P < .001, Fig 3B) patch fractions among the MS clinical phenotypes. Post hoc Tukey Honestly Significant Difference testing suggested that the TPFs yielded higher differential power compared with the thick patch fraction, given that more MS clinical phenotypes could be pair-wise differentiated (PMS had more thin patches versus HC (Padj <.001), CIS (Padj <.001), and RRMS (Padj <.001) and also demonstrated more thin patches in RRMS versus HC (Padj <.001). In terms of thick patches, only the pair-wise comparisons between RRMS versus HC (Padj <.001) and PMS versus HC (Padj = .009) were significant, suggesting fewer thick patches in the respective patient groups. Note that the standard approach also suggested different average CTh among the clinical phenotypes (F [4564] = 35.24, P < .001), but see the Online Supplemental Data for the statistical details.

We investigated whether MAP discriminates among MS clinical phenotypes: Especially, the TPF (A) yielded high potential for classifying among MS clinical phenotypes because it was significantly different between PMS and HC/CIS/RRMS and, moreover, discriminated RRMS from HC. The thick patch count (B) was less sensitive and only differentiated SPMS and RRMS from HC. Boxplots show median (notched), IQRs, and outliers (dots); boxplot width reflects the square root of sample sizes. The asterisk denotes statistical significance at P < .05; double asterisks, P < .001 in post hoc testing.
MAP Is Associated with Established Scores Reflecting MS Disease Burden
Third, we tested whether MAP is associated with established scores reflecting MS disease burden (Fig 4): General linear modeling suggested significant correlations of all analyzed metrics with the TPF, including EDSS (P = .0151), the cognitive MuSIC score (P = .035), the fatigue MuSIC score (P = .017), and lesion volume (P < .001). Of note, the standard approach, ie, raw averaged CTh values, did not show significant associations with the EDSS score (P = .132). Bootstrapping suggested that the differences in correlations between EDSS and TPF versus EDSS and the standard approach were significantly different, given that the 95% CI interval did not include 0.00 (Online Supplemental Data). Correspondingly, Monte Carlo resampling demonstrated this significance formally (z = 3.413, P = .0006). Statistical details of the ANOVAs can be found in the Online Supplemental Data.

We tested associations of MAP with established scores of MS disease burden: We found that the primary outcome of MAP, ie, the TPF, was significantly associated with EDSS scores (A), the cognitive MuSIC score (B), the fatigue MuSIC score (C), and lesion volume (D).
MAP Allows Straightforward Visualization of Region-Wise Atrophy
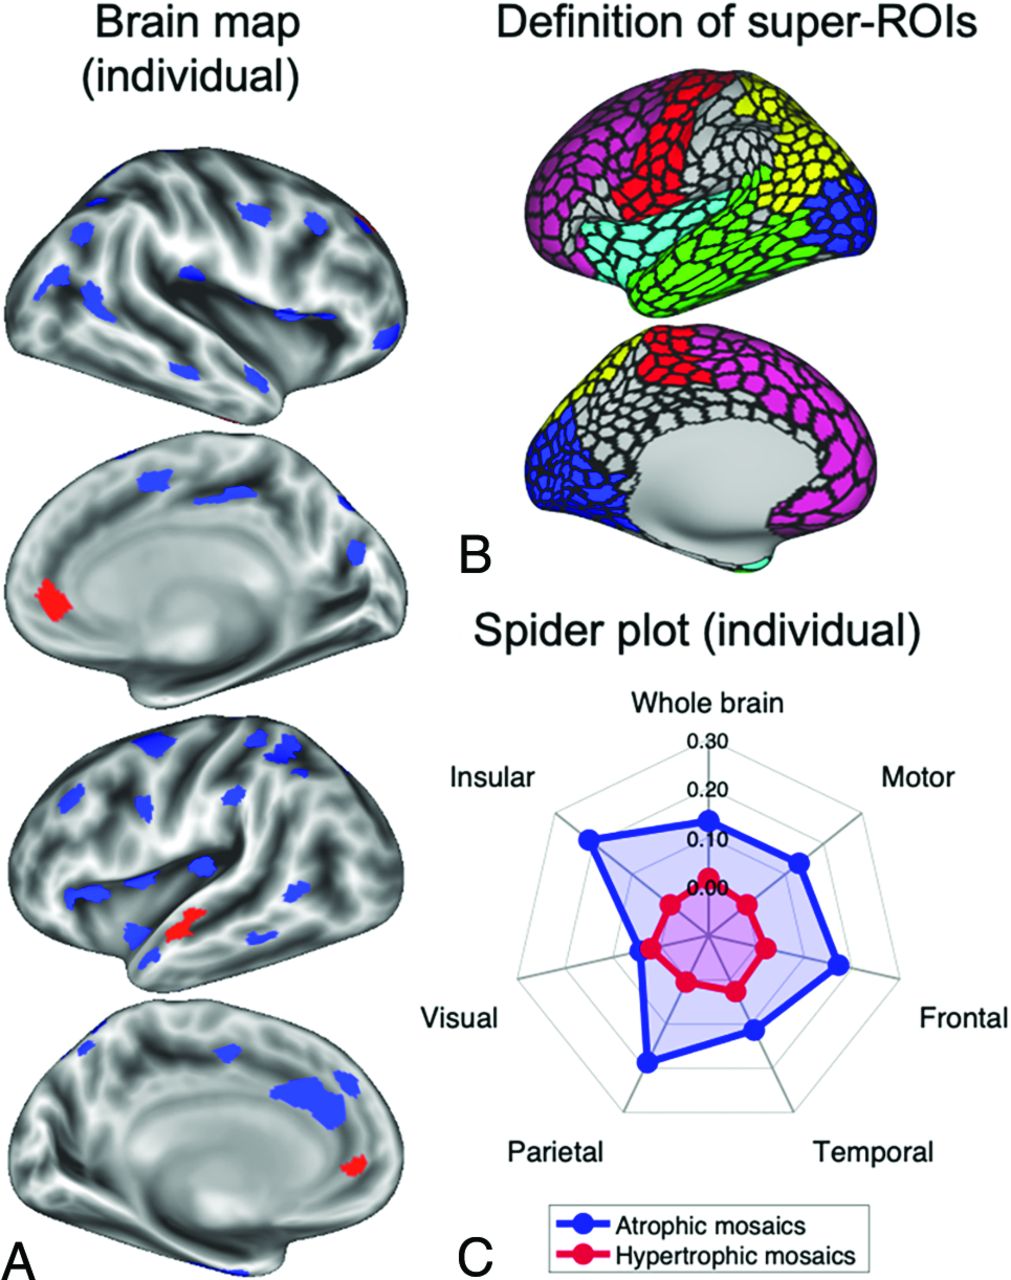
In Fig 5, we demonstrate the potential of MAP for straightforward visualization of individualized atrophy (or hypertrophy). Figure 5A shows a brain map from a single patient with RRMS, whereas blue patches indicate significantly “atrophic,” and red, significantly “hypertrophic” areas. Furthermore, the method allows further anatomic refinement: For example, in Fig 5B, we defined 6 super-ROIs, ie, anatomically labeled accumulations of patches around the motor, frontal, parietal, insular, temporal, and visual cortices. With this partitioning, one can assess the TPF per super-ROI instead of across the whole cortex. This information can be visualized straightforward, eg, using spider plots, such as the one shown in Fig 5C, which shows patient yields of relatively high disease burden in the insular and temporal cortices but relatively little involvement of the visual cortices.

MAP allows visualizing individual brain maps with regionally specific estimations of atrophy (blue) or hypertrophy (red) based on comparisons with a matched reference group (A). This method may be further refined anatomically; for example, instead of summing thin patches across the entire cortex, one can specify super-ROIs (B) such as motor (red), frontal (purple), parietal (yellow), insular (light blue), temporal (green), and visual (dark blue) cortices. Thin/thick patch fractions can then be calculated for each of these super-ROIs and used for an individual and regionally specific illustration, eg, in a spider plot (C).
Quantile Analyses
To estimate the effects of different data sources of HC (TUM versus CamCAN), we ran quantile comparisons (Online Supplemental Data). We found that TUM-MS had consistently higher TPF quantile scores compared with TUM-HC (Online Supplemental Data). Moreover, we found that the quantile rank of the 50% (80%/95%) TUM-HC quantile score (TPF = 0.089/0.149/0.263) corresponded to the 36% (67%/90%) TUM-MS quantile rank (Online Supplemental Data), suggesting that TUM-MS yielded more TPFs.
DISCUSSION
In this study, we tested the validity of a relatively novel biomarker for assessing cortical disease burden in patients with MS. This strategy is based on averaging CTh across a high-resolution parcellation (No. of patches = 1000) and testing each of those patches for significantly different CTh with reference to an age-/sex-matched HC group. The method was hence dubbed MAP, and its primary outcome measure is the thin (thick) patch fraction, which indicates the fraction of significantly atrophic (hypertrophic) patches. We tested 3 potential clinical applications of MAP for MS, demonstrating the following: 1) both thin and thick patch fractions successfully differentiate patients with MS from HC, 2) TPF discriminates among MS clinical phenotypes, and 3) TPF is significantly associated with established measures reflecting MS disease burden, including EDSS, cognition and fatigue scores, as well as lesion volume. Of note, the standard approach did not show a significant correlation to EDSS. Post hoc testing using resampling approaches demonstrated the superiority of MAP versus the standard approach with respect to the association with EDSS. Finally, MAP can also be used for visualizing localized atrophy in a single-subject manner, as demonstrated in Fig 5.
Potential of MAP for Care of Patients with MS, Clinical Trials, and AI Applications
This study provides evidence that MAP, a cortical biomarker constructed from T1WI data, can provide clinically relevant information regarding GM pathology in MS. MAP is a software-supported MR imaging evaluation system that assesses T1WI data of single patients with respect to a control group to detect deviations from normality. Of particular importance, we considered reference data from open-source MR imaging repositories (ie, the CamCAN database) so that our results suggest the general validity of rating individual data with respect to externally acquired HC. Furthermore, our findings suggest that although GM estimation is known to be affected by differences in MR imaging hardware and sequence parameters such as TI,34,35 such a system has diagnostic value. This is of particular importance given the emerging need for quantification of GM for precision medicine in MS.15 Provided that increasing open-source population-based MR imaging data sets become available, our findings suggest that such resources can be used as adequate reference standards for personalized interpretation of MR imaging data.36
Of note, MAP allows straightforward visualization of the topography of probable disease burden for single patients (Fig 5A), which may prove invaluable for MS diagnosis, given the vast heterogeneity of GM atrophy patterns.37,38 As we showed before investigating patients from the motor neuron disease spectrum, MAP can readily be used for monitoring atrophy progression in individual patients.20,21 Although we focused our investigation on a variant of MAP that estimates disease burden across the entire cortex, we have also shown that further anatomic refinement of the method can be implemented easily so that disease burden can be specified for distinct anatomic areas of interest such as the motor cortex or frontal lobe. Such anatomic refinement is likely to have even more information for the care of patients with MS, given the demonstrated clinical relevance of the topography of atrophy patterns in MS.39⇓-41
Another potential application of MAP for MS is its implementation as an outcome variable in clinical trials. Whereas numerous outcome measures have been defined for MS,42 a personalized outcome measure to quantify cortical GM disease burden has not yet been established. Given that neurodegeneration plays a crucial role in controlling disability progression in MS,43,44 this is a gap that needs to be filled. We believe that MAP, via its primary outcome measure, TPF, can provide a feature for enhancing personalized detection of cortical abnormality using AI-based applications.
Limits
The current study has limitations that need to be further evaluated before any potential clinical translation of MAP into MS clinical practice. Currently, the main drawback of the here-proposed strategy is the overall small sample size of the reference group. Although we have included >700 HC from both externally and locally acquired data resources in our investigation, the size of this reference group was considerably smaller for an individually assessed patient due to age- and sex-matched selection. This feature results in discrete reference distributions and, hence, P values in permutation testing, which might, in turn, hamper statistical power.31 It might also explain why both thin and thick patches were found for our internal HC group, whereas one would expect to find no such differences for a perfect external reference population. Nevertheless, thin patches being significantly higher in MS demonstrates the discriminative power of MAP. As increasingly large-scale population-representative MR imaging databases are becoming available, this availability provides a promising opportunity for boosting the sizes of reference data, which is essential for further statistical refinement of MAP and thus an ongoing effort in our lab.
Another limitation is that the age and sex distributions from the 2 HC groups differed. The externally acquired CamCAN-HC were, on average, markedly older than the internally acquired TUM-HC. Notice, however, that the difference was expected, provided CamCAN-HC were recruited to match uniform sex and age distributions throughout the ages (spanning from ∼20 years to ∼90 years) and TUM-HC were recruited to match patients with MS from TUM. Note, however, that we constructed age- and sex-matched “personalized” control cohorts for each individual (see the Online Supplemental Data for details). Furthermore, both age and sex were included in all statistical assessments as variables-of-no-interest. Notice, however, that within linear regression modeling, this feature can reduce potential confounding effects but not fully eliminate them.45
Even with such further statistical refinement, MAP as presented herein can only be 1 component of a biomarker for MS. Despite the established significance of cortical atrophy for clinical manifestation,46,47 MS is a multidimensional disorder that affects a vast range of functional systems.48 Therefore, a comprehensive MS biomarker requires multivariate construction, also taking into account, beyond MR imaging metrics, molecular measures such as neurofilaments, metabolites, and microbiomes.49 In terms of neuroradiologic markers, tools reflecting individual subthalamic GM atrophy and WM microstructure will provide further important insight for precise assessment of overall CNS disease burden and will, thus, allow more accurate personalized patient management in MS.50
Finally, although MAP is calculated and can be visualized for single patients, the present validation was based on group-level statistics. Therefore, we cannot claim MAP as a personalized cortical biomarker in its current form. A truly individualized assessment would typically rely on AI-based methods. However, MAP and TPF provide a validated feature with which AI-algorithms can be trained.
Despite its limitations, the MAP method, even in its current form, offers a neuroradiologic tool for software-supported assessment of cortical disease burden in MS. It can be readily collected on a regular basis in a timesaving, digital way and be visualized for individuals to localize potential cortical disease burden. Thus, MAP provides an objective, reliable, automatized, and digital solution for MS diagnostics, monitoring cortical disease progression, and may ultimately serve as an outcome measure in clinical trials, given its demonstrated relevance for neurologic impairment.
CONCLUSIONS
This study demonstrates the validity of using external T1WI data for referencing single-patient data to detect signs of abnormal CTh in MS (MAP). MAP had previously been shown to yield relevant diagnostic information in primary neurodegenerative disorders including ALS, PLS, and FTD. Here, we showed that the primary outcome measure of MAP, the TPF, differentiates MS from HC, discriminates among MS phenotypes, and is associated with established scores of MS disease burden, including EDSS, cognitive and fatigue scores, as well as lesion volume. Provided this evidence, we believe that MAP can contribute to a neuroradiologic biomarker for MS diagnostics. Furthermore, MAP can accelerate the development of a personalized MS biomarker since it provides a feature on which AI-based algorithms can be trained. Such individual features can enhance precision medicine in this highly heterogeneous disorder.
Footnotes
A.B. has received consulting and/or speaker fees from Alexion, Biogen, Celgene, Horizon, Novartis, Roche, and Sandoz/Hexal, and his institution has received compensation for clinical trials from Alexion, Biogen, Merck, Novartis, Roche, and Sanofi Genzyme, all outside the current work. J.S.K. has received speaker fees from Novartis. B.H. has served on scientific advisory boards for Novartis; he has served as data safety monitoring board member for AllergyCare, Sandoz, Polpharma, Biocon, and TG Therapeutics; his institution received research grants from Roche for MS research. He has received honoraria for counseling (Gerson Lehrmann Group). He holds part of 2 patents; one for the detection of antibodies against KIR4.1 in a subpopulation of patients with MS and one for genetic determinants of neutralizing antibodies to interferon. B.H. is associated with Data Integration for Future Medicine (DIFUTURE) (BMBF 01ZZ1804[A-I) and received funding for the study by the European Union's Horizon 2020 Research and Innovation Program (grant MultipleMS, EU RIA 733161) and the Deutsche Forschungsgemeinschaft (DFG, German Research Foundation) under Germany's Excellence Strategy within the framework of the Munich Cluster for Systems Neurology (EXC 2145 SyNergy; ID 390857198). All conflicts are not relevant to the topic of the study.
Disclosure forms provided by the authors are available with the full text and PDF of this article at www.ajnr.org.
References
- Received August 4, 2023.
- Accepted after revision October 18, 2023.
- © 2024 by American Journal of Neuroradiology


Jump to section
Related Articles
Cited By...
- No citing articles found.