
Article Figures & Data
Figures
- Fig 1.
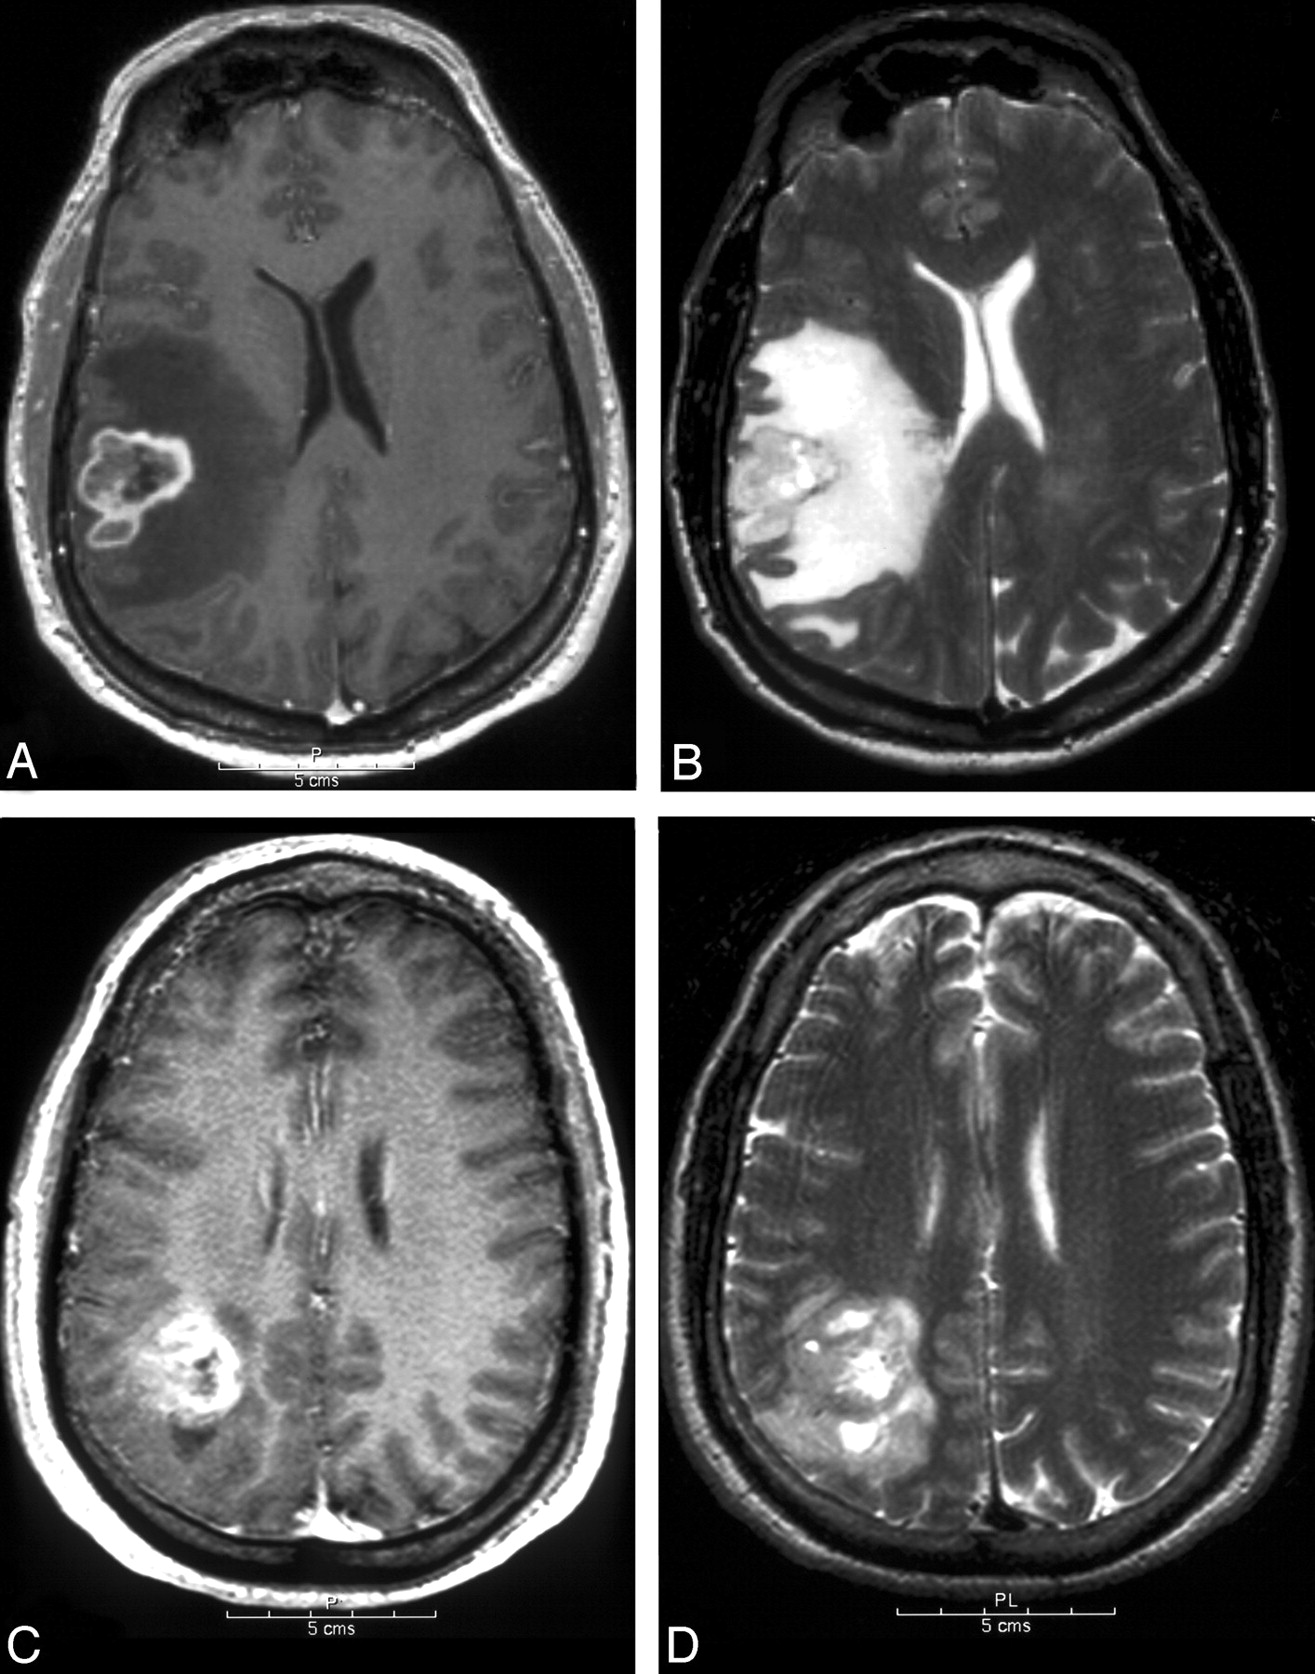
MR images of patients with GBM.
A, Axial postcontrast T1-weighted images. There is an enhancing tumor with central, irregular hypoenhancement consistent with necrosis.
B, Axial T2-weighted images of the same patient shown in panel A. High T2-weighted signal intensity surrounds the tumor, with signal intensity approaching that of CSF as seen in the lateral ventricles. The T2-weighted signal intensity change respects the cortical ribbon. The appearance is indicative of vasogenic edema (grade 2, extending more than 1 cm from the tumor, per definitions in Table 1).
C, Axial postcontrast T1-weighted images of another GBM patient. As in the first case there is an enhancing tumor with irregular central hypoenhancement indicating necrosis.
D, Axial T2-weighted images of the same patient shown in panel C. Adjacent to the enhancing portion of the tumor, there is increased T2-weighted signal intensity, which is significantly lower than that of CSF, which extends into the cortex and does not respect the cortical ribbon. The gray-white distinction is obscured. The region corresponds to areas of mildly low T1-weighted signal intensity. This appearance reflects the presence of nonenhancing tumor (nCET). There is also a sliver of higher T2-weighted signal intensity change at the medial margin of the tumor, which indicates a small amount of edema.
- Fig 2.
Survival curves for glioblastoma. Favorable (n = 16) is tumors with nCET and without edema, satellites, and multifocal disease. Unfavorable (n = 17) is edema, and either satellites or multifocal disease, without nCET (n = 110 for all GBM patients).
- Fig 3.
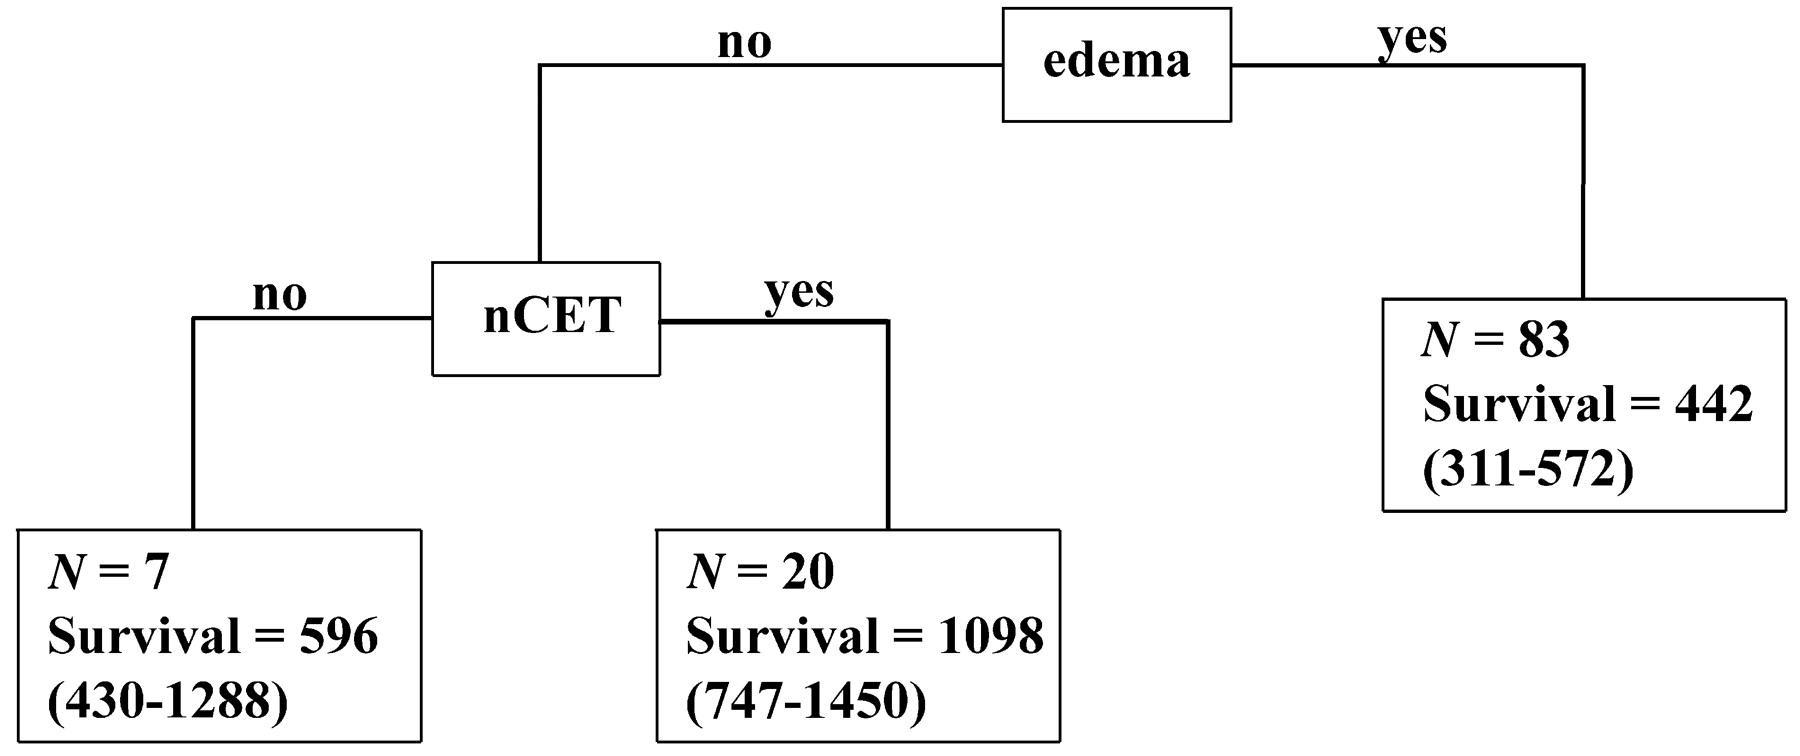
Recursive partitioning analysis. All 15 imaging features as described in the Methods section were entered into the recursive partitioning algorithm. The 95% confidence intervals are shown in parentheses.


Tables
Variable Score Score Description Necrosis 0 no, 1 yes Necrosis is defined as a region within the tumor that does not enhance or shows markedly diminished enhancement, is high on T2W and proton density images, is low on T1W images, and has an irregular border Enhancement 0 no, 1 yes Contrast enhancement is defined as having all or portions of the tumor that demonstrate significantly higher signal on the postcontrast T1W images compared to precontrast T1W images Enhancing rim 0 none, 1 thin, 2 thick, N/A If most of the enhancing rim is thin, regular, and has homogenous enhancement, the tumor receives a score of 1. If most of the rim demonstrates nodular and/or thick enhancement, the score is 2. If there is only solid enhancement and no rim, the score is 0. The scoring is not applicable if there is no contrast enhancement Enhancing margin 0 well defined, 1 poorly defined, N/A If most of the outside margin of the enhancement is well defined, the tumor is scored 1 The scoring is not applicable if there is no contrast enhancement NEM (grade III) 0 smooth, 1 irregular If most of the outside nonenhancing margin of the tumor is well defined and smooth (geographic), the tumor is scored 0. If the margin is ill defined, the tumor is scored 1 Solid enhancement 0 none, 1 part, 2 all, N/A If the enhancing portion of the tumor enhances solidly, without cystic or necrotic components, the tumor is scored 2. If there are both regions of solid enhancement as well as necrosis or central irregular nonenhancement or cyst formation, the tumor is scored 1. If the tumor demonstrates only peripheral or ring enhancement without significant portions, the tumor is scored 0. If there is no enhancement, this variable is not applicable nCET 0 no, 1 yes Nonenhancing tumor is defined as regions of T2W hyperintensity (less than the intensity of cerebrospinal fluid, with corresponding T1W hypointensity) that are associated with mass effect and architectural distortion, including blurring of the gray-white interface Edema 0 none, 1 mild, 2 moderate/severe If no convincing edema, as demonstrated by regions of very bright T2W signal, then a score of 0 is given. If there is clearly visible, bright T2W signal not associated with mass effect and architectural distortion (see nonenhancing tumor) and not extending more than 1 cm beyond the tumor margin, the score is 1. If there is more extensive, very bright T2W signal intensity, often following white-matter tracts and extending significantly beyond (>1 cm) the margins of the tumor, the edema is scored a 2 Cyst(s) 0 no, 1 yes Cysts are well defined, rounded, often eccentric regions of very bright T2W signal and low T1W signal essentially matching CSF signal intensity, with very thin, regular, smooth, nonenhancing or regularly enhancing walls, possibly with thin, regular, internal septations Multifocal 0 no, 1 yes Multifocal is defined as having at least one region of tumor, either enhancing or nonenhancing, which is not contiguous with the dominant lesion and is outside the region of signal abnormality (edema) surrounding the dominant mass Satellites 0 no, 1 yes A satellite lesion is within the region of signal abnormality surrounding the dominant lesion but not contiguous in any part with the major tumor mass Extent of resection <20%, 20%–89%, 90%–99%, 100% The first postoperative scan (contrast-enhanced MR imaging) was assessed for tumor residual. Presence of both enhancing and nonenhancing tumor was determined. Scans were scored 100% resection if no tumor residual was visible. Trace tumor residual <10% of the total corresponded to the 90%–99% category. If the tumor was debulked, but substantial tumor remained, a score of 20%–89% was used. If the tumor was biopsied only, then 0%–19% was used. TCM 0 no, 1 yes ECM 0 no, 1 yes, N/A Location Frontal, parietal, temporal, occipital, corpus callosum, thalamus Size Unidimensional, largest diameter in millimeters Side Left, right Note.—NEM indicates nonenhancing margin; nCET, noncontrast-enhancing tumor; TCM, tumor crosses midline; ECM, edema crosses midline.
Attribute Grade III Gliomas Glioblastoma Mean SD 95% CI Mean SD 95% CI Age 40.4 14.1 36.4–45.2 54.9 14.3 52.0–57.8 KPS 86.9 12.8 82.9–90.9 84.2 14.1 81.4–87 Survival (days) 2010 232 1560–2460 748 60.6 630–867 Sex Female, 52.4% Female, 34.5% Male, 47.6% Male, 65.5% Oligodendroglioma None Minor Major None Minor Major Component (%) 38.1 28.6 33.3 85.5 7.2 7.3 Resection (%) 100 90–99 20–89 0–19 100 90–99 20–89 0–19 16.6 26.2 31.0 26.2 33.7 23.5 26.5 16.3 Note.—KPS indicates Karnofsky performance status.
Attribute Grade III Gliomas Glioblastomas HR 95% CI P Value HR 95% CI P Value Clinical Age 3.74 1.09–12.9 .036 2.29 1.35–3.86 .002 KPS 0.96 0.93–0.99 .006 0.98 0.96–0.99 .005 Oligodendroglioma component 1.06 0.55–2.07 .854 0.58 0.34–0.99 .047 Resection 1.22 0.67–2.23 .517 1.08 0.85–1.37 .530 Imaging Enhancing rim 1.68 0.34–8.37 .519 1.16 0.73–1.84 .522 SE 0.79 0.38–1.61 .508 1.04 0.66–1.63 .863 CE 3.30 0.71–15.3 .127 1.53 0.21–11.1 0.68 ECM 2.45 0.76–7.87 .134 1.33 0.81–2.21 .264 TCM 2.45 0.76–7.87 .134 1.31 0.72–2.36 .374 Location 0.97 0.63–1.52 .914 1.04 0.88–1.23 .639 Multifocal 18.7 3.06–115 .002 4.34 2.11–8.92 .001 Necrosis 4.43 1.35–14.6 .014 1.24 0.30–5.09 .764 nCET 0.05 0.01–0.55 .014 0.55 0.33–0.92 .023 EM 0.32 0.07–1.35 .121 0.64 0.37–1.12 .120 NEM 2.95 0.85–10.3 .089 Satellites 5.18 1.11–24.1 .036 1.74 1.03–2.93 .038 Side 0.80 0.17–3.79 .782 1.29 0.79–2.07 .300 Size 1.16 0.90–1.50 .235 1.05 0.94–1.17 .393 Cyst 0.03 0.00–20.8 .302 0.92 0.46–1.80 .799 Edema 1.99 0.79–3.99 .158 1.62 1.18–2.22 .003 Note.—HR indicates hazard ratio (of dying); KPS, Karnofsky performance status; SE, solid enhancement; CE, contrast enhancement; ECM, edema crosses midline; TCM, tumor crosses midline; nCET, noncontrast-enhancing tumor; EM, enhancing margin; NEM, nonenhancing margin.
KPS Age Necrosis nCET Edema KPS −0.290 −0.156 0.100 −0.128 P .002 .103 .301 .184 Age −0.290 0.194 −0.374 0.300 P .002 .042 .001 .001 nCET 0.100 −0.374 −0.076 −0.357 P .301 <.001 .429 <.001 Edema −0.128 0.300 0.159 −0.357 P .184 .001 .098 <.001 Multifocality −0.178 0.149 0.069 0.174 .165 P .063 .119 .474 .069 0.084 Satellites −0.064 0.105 0.131 0.025 0.122 P .510 .275 .174 .792 .204 Note.—KPS indicates Karnofsky performance status; nCET, noncontrast-enhancing tumor. Correlations with P values <.05 are set in boldface type.
In this issue


Jump to section
Related Articles
Cited By...
- Association of Graph-based Spatial Features with Overall Survival Status of Glioblastoma Patients
- MGMT Promoter Methylation Status in Initial and Recurrent Glioblastoma: Correlation Study with DWI and DSC PWI Features
- Assessment of Prognostic Value of Cystic Features in Glioblastoma Relative to Sex and Treatment with Standard-of-Care
- Deep Transfer Learning and Radiomics Feature Prediction of Survival of Patients with High-Grade Gliomas
- Prognostic value of magnetic resonance imaging features in low-grade gliomas
- Non-Contrast-Enhancing Tumor: A New Frontier in Glioblastoma Research
- Predicting cancer outcomes from histology and genomics using convolutional networks
- Prognostic Implications of Gadolinium Enhancement of Skull Base Chordomas
- Predicting cancer outcomes from histology and genomics using convolutional networks
- Radiomics in Brain Tumor: Image Assessment, Quantitative Feature Descriptors, and Machine-Learning Approaches
- MR Imaging Characteristics Associate with Tumor-Associated Macrophages in Glioblastoma and Provide an Improved Signature for Survival Prognostication
- T2-FLAIR Mismatch, an Imaging Biomarker for IDH and 1p/19q Status in Lower-grade Gliomas: A TCGA/TCIA Project
- The Initial Area Under the Curve Derived from Dynamic Contrast-Enhanced MRI Improves Prognosis Prediction in Glioblastoma with Unmethylated MGMT Promoter
- Early-Stage Glioblastomas: MR Imaging-Based Classification and Imaging Evidence of Progressive Growth
- Radiologic Features and Expression of Vascular Endothelial Growth Factor Stratify Survival Outcomes in Patients with Glioblastoma
- The Added Prognostic Value of Preoperative Dynamic Contrast-Enhanced MRI Histogram Analysis in Patients with Glioblastoma: Analysis of Overall and Progression-Free Survival
- Patterns of Tumor Contrast Enhancement Predict the Prognosis of Anaplastic Gliomas with IDH1 Mutation
- Quantification of Nonenhancing Tumor Burden in Gliomas Using Effective T2 Maps Derived from Dual-Echo Turbo Spin-Echo MRI
- MRI Grading versus Histology: Predicting Survival of World Health Organization Grade II-IV Astrocytomas
- Advanced Magnetic Resonance Imaging of the Physical Processes in Human Glioblastoma
- Extent of Resection of Glioblastoma Revisited: Personalized Survival Modeling Facilitates More Accurate Survival Prediction and Supports a Maximum-Safe-Resection Approach to Surgery
- Arterial Spin-Labeling Assessment of Normalized Vascular Intratumoral Signal Intensity as a Predictor of Histologic Grade of Astrocytic Neoplasms
- Relationship between Tumor Enhancement, Edema, IDH1 Mutational Status, MGMT Promoter Methylation, and Survival in Glioblastoma
- Survival Analysis of Patients with High-Grade Gliomas Based on Data Mining of Imaging Variables
- Evidence for Sequenced Molecular Evolution of IDH1 Mutant Glioblastoma From a Distinct Cell of Origin
- Conventional MRI evaluation of gliomas
- Relationship between radiological characteristics and combined 1p and 19q deletion in World Health Organization grade III oligodendroglial tumours
- Identification of noninvasive imaging surrogates for brain tumor gene-expression modules
- Relationship between Survival and Edema in Malignant Gliomas: Role of Vascular Endothelial Growth Factor and Neuronal Pentraxin 2
- MRI in patients with high-grade gliomas treated with bevacizumab and chemotherapy