
Abstract
BACKGROUND AND PURPOSE: There is an increasing interest in use of postmortem MR imaging as an adjunct or alternative to autopsy. Before evaluating spinal pathology on postmortem MR imaging, it is important to have knowledge of the normal appearance of the fetal spine at different gestational ages. The aim of this study is to describe the MR imaging appearances of normal development of the fetal spine at different gestational ages.
METHODS: Postmortem MR imaging was performed on 30 fetuses ranging from 14 to 41 gestational weeks. There was no structural abnormality of the spine in these fetuses on MR imaging or at autopsy. Fast spin-echo T2-weighted MR imaging of the lumbar spine was performed in the coronal plane in all cases and supplemented by sagittal and/or axial imaging. The following parameters were measured: height of the L1/2 disk and L2 vertebral body and area of ossification center in L2 vertebral body as well as area of vertebral body. The signal intensity of the disk space and the vertebral level of conus termination were also assessed.
RESULTS: The height and area of the vertebral body increased linearly with gestational age (P <.01). The increase in disk space was proportionally greater than the increase in vertebral body height as gestational age increased (P <.01). The disk space appeared as a linear low-signal-intensity area in fetuses ≤21 weeks gestation but increasingly developed high signal intensity in the disk after 21 weeks. The size of the ossification center increased with gestational age (P <.01), and the ratio of ossification center to the overall size of the vertebral body also increased with gestational age (P <.01). In fetuses less than 35 weeks of age, the conus lay between L2 and L5 level, whereas in fetuses more than 35 weeks of age, the conus lay between L1/2 and L2/3 level.
CONCLUSION: Understanding the normal growth and signal-intensity characteristics of the fetal spine on postmortem MR imaging is essential before studying abnormal fetal spine.
In the last few years, there has been extensive publicity on organ retention from autopsies of children without parental consent, as described in 2 reports of the chief medical officer in the United Kingdom.1,2 This has led to significant reduction in the number of autopsies carried out. Recently, there has been an increased interest in using postmortem MR imaging as an alternative to autopsy.3,4 Postmortem MR imaging provides excellent soft-tissue contrast with high spatial resolution. Postmortem MR imaging has the ability to provide information on the structural appearance of organs and lesions and the anatomic relations to other organs, which potentially could replace the need to perform dissection for macroscopic examination of organs. Before studying the abnormal spine on postmortem MR images, it is essential to understand normal appearance of the fetal spine, which would be predicted to change radically during maturation. We are not aware of any published data in the literature on the normal appearance and signal-intensity characteristics of vertebrae and disk spaces on postmortem MR images and the changes that occur with growth of the fetus. The purpose of this study, therefore, was to determine the normal appearance of the fetal lumbar spine on postmortem MR imaging at different gestational ages.
Methods
Between January 2002 and March 2004, 30 fetuses from 14 to 41 gestational weeks (mean, 24.6 gestational weeks) were imaged with MR. The gestational age was estimated by a combination of the woman’s last menstrual period and the assessments made at sonography around 20 weeks after the last menstrual period. This study is part of a larger ongoing postmortem study and has the approval of our local research ethics committee. Informed consent was obtained for the postmortem MR imaging in addition to the consent obtained for routine autopsy. Postmortem MR imaging was performed within 3 days from the time of delivery of the fetus. Autopsy was carried out on the same day or the day after MR imaging examination. Autopsy of the fetuses was performed to confirm the absence of structural abnormalities of the spine or spinal cord. The bodies were stored in a refrigerated environment before imaging, but MR imaging examinations were carried out at room temperature. All MR imaging data were acquired with 1.5T superconducting system (Infinion; Philips Medical Systems, Cleveland, Ohio). All had coronal T2-weighted imaging of the spine, 28/30 had axial T2-weighted imaging of the spine, and 16/30 had sagittal T2-weighted imaging of the spine. The fast spin-echo T2 imaging parameters in each plane were TR (11,460 milliseconds), TE (92 milliseconds), turbo factor (32), field of view (10 cm), section thickness (2 mm), matrix (256 × 256), and scan time (6.06 minutes).
The images were transferred to the VIA 2.0E.003 Twinstar workstation (Marconi/Philips Medical Systems, Cleveland, Ohio), on which measurements were made. All measurements were carried out by a neonatal radiologist (E.H.W.) and pediatric neuroradiologist (E.W.) independently. All of the measurements reported subsequently were made on the coronal T2-weighted image at L2 vertebral body and the L1/2 disk space. The vertebral body level was defined by counting from the vertebra that had the morphologic appearance of L5 upward. The height of the central part of the vertebral body and the disk space was measured, and the ratio of disk space to vertebral body height was calculated. The area of the ossification center of the vertebral body and the area of the vertebral body at midsection were assessed, and the ratio of the area of ossification center of the vertebral body to the area of the vertebral body was calculated as well. The signal intensity of the disk space was categorized as either low signal intensity or high signal intensity relative to the signal intensity of the cartilaginous portion of the vertebral body. The ossification center of the posterior elements was evaluated. The level of the conus was also assessed in terms of the lowest vertebral level at which it was seen. The level of the conus was assessed independently, and then a consensus rating was performed.
Statistical Analyses
Inter-rater reliability was used to assess by using intraclass correlation coefficient as the index of agreement.5 Values >0.80 were considered to indicate good agreement. The mean of the 2 measurements were then used for further analysis. Pearson correlation was made between gestational age and vertebral body height, disk height, and ratio of disk height to vertebral body height. Pearson correlation was also made between gestational age and area of vertebral body, area of ossification center of vertebral body, and ratio of ossification center to vertebral body.
Results
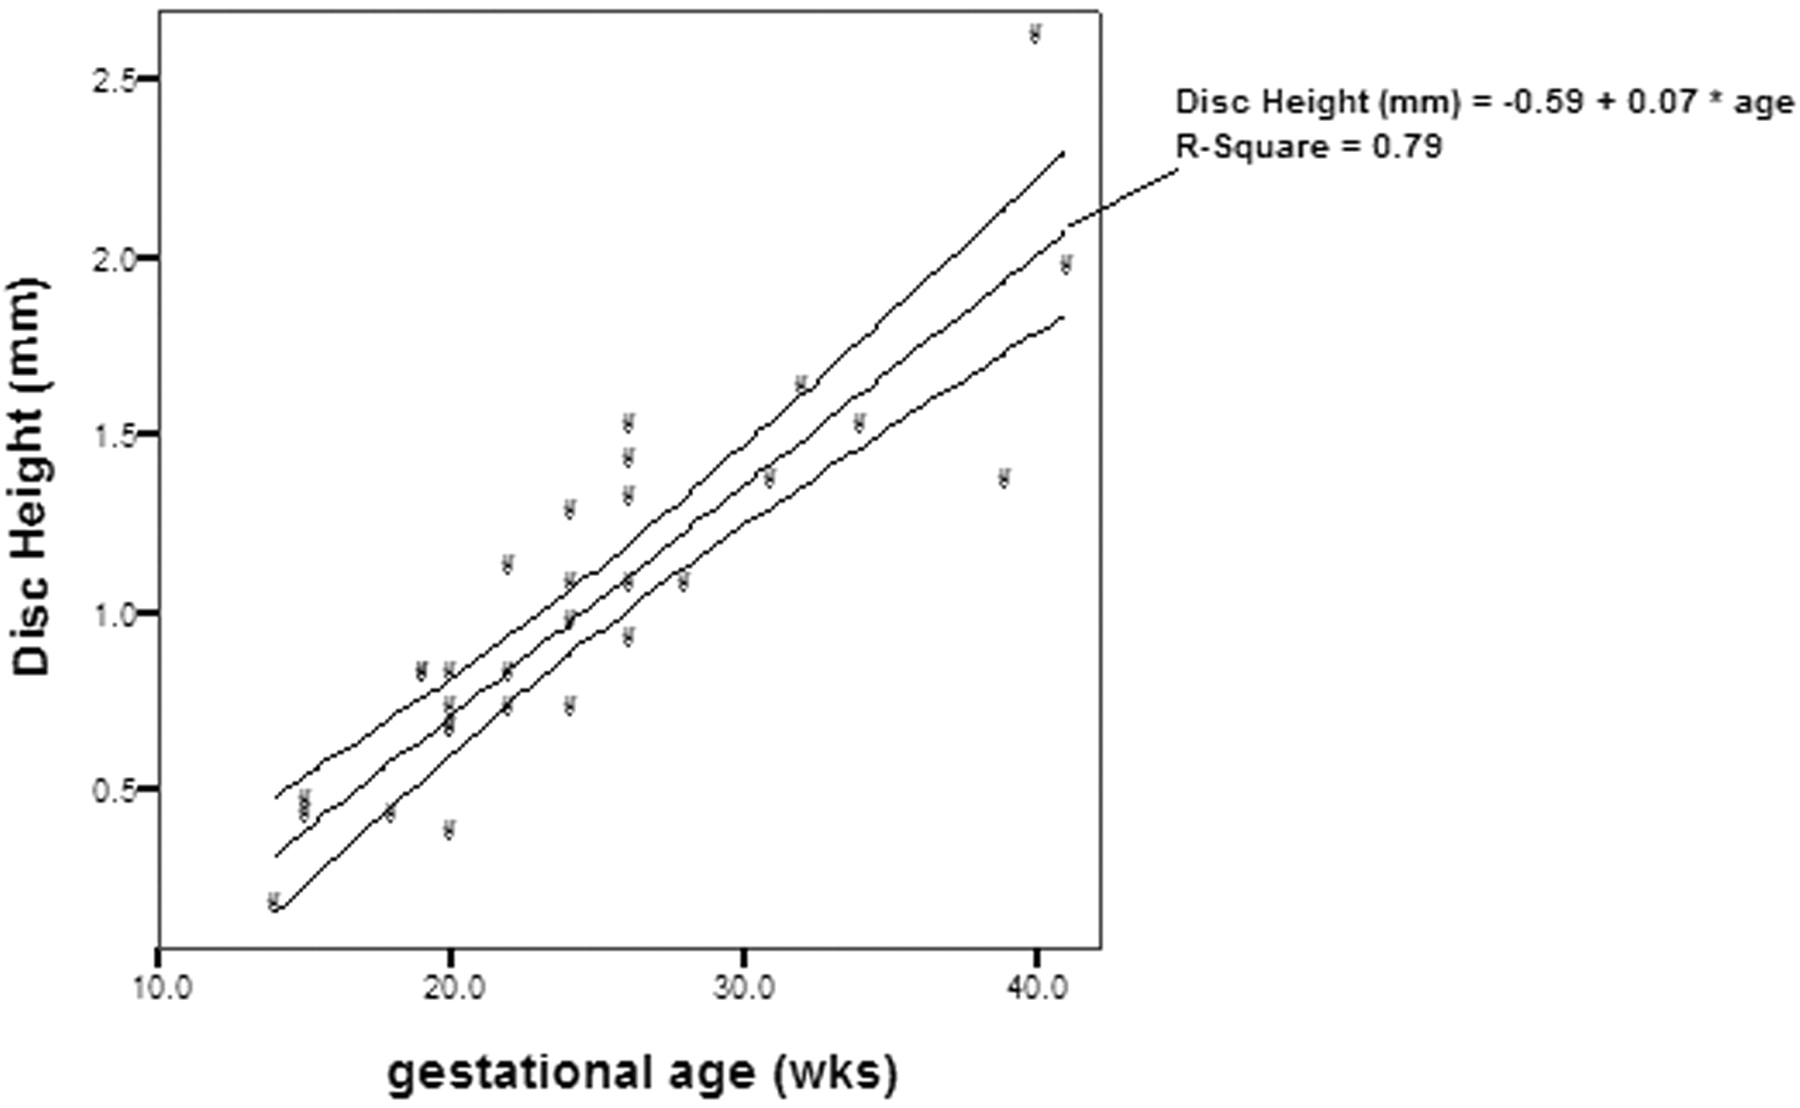
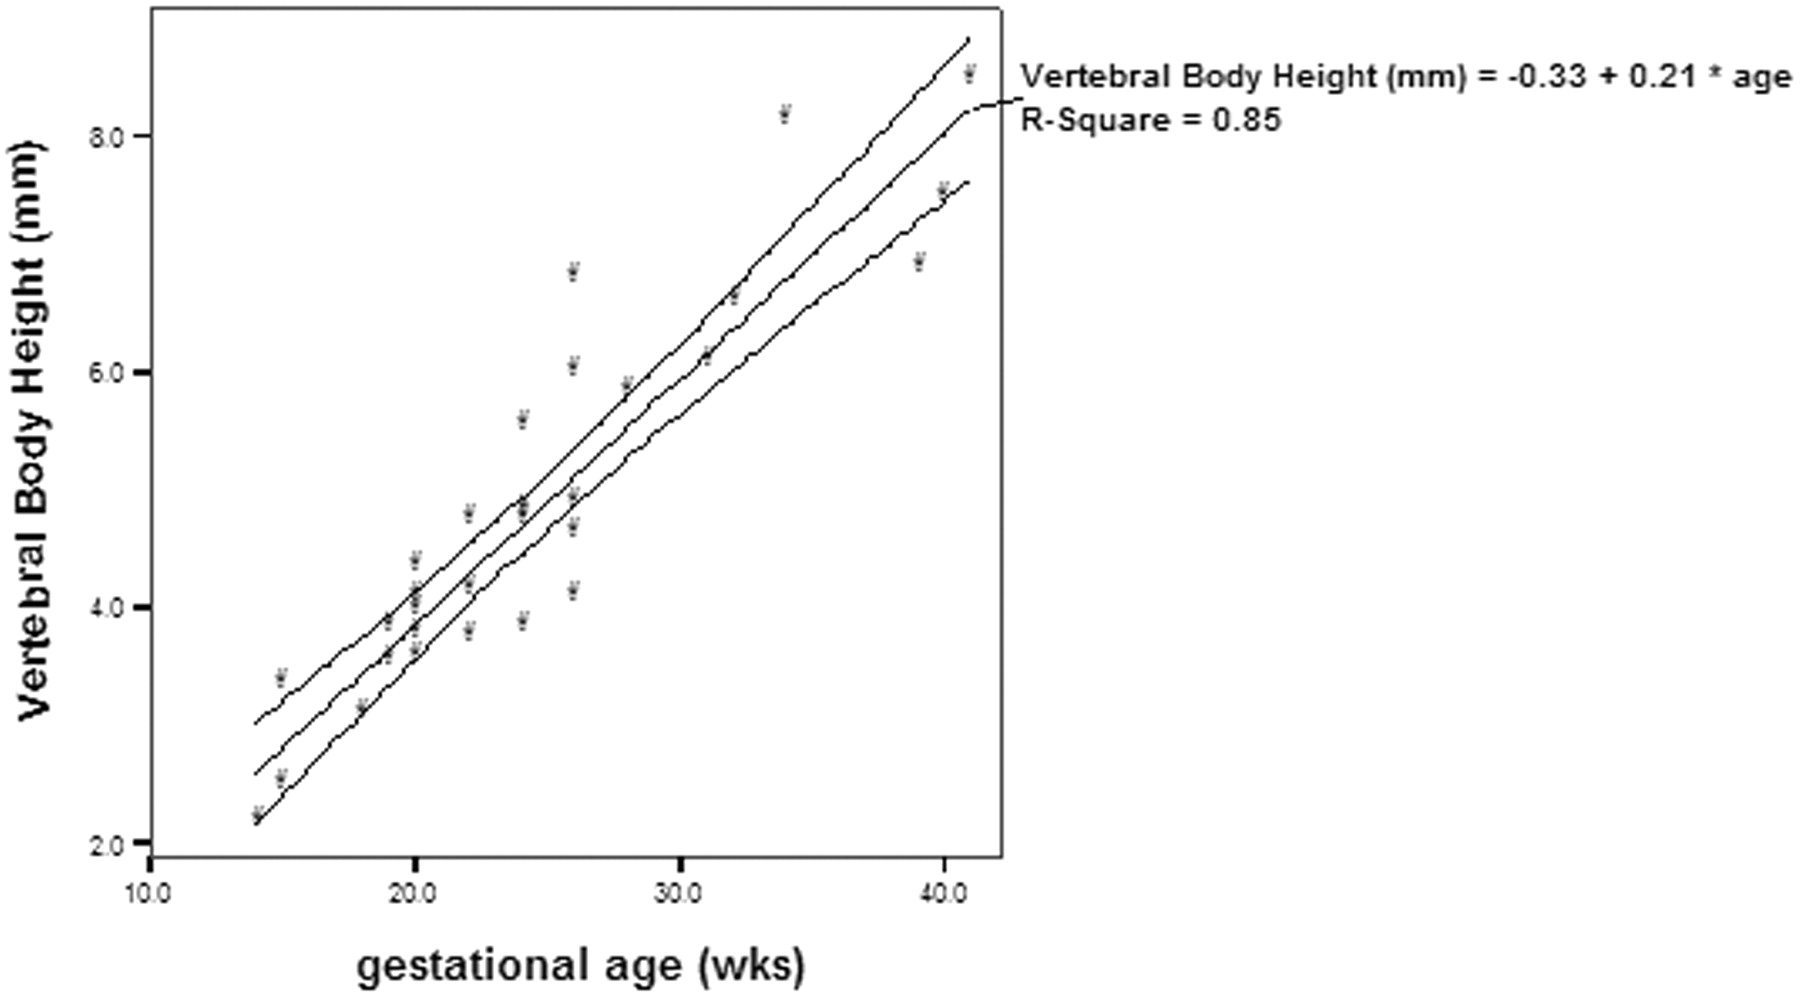
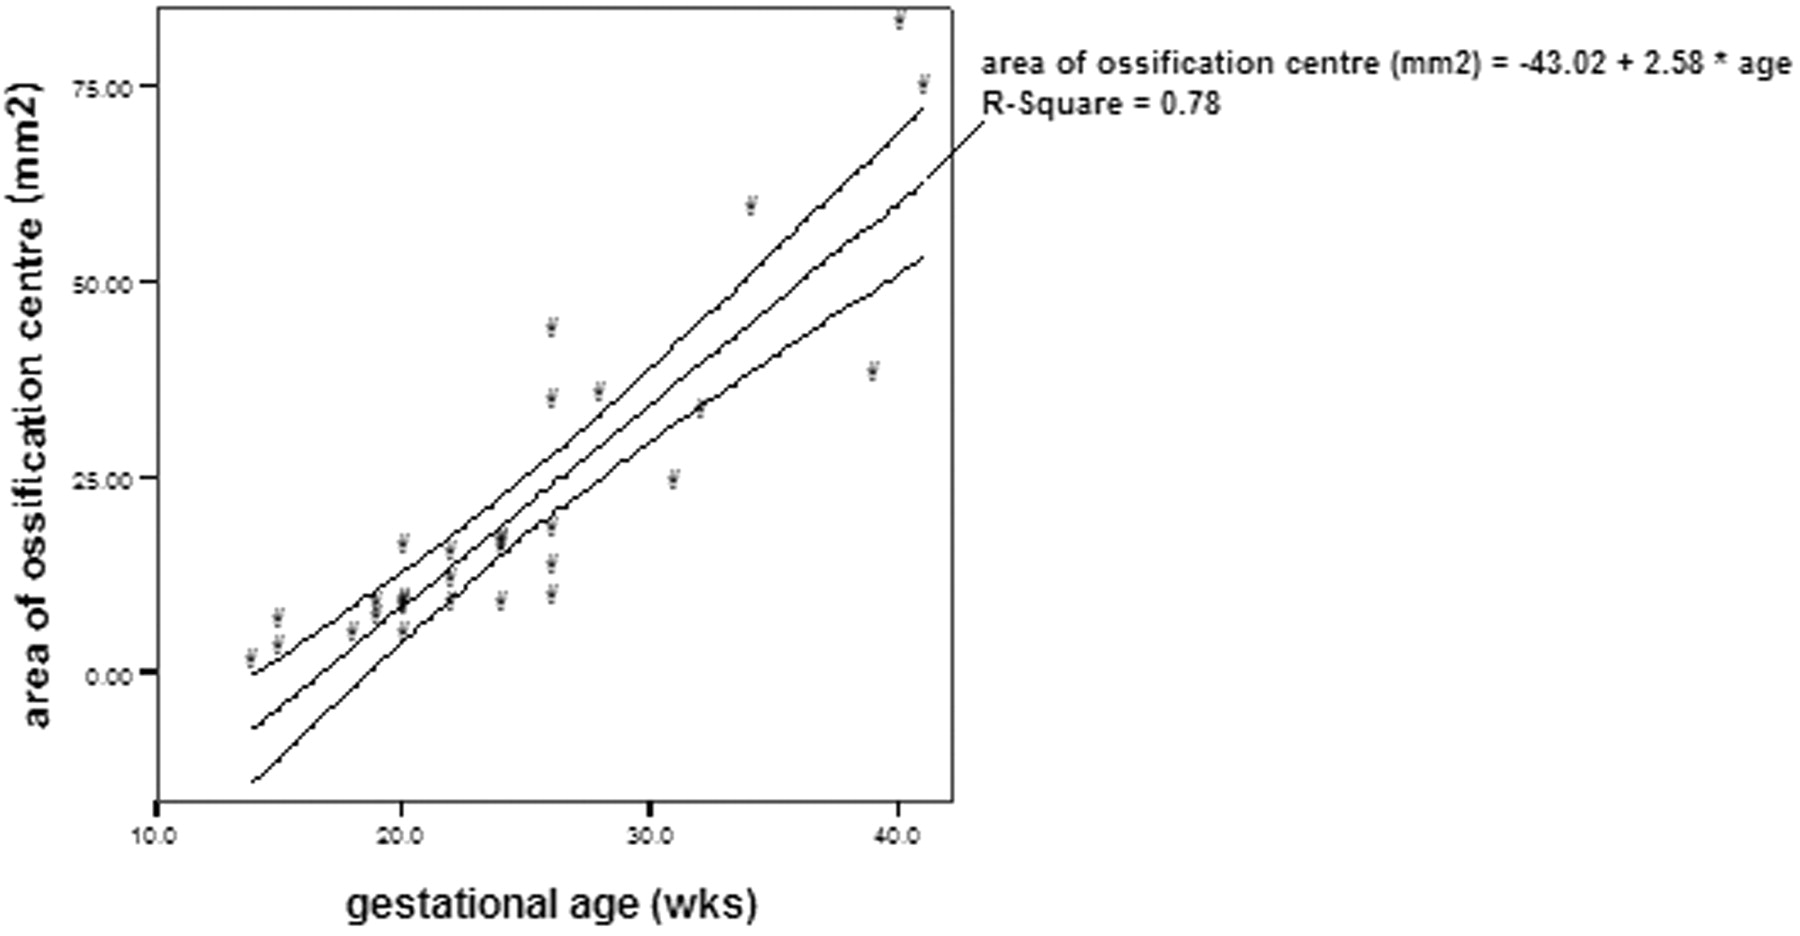
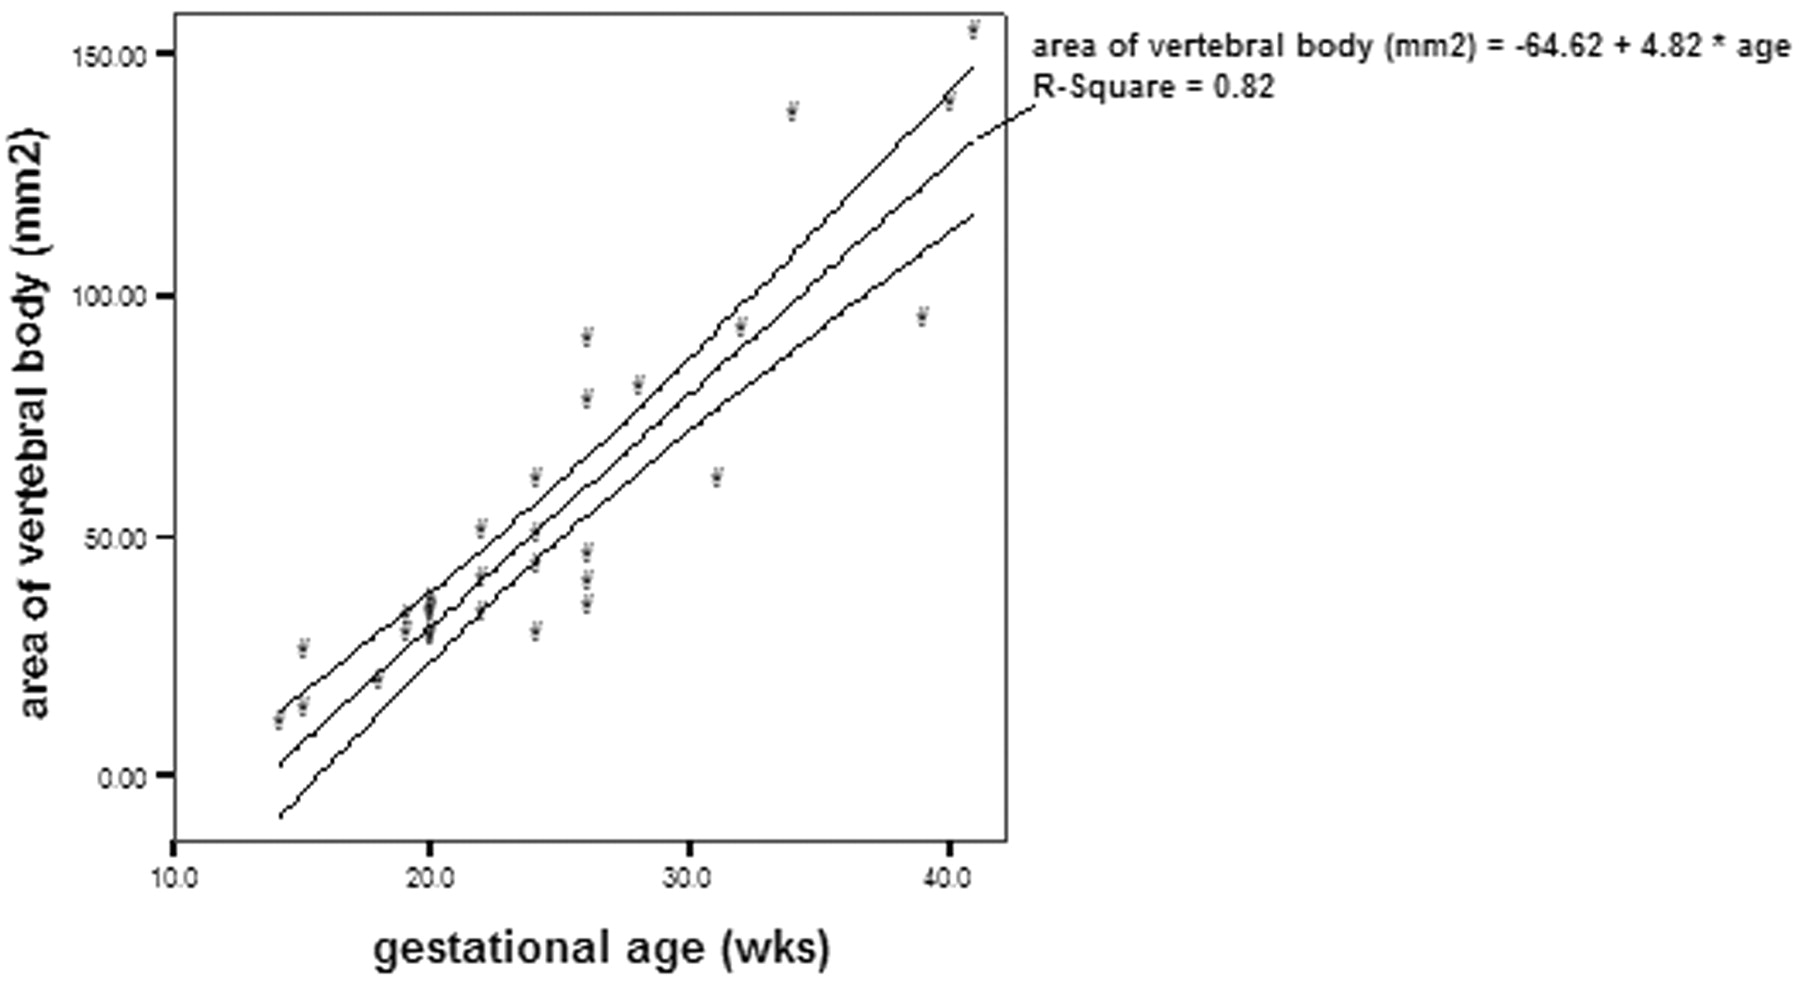
There was a good inter-rater agreement on the measurements of disk height, vertebral body height, area of ossification center of vertebral body, and area of vertebral body. The intraclass correlation coefficient of the disk height was 0.86, vertebral body height was 0.97, area of ossification center of vertebral body was 0.99, and area of vertebral body was 0.99. There was a significant correlation between the disk height and gestational age (r = 0.89; P <.01; Fig 1), as well as vertebral body height and gestational age (r = 0.92; P <.01; Fig 2). The increase in disk height was greater than the increase in vertebral body height with increasing gestation (r = 0.59; P <.01). There was a significant correlation between the area of the ossification center of the vertebral body and the gestational age (r = 0.88; P <.01; Fig 3). There was also a significant correlation between the area of the vertebral body taken at midsection and the gestational age (r = 0.91; P <.01; Fig 4). The proportion of the vertebral body that was ossified increases with increasing gestation (r = 0.79; P <.01; Fig 5). The ossification center of the posterior element was first visualized at the base of the lamina at 18 gestational weeks, and the ossification proceeded posteriorly to the lamina, anteriorly toward the pedicle, and laterally toward the transverse process (Fig 6). When assessed independently, the raters agreed on the level of the conus in 15 fetuses. A consensus agreement on the level of the conus was then made. The conus was not seen in 3 fetuses (one each of 14, 15, and 24 gestational weeks). The lower extent of the conus in the other 27 fetuses is shown in Fig 7. In fetuses <35 gestational weeks, the conus lay anywhere from the L2 to L5 level. In fetuses >35 gestational weeks, the conus lay between L1/2 and L2/3 level (Fig 8).

Disk height and gestational age, demonstrating significant correlation (P <.01) between the 2 parameters.

Vertebral body height and gestational age, demonstrating significant correlation (P <.01) between the 2 parameters.

Area of ossification center of the vertebral body and gestational age, demonstrating significant correlation (P <.01) between the 2 parameters.

Area of the vertebral body taken at midsection of the vertebra and the gestational age, demonstrating significant correlation (P <.01) between the 2 parameters.

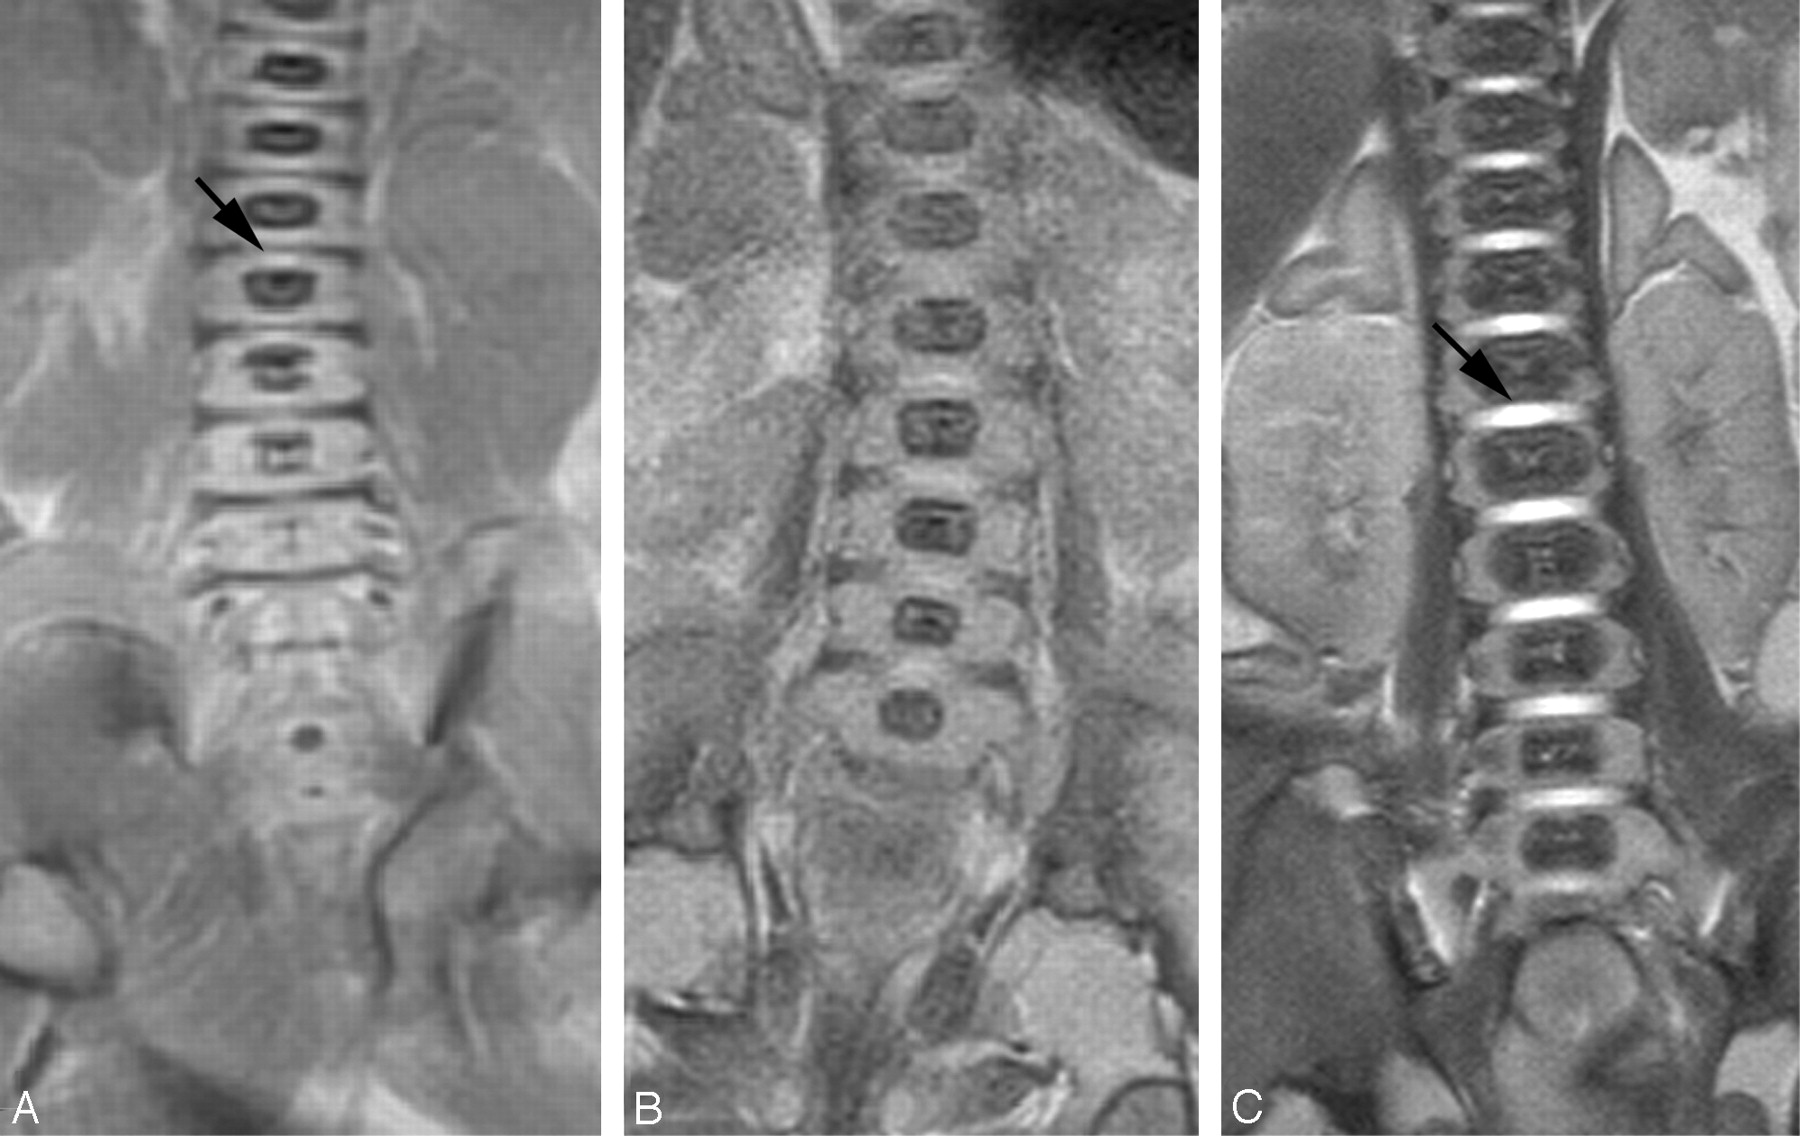
Coronal T2 sequence from (A) 18-week, (B) 22-week, and (C) 40-week fetuses. The disk space appears as a linear low-signal-intensity area in the 18-week fetus (small arrow). High signal intensity is seen in the disk space of the 22-week and 40-week fetuses (large arrow). The disk height and vertebral body increase in size with increasing gestational age. The proportion of the vertebral body that is ossified increases with increasing gestational age.

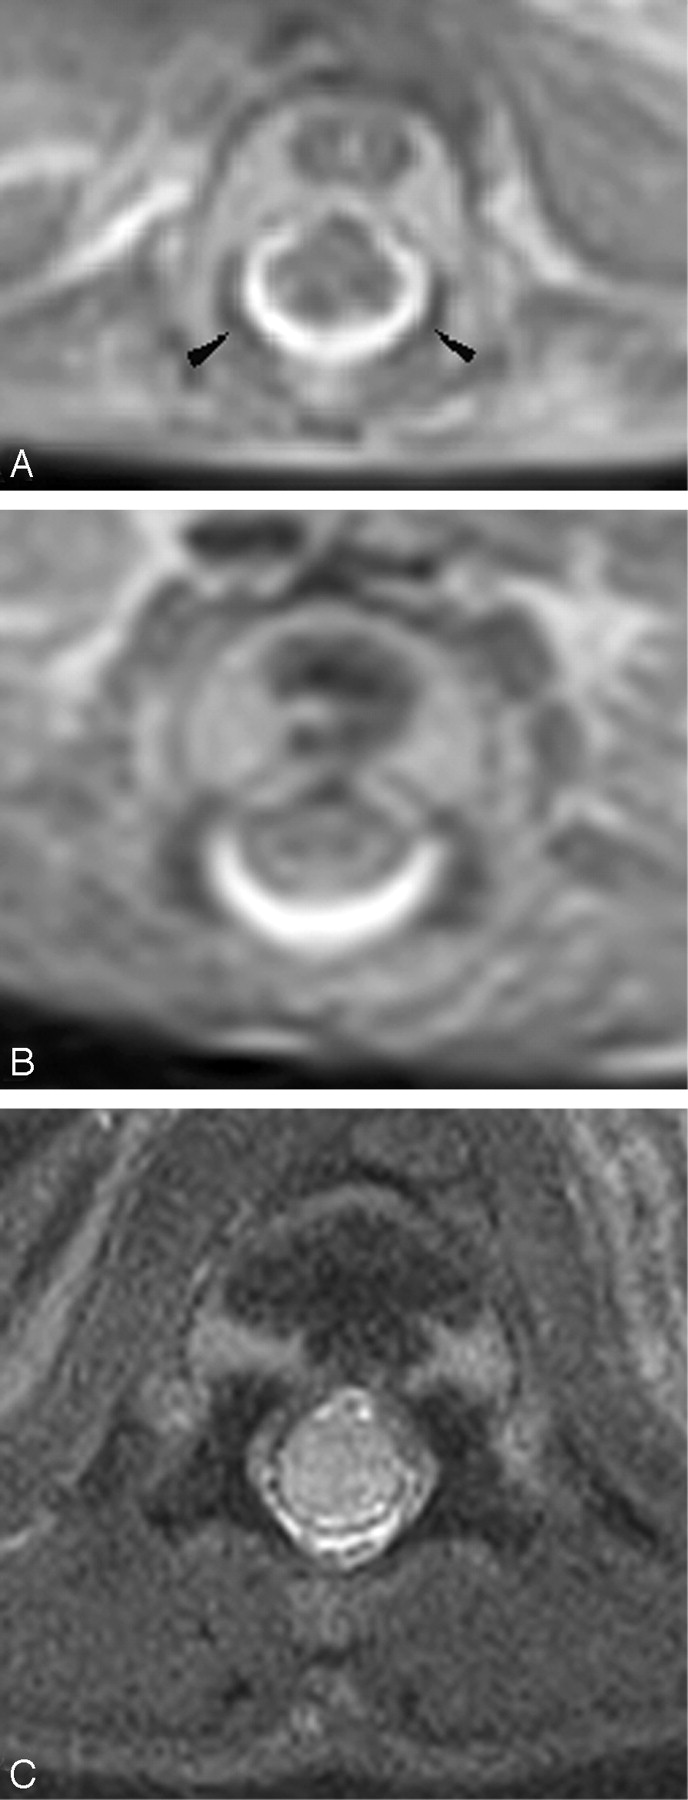
Axial T2 of the spine from (A) 18-week, (B) 22-week, and (C) 41-week fetuses. The ossification centers of the posterior elements are first seen at the base of the lamina (arrowhead). With increasing gestation, ossification is seen to proceed posteriorly to the remaining lamina, anteriorly to the pedicle and posterior aspect of the vertebral body, and laterally to the transverse process.

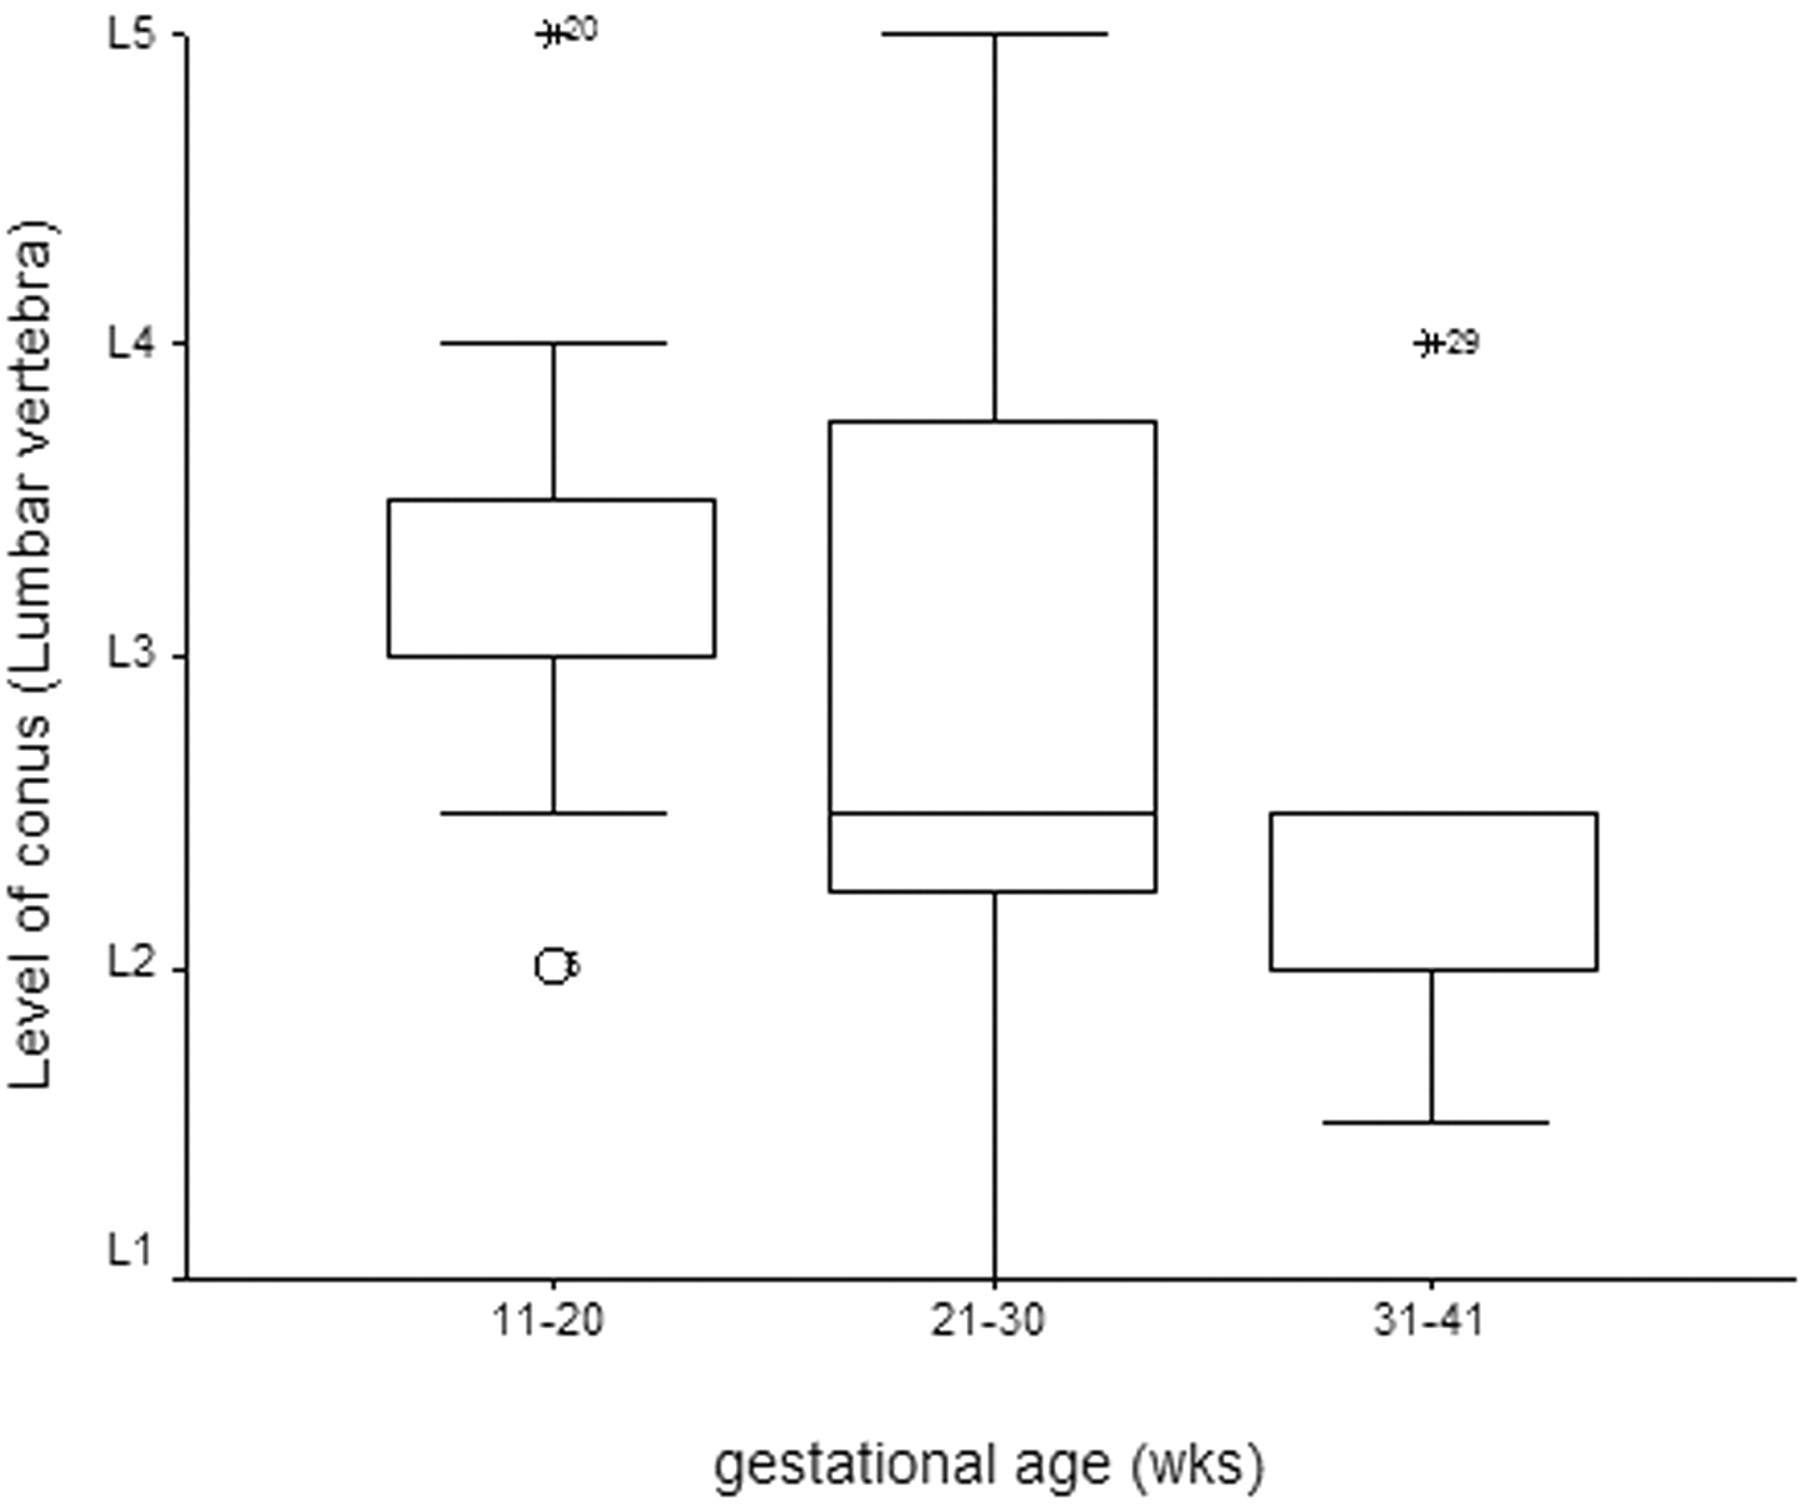
The level of the conus at different gestational age.

Coronal T2 images from (A) 20-week and (B) 40-week fetuses. The conus lies at L4 level in the 20-week fetus and at L2 level in the 40-week fetus.
Discussion
Development of the spine involves 2 components, neural and bony. Development of the vertebral column can be divided into 3 periods. The first of these is membranous development. Toward the end of the third week, 2 longitudinal columns of paraxial mesoderm become segmented into blocks of mesodermal tissue, the somites, which are separated by small intersegmental fissures. Each somite is divided into a medial (sclerotome) and a lateral (dermatomyotome) portion. The medial sclerotome contributes to the formation of the vertebrae, whereas the lateral dermatomyotomes gives rise to the paraspinous musculature and dermis of the skin.6 After the neural tube has closed and become separated from the superficial ectoderm, mesenchyme migrates dorsal to the neural tube to form the precursors of the neural arches.
The second stage of vertebral development is known as chondrification. Each sclerotome consists of loosely arranged cells cranially and densely packed cells caudally. Some densely packed cells move cranially to form the intervertebral disk. The remaining densely packed inferior half of one sclerotome then fuses with the loosely arranged cells in the superior half of the subjacent sclerotome across the fissures to form the centrum, the primordium of the vertebral body. As a result of this resegmentation, the intersegmental arteries and veins become located in the center of the new vertebral bodies. The mesenchymal cells surrounding the neural tube form the vertebral arch. Notochordal remnants that persist between the newly formed vertebral bodies become incorporated into the intervertebral disks as the nuclei pulposi, while the surrounding annulus fibrosis develops from sclerotomal cells. During the sixth week, chondrification centers appear in each mesenchymal vertebra. The 2 centers in each centrum fuse to form a cartilaginous centrum. Concomitantly the centers in the vertebral arches fuse with each other and the centrum. The spinous and transverse processes develop from extensions of chondrification centers in the vertebral arch. Chondrification spreads until a cartilaginous vertebral column is formed.
In the final stage of vertebral development, the chondral skeleton ossifies to complete the formation of the vertebrae. Ossification of typical vertebrae begins during the embryonic period and usually ends by the twenty-fifth year. There are 2 primary ossification centers, ventral and dorsal, for the centrum. These primary ossification centers soon fuse to form one center. Three primary centers are present by the end of the embryonic period, one in the centrum, and one in each half of the vertebral arch. Ossification becomes evident in the vertebral arches during the eighth week on histologic examination. At birth each vertebra consists of 3 bony parts connected by cartilage. The bony halves of the vertebral arch usually fuse during the first 3–5 years. The arches first unite in the lumbar region and union progresses cranially.
The ossification center of the vertebral body is first seen in the lower thoracic and upper lumbar region, which then progress in both cephalic and caudal direction. In contrast, the ossification centers for the posterior neural arch first appear in the upper cervical vertebrae and then progress in cephalocaudal direction.7 Other authors, however, have found that the ossification centers of the posterior neural arch spread from 2 regions, the cervical and the lower thoracic/upper lumbar regions,8,9 rather than from a single region in the cervical region.
In this study, we have chosen the vertebral body height and area of the vertebral body to assess growth of the vertebral body and disk height to assess growth of the disk. These measurements were quick and easy to perform and have good reproducibility. The disk adjacent to the vertebral body was used to assess disk height because the ratio of disk height to vertebral body height allowed comparison of the growth of disk relative to vertebral body. The area of the ossification center in the vertebral body was also measured, because it is important to assess not only the growth of the vertebral body but also the maturation of the vertebral body by determining ossification within the vertebral body. We have attempted to assess objectively the growth of the vertebral body and disk and correlate this with the gestational age. These measurements of the fetal spine could be used in conjunction with biparietal diameter and femur length to assess gestational age.
Previously, knowledge of the spine development has been based predominantly on roentgenographic study.9–11 The thoracic and lumbar spine demonstrated linear growth.12–14 Our study is in agreement with previous studies in that we have demonstrated linear growth of the vertebral body both in terms of height of the vertebral body and area of the vertebral body; however, measurements based on roentgenographic study suffer from magnification and do not distinguish vertebral body growth from disk growth. The measurements made on MR imaging did not have the magnification effect. Moreover, growth of the vertebral body can be assessed separately from growth of the disk space. MR imaging allows visualization of the ossified portion of the vertebrae as well as the cartilaginous portion of the vertebrae. We have found that growth of the disk space was greater than growth of the vertebral body with increasing gestation. This normal phenomenon should not be mistaken for disease process. It is important to separate growth of the vertebrae from growth of the disk because, in diseases such as mucopolysaccharidoses or osteogenesis imperfecta, the vertebrae are of reduced height compared to the disk.
On sonography, the ossification center of the neural arch was visible in the cervical region in all fetuses by 18–19 weeks. The ossification center of the neural arch was first seen in the thoracic region during the 18–19-week period and was consistently demonstrated in the 20–22-week period. In the lumbar and sacral regions ossification was not seen before 19 weeks and was consistently demonstrated in 22–24 weeks.15 We have found that the ossification center of the posterior elements of the lumbar spine can be seen by 18 gestational weeks on postmortem MR imaging. On conventional radiograph, ossification in the neural arch first appears at the base of the transverse process.9 We have found that the ossification center of the neural arch is first seen at the base of the lamina medially. Our study is in agreement with previous roentgenographic findings9–11 in that ossification then proceeds posteriorly to the lamina, anteriorly to the pedicle and the posterior part of the vertebral body, and laterally toward the transverse process. The growth of the vertebrae in male and female fetuses has been assessed together, because of the small number of fetuses studied. Previous studies of the fetal skeletal system have shown that female fetuses mature more rapidly than male fetuses.10,11
Spinal cord formation can be categorized into 3 stages—gastrulation, primary neurulation, and secondary neurulation. Gastrulation involves the formation of mesoderm, resulting in a trilaminar arrangement of the embryonic disk. The primitive streak is formed along the midline of the dorsal surface of the embryo. Hensen’s node forms at the cranial extremity of the primitive streak. Mesodermal cells that migrate along the midline eventually form the notochord. Primary neurulation occurs between the third and fourth gestational week. Interaction between the notocord and the overlying ectoderm results in formation of the neural ectoderm. The neural ectoderm originally is flat, forming a neural plate. The edges of the neural plate are contiguous with the superficial ectoderm. The neural plate bends and folds progressively along the midline to form the neural tube. Neural tube closure is followed by disjunction of the neural ectoderm from the surface ectoderm that will form the skin and subcutaneous tissues. Mesenchyme migrates between the neural and cutaneous ectoderm to form the posterior vertebral elements, muscles, and ligaments. Closure of the neural tube probably begins in the rhombencephalon. It is postulated that progressive folding and closure of the neural structures and separation from ectoderm proceed both cranially and caudally from the point of initial closure, closing the neural tube in both directions.
Secondary neurulation begins after completion of primary neurulation and proceeds until day 48. During secondary neurulation, an additional portion of the neural tube is formed caudally to the posterior neuropore from a mass of cells derived from the caudal portion of the primitive streak. The caudal cell mass is composed of undifferentiated pleuripotent cells that form the tail fold as a result of fusion of the neural epithelium with the notochord. The final stage in the formation of the distal spinal cord begins at about 38 days of gestation, at which time the cell mass and central lumen of the caudal neural tube decrease in size as a result of programmed cell death (apoptosis). The process is termed “retrogressive differentiation.” The secondary neural tube eventually forms the tip of conus medullaris and filum terminale. The conus medullaris contains the terminal ventricle, a remnant of the lumen of the secondary neural tube.
The level of the conus in the fetal spine is quite variable. The normal position of the conus medullaris in neonates and infants has been the subject of debate. Some studies have found that the conus lies at L2/3 level in term neonates and ascends to the adult level at or slightly above the L1/2 level at 2 months to 1 year of life.16,17 Beek et al18 have found that in premature infants (27–29 gestational weeks) the median level of the conus was at L2/3 level, whereas in infants >34 weeks of gestation the conus lie at L1/2 level. A study of 115 autopsies of fetuses and neonates has found that the conus reaches the adult level—that is, lower border of L1 at birth.19 Using sonography to locate the conus, Robbin et al20 reported that the conus in the fetus may lie within the normal adult range. Therefore, refuting the commonly held notion that the conus ascends to adult level sometime in childhood. We had similar findings in that the conus may reach adult level even in some fetuses <35 gestational weeks. Barson has found that the most rapid ascent of the conus occur in young fetuses, when the conus ascends from the fifth cocygeal vertebra around 13 gestational weeks to L4 level at 20 gestational weeks.16 The ascent of the conus is almost complete during the first 2 trimesters of pregnancy.20,21 This finding in this study suggests that, in fetuses >35 weeks, if the conus is lower than L2/3 level, the cord is abnormally low lying.
When the 2 raters evaluated the level of the conus independently, they agreed that the conus could not be seen in 3/30 fetuses. In 12/27 visualized conuses, both raters agreed at the vertebral level of termination. This was due to several factors. First, sagittal and/or axial imaging of the spine was not available in all fetuses, and therefore in some cases the assessment of the level of the conus was based solely on coronal imaging. In clinical practice, it is generally accepted that the level of the conus is best assessed on axial imaging. Second, the significant reduction of CSF around the cord and conus resulted in significant reduction in the ability to resolve the conus from the theca. Third, autolysis may have contributed to reduce contrast of the conus, thereby making it difficult to identify.
Currently, in utero studies of the fetal spine rely primarily on fast T2 imaging to provide structural information. Postmortem MR imaging was based on T2-weighted sequence, because it was anticipated that, in the near future, the in utero MRI findings could be correlated with the postmortem MRI findings. T1-weighted images showed poor tissue contrast, particularly of the central nervous system.3,22 Therefore, the current postmortem MRI study relied on T2 sequence to provide structural information. In the current study, postmortem MR imaging was used to study the fetal spine instead of in utero MR imaging because the in utero MR imaging does not have sufficient resolution to identify the ossification center from the cartilaginous part of the vertebral bodies, and the disk cannot be seen distinct from the vertebral body until the third trimester.
Conclusion
In this relatively small series, we have found that growth of the fetal spine followed a predictable pattern, with linear growth seen in the disks and vertebrae. We have also found that the increase in the disk height is greater than increase in vertebral body height, a finding that should not be confused with pathology. Knowledge of the growth of the spine based on roentgenography is limited to the ossified portion of the spine. Postmortem MR imaging has increased our understanding of the normal growth of the spine, because postmortem MR imaging could assess growth of the ossified portion of the vertebrae as well as the nonossified cartilaginous portion of the vertebrae and disks. Knowledge of the normal growth of the spine and the changes in the signal intensity of the disk are essential before studying the abnormal spine.
References
- Received April 20, 2005.
- Accepted after revision August 2, 2005.
- Copyright © American Society of Neuroradiology
In this issue


Jump to section
Related Articles
Cited By...
- No citing articles found.