
Abstract
BACKGROUND AND PURPOSE: Accurate differentiation of paragangliomas and schwannomas in the jugular foramen has important clinical implications because treatment strategies may vary but differentiation is not always straightforward with conventional imaging. Our aim was to evaluate the accuracy of both qualitative and quantitative metrics derived from dynamic contrast-enhanced MR imaging using golden-angle radial sparse parallel MR imaging to differentiate paragangliomas and schwannomas in the jugular foramen.
MATERIALS AND METHODS: A retrospective study of imaging data was performed on patients (n = 30) undergoing MR imaging for jugular foramen masses with the golden-angle radial sparse parallel MR imaging technique. Imaging data were postprocessed to obtain time-intensity curves and quantitative parameters. Data were normalized to the dural venous sinus for relevant parameters and analyzed for statistical significance using a Student t test. A univariate logistic model was created with a binary output, paraganglioma or schwannoma, using a wash-in rate as a variable. Additionally, lesions were clustered on the basis of the wash-in rate and washout rate using a 3-nearest neighbors method.
RESULTS: There were 22 paragangliomas and 8 schwannomas. All paragangliomas demonstrated a type 3 time-intensity curve, and all schwannomas demonstrated a type 1 time-intensity curve. There was a statistically significant difference between paragangliomas and schwannomas when comparing their values for area under the curve, peak enhancement, wash-in rate, and washout rate. A univariate logistic model with a binary output (paraganglioma or schwannoma) using wash-in rate as a variable was able to correctly predict all observed lesions (P < .001). All 30 lesions were classified correctly by using a 3-nearest neighbors method.
CONCLUSIONS: Paragangliomas at the jugular foramen can be reliably differentiated from schwannomas using golden-angle radial sparse parallel MR imaging–dynamic contrast-enhanced imaging when imaging characteristics cannot suffice.
ABBREVIATIONS:
- AUC
- area under the curve
- DCE
- dynamic contrast-enhanced
- EES
- extravascular extracellular space
- GRASP
- golden-angle radial sparse parallel
- Kep
- rate transfer constant
- Ktrans
- volume transfer constant
- SER
- signal-enhancement ratio
- 3-NN
- 3-nearest neighbors
- TIC
- time-intensity curve
- TME
- time-to-maximum enhancement
- Ve
- extravascular extracellular space plasma volume fraction
- Vp
- plasma volume fraction
Lesions of the jugular foramen are relatively uncommon but can be encountered on routine imaging with some regularity.1,2 Differential considerations for lesions intrinsic to this area can be extensive; however, schwannomas and paragangliomas are 2 of the most frequently encountered primary neoplasms in this location.2,3 Conventional imaging can sometimes distinguish the 2 lesions because each can have characteristic features. Typical imaging characteristics of paragangliomas include permeative osseous erosion, intense contrast enhancement, as well as a “salt and pepper” appearance on T1-weighted images due to subacute hemorrhage visualized as “salt” and hypointense flow voids as “pepper.”2,3 Schwannomas typically demonstrate smooth osseous remodeling, may have more homogeneous signal characteristics, and also generally demonstrate avid enhancement.2⇓-4 However, many lesions do not demonstrate a “typical” appearance, particularly when smaller, when bony changes and signal characteristics may be more difficult to appreciate. Smaller paragangliomas do not always demonstrate a salt and pepper appearance, and schwannomas can also demonstrate heterogeneous T1 and T2 signal characteristics due to cystic or fatty degeneration.5⇓-7 Similarly, osseous changes may not yet be readily appreciable, particularly on MR imaging.
Accurate differentiation of the 2 lesions has important clinical implications because treatment strategies may vary.1,8 While both lesions can, in some cases, be surgically resected, stereotactic radiosurgery plays an increasingly important role in the treatment strategy.9 Additional treatment and clinical decisions such as appropriate surveillance strategies, the need for adjunct endovascular embolization, genetic testing, and evaluation for additional lesions can all depend on the diagnosis. Tissue sampling in this region is challenging and carries its own set of risks due to the multiple neurovascular structures traversing this area, and histologic diagnosis may not be available in patients undergoing a nonoperative treatment strategy. Therefore, imaging plays an important role in diagnosis; however, conventional imaging can have limitations in distinguishing the 2 lesions.
Golden-angle radial sparse parallel (GRASP) MR imaging is a volumetric dynamic imaging technique that uses 3D gradient recalled-echo dynamic contrast-enhancement (DCE) imaging together with compressed sensing and parallel imaging to accelerate data acquisition.10 GRASP MR imaging samples k-space radially in the xy-plane using a golden-angle scheme with Cartesian sampling in the z-plane.10 Dynamic data are obtained in a single continuous acquisition after contrast injection and are reconstructed into sequential timeframes using an iterative method that permits excellent spatial and temporal resolution. GRASP MR imaging has been shown to have applications in abdominal, breast, and other head and neck lesions.11⇓⇓⇓⇓⇓-17 In particular, a recent study demonstrated the utility of GRASP MR imaging to differentiate parotid neoplasms, in particular with a high negative predictive value for malignant lesions.18
The purpose of this study was to evaluate the accuracy of both qualitative and quantitative metrics derived from DCE MR imaging using GRASP MR imaging to differentiate paragangliomas and schwannomas in the jugular foramen. Prior work has been done by Gaddikeri et al19 to differentiate schwannomas and paragangliomas using DCE MR imaging, and Demerath et al20 have applied GRASP MR imaging to the same problem, but our study focused on applying GRASP MR imaging to lesions strictly within the jugular foramen, a region not readily amenable to tissue sampling.
MATERIALS AND METHODS
Patient Selection
This retrospective study of patient data received approval from academic center's institutional review board, and the requirement for informed consent was waived. Health Insurance Portability and Accountability Act–compliant techniques for data management and analysis were used.
From August 2017 through April 2019, DCE MR imaging using the GRASP technique was performed on 35 consecutive patients with jugular foramen masses. The mean patient age was 49.5 years with a range of 26–79 years. There were 16 men and 19 women. Five patients were excluded due to the following: failed GRASP examination (n = 2), dural arteriovenous fistula (n = 1), meningioma (n = 1), and lymph node (n = 1). A total of 30 skull base lesions were ultimately included. None of the included lesions had undergone an operation at the time of imaging. The excluded dural arteriovenous fistula was not associated with a mass and was diagnosed with a conventional angiogram. The excluded lymph node was an incidental retropharyngeal lymph node, which was included in the results during the initial search for jugular foramen masses and did not have anything to do with metastatic paraganglioma.
GRASP DCE MR Imaging Technique
An in-depth description of the GRASP protocol for DCE MR imaging has been previously reported.10 In summary, GRASP MR imaging acquires data continuously in the k-space in a radial fashion using a golden-angle scheme during contrast injection. The dynamic acquisition can be obtained to any desired length. Timeframes of any desired length can be obtained by grouping consecutive radial spokes into discrete temporal units. GRASP MR imaging can achieve high temporal resolution due to high undersampling, using both parallel imaging and compressed sensing in the reconstruction process.
Patients were scanned on both 1.5T and 3T MR imaging scanners. Each timeframe had 120 axial sections at a 2-mm section thickness. The FOV was 256 × 256 mm, and the matrix size was 256 × 256, resulting in a 1-mm in-plane resolution. Anatomic coverage comprised the whole neck from the superior orbit to the sternal notch. TR and TE were 3.65 and 1.75 ms, respectively, with a 12° flip angle. Temporal resolution was 5.5 s/frame for the first 67.3 seconds and 13.0 s/frame through the remainder of the examination for a total dynamic acquisition of 240 seconds. A single dose of gadobutrol (0.1 mL/kg, Gadavist; Bayer Schering Pharma) was administered intravenously at a rate of 3 mL/s via a power injector 20 seconds after the start of the GRASP sequence.
Qualitative and Quantitative Time-Intensity Curve Analysis
All DCE MR imaging data were postprocessed and analyzed using Olea Sphere 3.0 software (Olea Medical). The reader was blinded to the clinical history, pathologic diagnosis if available, and all prior and subsequent imaging studies. A single ROI was created within each lesion on axial images, taking care to inscribe only the enhancing component and to avoid nonenhancing portions. An additional ROI was created in a normal-appearing dominant ipsilateral or contralateral sigmoid sinus to serve as an internal reference standard, taking care to avoid mistaking enhancing tumor for the sigmoid sinus and vice versa, especially when the tumor was large. No invasion or thrombosis of the sigmoid sinus was seen. Time-intensity curves (TICs) were created for each ROI and qualitatively assigned 1 of 3 TIC classifications:18 1) continuously rising, 2) initial rapid wash-in with a subsequent plateau, and 3) initial rapid wash-in with subsequent washout.
Semiquantitative TIC metrics obtained for the lesion included peak signal intensity, wash-in rate, washout rate, and area under the curve (AUC), which were normalized to values obtained from the reference ROI in the sigmoid sinus. The AUC was calculated by Olea Sphere for the entire duration of the scan. A subset analysis of paragangliomas was later performed comparing those with prior radiation treatment with those with no prior radiation treatment.
Statistical Methods
Categoric data were summarized by frequencies and percentages, and continuous scaled data were summarized by the mean (SD) of the empiric distribution.
Raw data output from the Olea Sphere software included time-to-maximum enhancement (TME), AUC, wash-in rate (wash-in), washout rate (washout), peak signal intensity, extracellular extravascular space volume fraction (Ve), maximum signal-enhancement ratio (SER), rate transfer constant (Kep), plasma volume fraction (Vp), and volume transfer constant (Ktrans). AUC, TME, wash-in, washout, and peak intensity were all normalized to a control ROI placed in the sigmoid sinus.
A Student t test was used to determine whether the 2 sets of data containing paragangliomas and schwannomas were similar (null hypothesis) or different from each other. A 2-tailed t test was used, assuming 2 sample sets of unequal variance for each parameter. Similar analysis was performed between subgroups of paragangliomas: those without prior radiation (n = 13) and those with prior radiation (n = 9).
Using SPSS (Version 16.0; IBM), we created a univariable logistic regression model with a binary output, paraganglioma or schwannoma, using wash-in as a single input variable. This univariate model was evaluated on the basis of a type III χ2 test.
Additionally, by means of SPSS, lesions were classified on the basis of wash-in and washout using a 3-nearest neighbors (3-NN) method. This method plots all the data points according to input values, wash-in and washout in this case; then for each data point, it assigns a classification, either paraganglioma or schwannoma, based on a weighted score of its 3 nearest data points. Several studies in the field of radiology have demonstrated the utility of using classification schemes such as the nearest neighbors method to classify masses or patterns of abnormality in both the brain and lungs.21⇓-23
RESULTS
There were 22 paragangliomas and 8 schwannomas. Pathologic diagnosis was available in 16 of 22 paragangliomas and 4 of 8 schwannomas. Diagnosis of the remaining lesions was made on the basis of conventional imaging features.
Table 1 demonstrates an overview of quantitative summary statistics. The mean patient age was 43.7 years for the schwannoma group and 52.0 years for the paraganglioma group without a significant difference. Thirty-three percent of the patients with schwannoma and 77% of the patients with paraganglioma were women. A χ2 test demonstrated a significant difference between the 2 groups in terms of sex. While there is no documented sex predilection for schwannomas, there is a known female predilection for paragangliomas of the head and neck, which may explain the high proportion of women in our paraganglioma cohort.24
Quantitative summary statistics for paragangliomas and schwannomasa
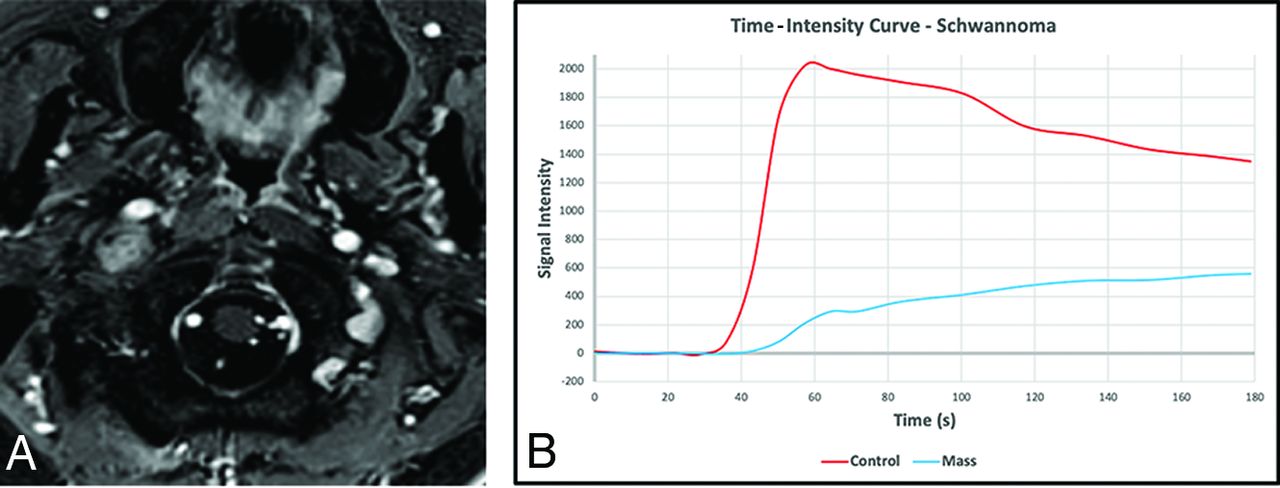
All paragangliomas demonstrated a type 3 TIC: initial rapid wash-in with subsequent washout (Fig 1), and all schwannomas demonstrated a type 1 TIC: continuously rising (Fig 2). There were no cases that demonstrated the type 2 TIC.

Example of a paraganglioma in the right jugular foramen on postcontrast imaging (A) with an associated time-intensity curve (B) demonstrating a type 3 TIC (blue) with wash-in and washout characteristics similar to those in the blood pool control obtained from the sigmoid sinus (red).

An example of a schwannoma in the right jugular foramen extending inferiorly into the carotid space on postcontrast imaging with an associated time-intensity curve demonstrating a type 1 TIC (blue) with gradual wash-in and a continuous gradual washout of contrast. The curve obtained from the blood pool within the sigmoid sinus (red) shows the expected rapid wash-in and washout of contrast, suggesting a good bolus of administered contrast.
Results comparing the means (SDs) of quantitative DCE parameters for both paragangliomas and schwannomas are shown in Tables 2 and 3.There was a statistically significant difference between paragangliomas and schwannomas for AUC, peak intensity, TME, wash-in, washout, Ve, SER, and Vp.
Semiquantitative perfusion metrics of jugular foramen tumors normalized to the sigmoid sinusa
Kinetic permeability metrics of jugular foramen tumorsa
A univariable logistic regression model was created with a binary output (paraganglioma or schwannoma) using wash-in as a single input variable. This simple model was able to correctly predict all observed lesions (P < .001).
Lesions were clustered on the basis of wash-in and washout using a 3-NN method. All 30 lesions (22 paragangliomas and 8 schwannomas) were classified correctly using this method (Fig 3). Last, a subgroup comparison of paragangliomas was performed between those with prior radiation treatment and those without in Tables 4 and 5. There was no statistically significant difference between the 2 groups when comparing them across all parameters.

A, The predictor space model clearly shows differential group clustering for schwannomas and paragangliomas based on the wash-in and washout measures. B, The predictor space model clearly shows differential group clustering for schwannomas and paragangliomas based on the wash-in and washout measures. P indicates paraganglioma; S, schwannoma.
Subgroup comparison of paragangliomas with prior radiation treatment (n = 9) and with no radiation treatment (n = 13) using normalized semiquantitative perfusion metricsa
Subgroup comparison of paragangliomas with prior radiation treatment (n = 9) and with no radiation treatment (n = 13) using kinetic permeability metricsa
DISCUSSION
This study evaluated the utility of GRASP DCE to differentiate paragangliomas and schwannomas at the jugular foramen. Our work demonstrates that by means of DCE postprocessing software, there are specific TIC curves for each lesion, allowing reliable lesion differentiation based on imaging. This may, in the future, preclude the need for a biopsy in certain clinical situations.
Prior studies from Gaddikeri19 et al and Demerath et al20 have studied the use of DCE to differentiate these lesions, with the latter also using GRASP. However, we included a larger number of lesions compared with both of the above studies and focused on evaluating lesions only within the jugular foramen.
Our work, in concordance with the abovementioned studies, demonstrates that paragangliomas have a type 3 TIC: a sharp wash-in and peak followed by slow washout, similar to that of the venous blood pool. This is in accordance with the physiologic structure of paragangliomas, which have a rich network of highly vascularized fibrous septa and an attenuated vessel network, resulting in arteriovenous shunting.25,26 This also explains why paragangliomas demonstrated earlier TME than schwannomas and appeared similar to the venous blood pool. Schwannomas, on the other hand, demonstrate type 1 TICs: a rapid initial wash-in phase followed by continued, albeit slower wash-in of contrast without washout. This accumulation of contrast in schwannomas has been attributed to the vascular proliferation of small, thin-walled vessels and larger, hyalinized vessels, which increases permeability, allowing contrast to progressively enter the extravascular extracellular space (EES).27
Our qualitative findings are corroborated by semiquantitative parameters, which were normalized to a control (dural venous sinus). AUC, peak enhancement, wash-in, and washout in paragangliomas were shown to be very similar to those in the venous blood pool, whereas in schwannomas, there was a much lower AUC and peak enhancement, as well as slower wash-in and washout velocities. Additionally, there was excellent classification of these lesions solely using wash-in and washout with a 3-NN method.
Kinetic parameters based on the Tofts model also provided insight into the different vascular structures of these 2 lesions, similar to those demonstrated by prior studies.26 For example, the Ve, synonymous with the EES, was much lower for paragangliomas because most contrast volume in these lesions is expected to remain within the blood plasma with poor perfusion into the tumor tissue.28 Given the high-flow, vascular nature of these lesions with arteriovenous shunting, there may not be enough time for contrast to enter the EES. Conversely, the Vp was much lower for schwannomas because most contrast volume is located in the EES rather than in blood plasma due to a microvascular network, which more freely permits tumor tissue perfusion.
The SER was also significantly higher for paragangliomas compared with schwannomas, reflecting their marked relative contrast uptake and, therefore, larger difference between precontrast signal intensity and maximal signal intensity. The Ktrans and Kep, the volume and rate transfer constants, respectively, between the EES and blood plasma, were not significantly different between the 2 lesions. This finding may be related to the faster wash-in and washout velocities seen with paragangliomas, which may not permit enough time for contrast to enter the EES from the blood plasma.
Comparison between paragangliomas that underwent prior radiation treatment versus those that did not yielded somewhat surprising results. There was no statistically significant difference between these 2 groups across all semiquantitative and kinetic parameters. This finding may be due to the mechanism of the action of radiation, which treats tumors by damaging DNA at the molecular level to induce cell death rather than damaging the macrostructure of a lesion, which is depicted by imaging.
One limitation of this subgroup analysis was the small sample size and follow-up. Treated paragangliomas with follow-up did not demonstrate interval growth, but only a small subset of these tumors had follow-up. Specifically, a small sample size limits how much we can confidently say about postradiation effects.
While our study demonstrates that GRASP DCE can differentiate paragangliomas and schwannomas in the jugular foramen when conventional imaging findings are not present, there are still some clear limitations. First, our sample size of schwannomas was relatively small compared with the number of paragangliomas. Additionally, histologic confirmation of pathology was not available in every case in part due to the inherent risks of an operation in this location. When pathology was not available, diagnosis was made on the basis of conventional imaging features.
CONCLUSIONS
Paragangliomas and schwannomas at the jugular foramen can frequently be distinguished on the basis of characteristic imaging features. However, occasionally lesions may be more difficult to differentiate, particularly when small, and histologic sampling in this location is particularly challenging given the critical neurovascular structures passing through this region. Our study adds further evidence that paragangliomas at the jugular foramen can be reliably differentiated from schwannomas using GRASP DCE imaging. This may, in the future, obviate the need for histologic sampling or may add increased confidence and reliability when diagnosis is made presumptively.
Footnotes
Disclosures: Oded Gonen—UNRELATED: Employment: New York University School of Medicine.
References
- Received January 10, 2021.
- Accepted after revision May 7, 2021.
- © 2021 by American Journal of Neuroradiology


Jump to section
Related Articles
Cited By...
- No citing articles found.