
Abstract
BACKGROUND AND PURPOSE: Growth of subependymal giant cell tumor and subependymal nodules has not been well-characterized. The purpose of this study was to determine whether growth curves can differentiate subependymal giant cell tumors from subependymal nodules.
MATERIALS AND METHODS: Brain MR imaging of patients with tuberous sclerosis complex were retrospectively reviewed from 2002 to 2018. All lesions in the region of the foramen of Monro were measured. Lesions were categorized on the basis of maximal diameter at the most recent scan: small lesions (<1 cm), indeterminate lesions (>1 cm), and resected lesions (>1 cm and surgically resected). Growth velocity and acceleration on serial imaging were analyzed, and growth rates were calculated between 0 and 20 years of age and compared among the 3 categories.
RESULTS: Forty-one patients were analyzed. The average age at the earliest scan was 5.9 (SD = 5.7) years. One hundred twenty-six small, 27 indeterminate, and 10 resected lesions were measured. Subependymal giant cell tumors grew faster than indeterminate lesions between 6 and 15 years of age. Indeterminate lesions grew faster than small lesions at 0–10 years of age. Resected lesions showed increased velocity and acceleration of growth compared with indeterminate lesions and small lesions on serial imaging.
CONCLUSIONS: Growth differentiates subependymal nodules and subependymal giant cell tumors within the first 20 years of life, and the use of velocity and acceleration of growth may refine the diagnostic criteria of subependymal giant cell tumors. Additionally, 6–15 years of age may be an important period to monitor subependymal giant cell tumors at the foramen of Monro because increased growth may help to identify subependymal giant cell tumors that will continue to grow and result in obstructive hydrocephalus.
ABBREVIATIONS:
- AP
- anterior-posterior
- FOM
- foramen of Monro
- IQR
- interquartile range
- SEGA
- subependymal giant cell astrocytoma
- SEN
- subependymal nodule
- SGCT
- subependymal giant cell tumor
- SI
- superior-inferior
- TSC
- tuberous sclerosis complex
- TV
- transverse
Tuberous sclerosis complex (TSC) is an autosomal dominant disorder caused by a mutation in the TSC1-TSC2 complex.1 Brain lesions of TSC include subependymal nodules (SENs) and subependymal giant cell tumors (SGCTs), also known as subependymal giant cell astrocytoma (SEGA).2 Approximately 24% of patients with TSC develop SGCTs, and 88%–95% develop SENs.2,3
SGCTs are slow-growing World Health Organization grade I tumors that usually grow near the foramen of Monro (FOM) and can obstruct the flow of CSF leading to increased morbidity and mortality.2,4,5 SGCTs occur in the same locale as SENs; however, SENs typically remain stable and are not associated with a risk of obstructive hydrocephalus.3 Currently, consensus guidelines suggest that surveillance with MR imaging be performed every 1–3 years in patients with TSC to monitor for the development of SGCTs because they are a cause for obstructive hydrocephalus.6
SGCTs can arise from SENs and are histologically indistinguishable.2,7 Similarly, MR imaging does not provide a reliable biomarker for the distinction of early SGCTs from SENs. SGCTs and SENs are differentiated by maximal diameter and growth.6 Consensus guidelines define SGCTs as lesions ≥1 cm in maximum diameter at the caudothalamic groove or a lesion at any location that has shown growth on consecutive imaging.6 Growth patterns of SGCTs and SENs have not been well-characterized in the medical literature.3 The purpose of our study was to characterize the growth of SENs and SGCTs in the region of the FOM and to determine whether growth curves can differentiate SGCTs from SENs.
MATERIALS AND METHODS
Standard Protocol Approvals and Inclusion Criteria
This study was approved by the institutional review board. Patient data were retrospectively reviewed and de-identified, and storage was encrypted and password-protected. The need for written consent was waived.
We retrospectively reviewed the clinical and imaging medical records of patients with TSC seen at our institution between 2002 and 2018.
Inclusion criteria were the following: 1) confirmed diagnosis of TSC by consensus criteria8 or by genetic testing; 2) at least 3 serial MRIs, including 3D Brain Volume Imaging (BRAVO; GE Healthcare), MPRAGE, and spoiled gradient echo; 3) earliest MR imaging obtained before 20 years of age; and 4) radiologic evidence of SGCTs and/or SENs. For all patients who eventually underwent surgical resection for an SGCT, at least 3 preoperative MRIs had to span at least a 1.5- year surveillance period. For the non-SGCT group, at least 3 MRIs had to span at least a 5-year surveillance period; a longer surveillance period was beneficial to ensure that the nodules did not eventually grow into SGCTs. Exclusion criteria were the following: 1) treatment with mechanistic target of rapamycin inhibitors during the surveillance period, 2) surgical resection of an SGCT before the surveillance period, and 3) nondiagnostic MRIs.
Clinical Data
The clinical records were reviewed for age at earliest MR imaging, sex, genetic testing, and age at surgical resection.
Imaging Data
All nodules at the FOM, small lesions, indeterminate lesions, and resected lesions, were measured from all available brain MRIs. A single researcher (J.R.B.) performed all measurements. The senior neuroradiologist (P.C.) with 17 years' postfellowship experience trained a researcher (J.R.B.) on an initial training data set of 20 MRIs. The research assistant then performed all remaining measurements, and for certain cases when they were in question, the measurements were reviewed and confirmed for accuracy by P.C. The senior neuroradiologist measured 10 nodules in 10 patients independently, and the interreader reliability was calculated using the intraclass correlation coefficient. The intraclass correlation coefficients for anterior-posterior (AP), superior-inferior (SI), and transverse (TV) measurements were 0.94, 0.97, and 0.93, respectively.
All measurements were made using the available T1 volumetric sequence for each MR imaging study date with a BRAVO, MPRAGE, or echo-spoiled gradient echo sequence. The T1 volumetric sequence was brought up in a 3D viewer in the institutional PACS, and the axial, coronal, and sagittal reformats were simultaneously displayed. The AP, TV, and SI measurements were performed.
Imaging Parameters
Parameters for the volumetric T1 sequences were as follows: For the echo-spoiled gradient echo sequence (n = 110), the parameters were section thickness = 1 mm, gap = 0 mm, TR = 74 ms, TE = 7 ms, phase = 190–220, frequency = 190–220, number of excitations 1 and FOV = 190–220 × 190–220 mm. For the BRAVO sequence (n = 1), the parameters were section thickness = 1 mm, gap = 0 mm, TR = 74 ms, TE = 6.508 ms, phase = 260, frequency = 260, number of excitations 1 and FOV = 260 mm. For the MPRAGE sequence (n = 160), the parameters were thickness = 1 mm, gap = 0 mm, TR = 2530 ms, TE = 2530 ms, phase = 192–256, frequency = 192–256, number of excitations 1 and FOV = 192–256 × 192–256 mm.
Lesion Categorization
Lesions were retrospectively categorized using the measurements obtained on the most recent MR imaging during the surveillance period. Small lesions were defined as lesions <1 cm in maximum diameter and may be considered terminologically per the consensus guidelines as synonymous with SENs.6 Indeterminate lesions were defined as lesions >1 cm in maximum diameter but that never required surgical resection during the surveillance period or at any time point according to the medical records; such lesions are traditionally termed SGCTs.6 Resected lesions were defined as lesions of >1 cm in maximum diameter, which were surgically resected for an indication of obstructive hydrocephalus, and this term may be considered as synonymous with resected SGCTs.6
Volume Calculation and Evaluation
Volume was calculated assuming that the lesion was ellipsoid: [Volume = 4/3π (A/2)(B/2)(C/2)], where A, B, and C are the maximum dimensions of the lesion measured in 3 perpendicular planes. The volumes of the nodules were calculated on every MR imaging measured during the surveillance period.
Growth Evaluation
The available MRIs for each patient were grouped into 4 age periods: 0–5, 6–10, 11–15, and 16–20 years of age. The first and last volume measurements were taken from each age period, and the following equation was applied to determine growth rate: (Volume at Most Recent Scan – Volume at Earliest Scan) / (Age at Most Recent Scan – Age at Earliest Scan) = Growth Velocity (mm3/year). The median growth velocity and interquartile range (IQR) for each age period were calculated. This approach was then subdivided for each type of lesion (small lesions, indeterminate lesions, and resected lesions). Additionally, the percentage of lesions with growth velocity >4.2 mm3/year in a given age period was calculated; 4.2 mm3 was chosen to reflect an increase in growth of 2 mm in the AP, TV, and SI dimensions using an ellipsoid volume formula.
Finally, growth velocity was found between each MR imaging for small lesions, indeterminate lesions, and resected lesions using the equation (Volume at MR Imaging – Volume of Previous MR Imaging) / (Age at MR Imaging – Age at Previous MR Imaging) = Growth Velocity (mm3/Year). Acceleration of growth was then calculated using the formula (Growth Velocity – Previous Growth Velocity) / (Age at MR Imaging – Age at Previous MR Imaging) = Acceleration of Growth (mm3/year2). The median and IQR for growth velocity and acceleration were calculated.
Statistical Analysis
Statistical analysis was conducted using GraphPad Prism software, Version 9 (GraphPad Software). All statistical analyses were conducted with an α of .05. Normality was tested by the D'Agostino-Pearson test. Nonparametric tests were used to compare data that were determined to have a non-normal distribution, and for this data medians with IQRs were reported.
A 2-tailed Mann-Whitney U test was used to evaluate volumes of resected lesions and indeterminate lesions at baseline and the most recent scan. A Kruskal-Wallis test was used to compare growth velocity of all lesions, small lesions, indeterminate lesions, and resected lesions at 0–5, 6–10, 11–15, and 16–20 years of age. Additionally, the following comparisons were made within each age period using a 2-tailed Mann-Whitney U test with a Bonferroni correction: 1) resected lesions versus indeterminate lesions, 2) resected lesions versus small lesions, 3) small lesions versus indeterminate lesions, and 4) small lesions and indeterminate lesions versus resected lesions. For the 0–5, 6–10, and 11–15 years of age periods, 4 comparisons were made. Each P value calculated within these periods was multiplied by 4. A comparison of growth velocity and acceleration on serial imaging was made using a 2-tailed Mann-Whitney U test with a Bonferroni correction to compare all lesion groups. Three comparisons were made for acceleration and velocity. Each P value was multiplied by 3. Finally, a mixed-effects analysis was performed to analyze the interactions between lesion type and age period (0–5, 6–10, 11–15, and 16–20 years of age) on growth velocity. Growth velocity was defined as the dependent variable, and lesion type and age period (0–5, 6–10, 11–15, and 16–20 years) were independent variables with an interaction term between them. Within-subject repeated measurements were accounted for using subject-level random effects.
RESULTS
Clinical Data
Forty-one participants who met the inclusion and exclusion criteria were analyzed. The average age of patients at the earliest MR imaging was 5.9 years of age (range, 0.3–19.2 years of age). Twenty-six patients were female, and 15 were male. Twenty had a TSC2 mutation, 14 had TSC1 mutation, 2 had no mutation identified, and 5 were not tested. Seven patients had SGCT resection for an indication of hydrocephalus (Online Supplemental Data). The average age at surgical resection was 13.2 years (range, 2–25.2 years).
Imaging Data
A total of 271 MRIs were analyzed. The average number of MRIs per patient was 6.8 (SD, 2.8). The average time between the earliest and most recent MR imaging was 9 (SD 3.9) years. The average time between MRIs was 1.6 (SD 1.0) years (Online Supplemental Data).
Lesion Categorization
We measured a total of 163 nodules at the FOM: 126 small lesions, 27 indeterminate lesions, and 10 resected lesions. Seven small lesions and 1 resected lesion appeared new—that is, not seen on an earlier MR imaging but appearing on a later MR imaging, in which this interval appearance might, however, have been attributable to technical factors. Of the 7 patients who underwent surgical resection for an indication of obstructive hydrocephalus, 3 had 2 clearly distinct nodules at the FOM and thus were analyzed for growth separately, yielding 10 resected lesions. Examples of serial imaging of a resected lesion and indeterminate lesion can be seen in Fig 1.

Serial images of patient 11's resected lesion located in the region of the right foramen of Monro (A–C) and patient 2's indeterminate lesion located in the region of left foramen of Monro (D–F). Patient 11's lesion was resected at 16 years of age. The arrows point to the lesion of interest. Cubic measurements are as follows: (AP × TV × SI), A, 9.6 mm × 8.8 mm × 10.6 mm; B, 16.1 mm × 15.9 mm × 16.3 mm; C, 21.5 mm × 16.5 mm × 19.3 mm; D, 10.4 mm × 9.2 mm × 11.2 mm; E, 10.5 mm × 9.5 mm × 11.7 mm; F, 10.4 mm × 9.5 mm × 11.9 mm.
The average number of lesions measured per patient was 4 (SD, 2.8). The average number of small lesions per patient with at least 1 small lesion measured was 3.5 (SD, 2.5). The average number of indeterminate lesions per patient with at least 1 indeterminate lesion measured was 1.5 (SD, 0.8). The average number of resected lesions per patient with at least 1 resected lesion measured was 1.4 (SD, 3.3).
Volume Evaluation
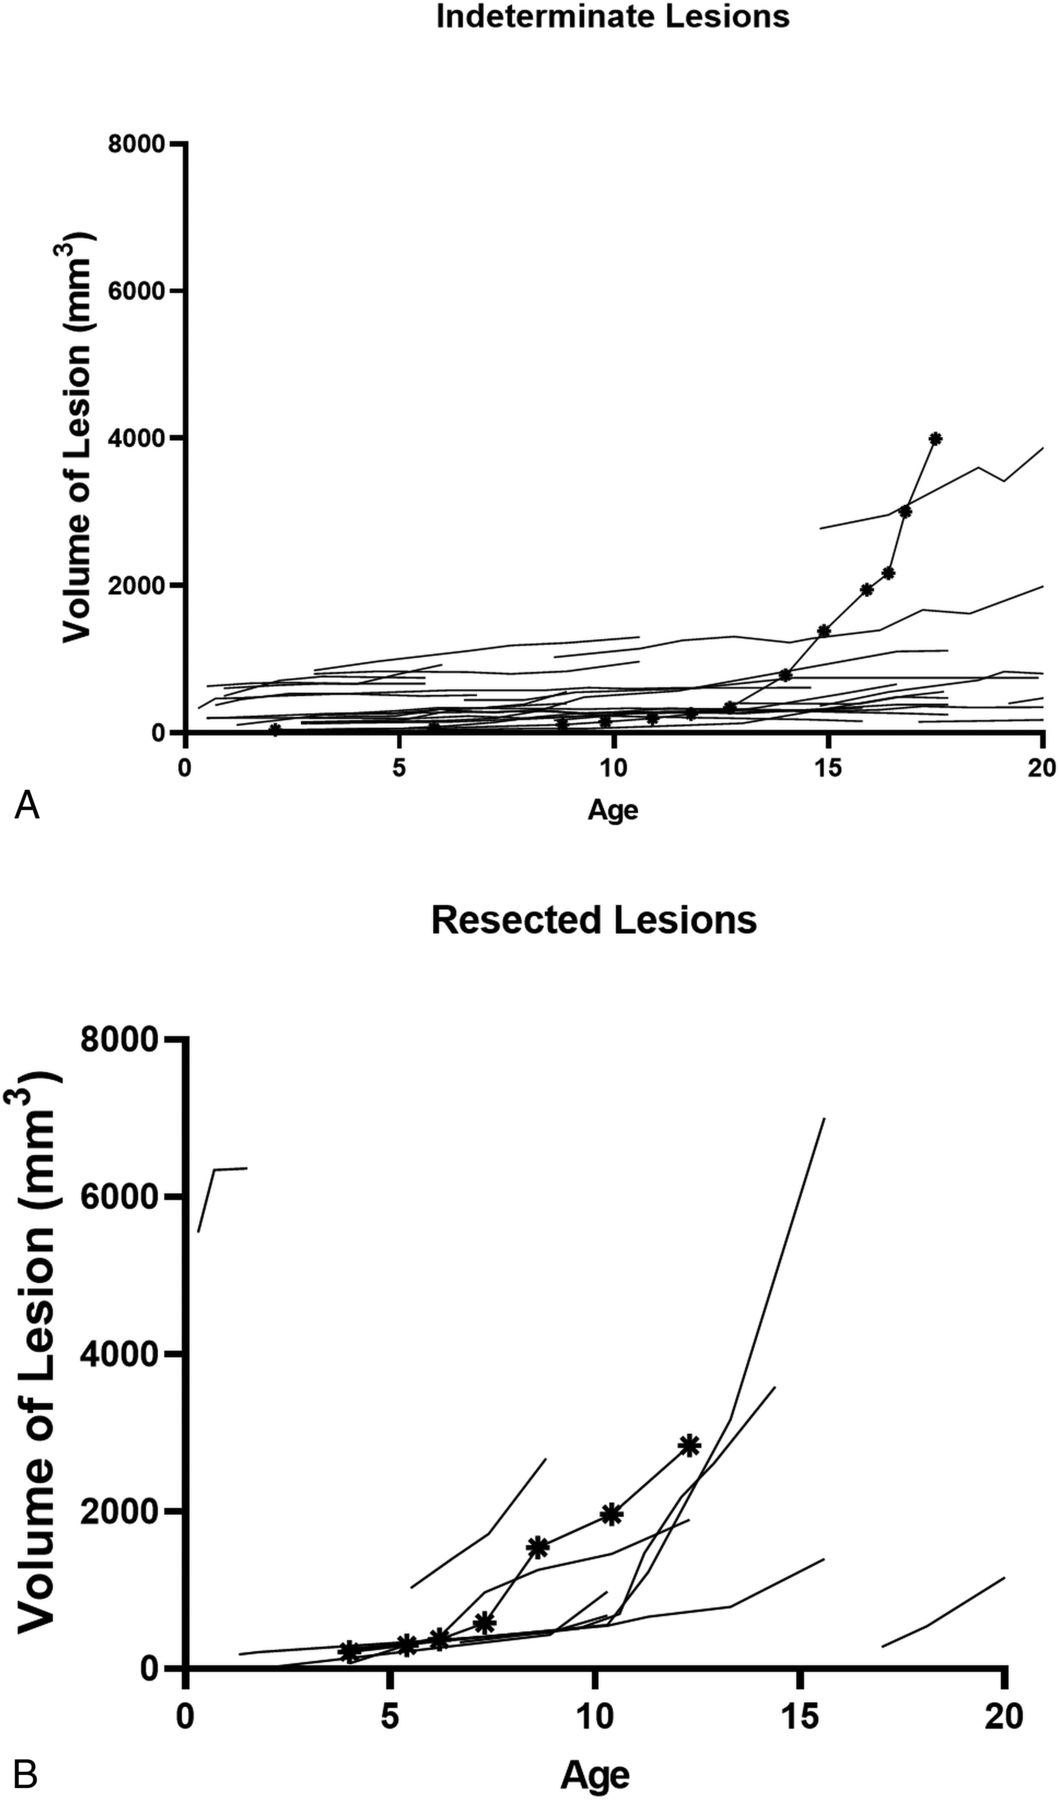
The volumes of indeterminate nodules and resected lesions at each age recorded can be seen in Fig 2A, -B, respectively. At the earliest MR imaging, there was no significant difference between indeterminate lesion volume and resected lesion volume (P = 1.0). Resected lesions grew substantially during the surveillance period, and at the most recent MR imaging, the resected lesions were significantly larger than the indeterminate lesions (P < .001) (Fig 3).

A, Volume of indeterminate lesions by age at scan. Each line indicates 1 indeterminate nodule. The marked line indicates that an indeterminate nodule in patient 23 shows rapid growth. There is currently no evidence of obstructive hydrocephalus. The patient is being closely monitored. B, Volume of resected lesions by age at scan. The marked line indicates patient 4's resected lesion. Patient 4's resected lesion had an average growth of 531.3 mm3/year between 6.2 and 7.3 years of age and a period of decelerated growth between 7.3 and 8.7 and 8.7–10.4 years of age, in which the average growth rates were 204.7 mm3/year and 118.9 mm3/year, respectively. At 12.7 years of age, the patient underwent surgical resection for obstructive hydrocephalus.

A, Median and IQR of lesion volumes of small lesions (small), indeterminate nodules (inde), and resected lesions (resected). The median volume and IQR at the earliest scan: small lesions, 25.22 mm3 (IQR = 50.8 mm3, n = 126); indeterminate lesions, 251.9 mm3 (IQR = 319.4 mm3, n = 27), and resected lesions, 245.6 mm3 (IQR = 486.5 mm3, n = 10). The median volume and IQR at most the recent scan: small lesions, 33.18 mm3 (IQR = 61.8 mm3, n = 126); indeterminate lesions, 615.6 mm3 (IQR = 581.1 mm3, n = 27); and resected lesions, 2283.0 mm3 (IQR = 3162.0 mm3; n = 10). Indeterminate lesion volume and resected lesion volume are compared at earliest scan and most recent scan using the Mann-Whitney U test. There is no significant difference in volume at the earliest scan (P = 1.0); however, there is a significant difference at the most recent scan. The asterisk indicates P < .001. B, Median lesion volume of each lesion type by age. Each point is the median volume of ≥2 lesions at a given age. NS indicates not significant.
Growth Evaluation
The median growth velocity and IQR for all nodules in the 0–5, 6–10, 11–15. and 16–20 years of age periods were 1.685 mm3/year (IQR = 22.7), 0.67 mm3/year (IQR = 7.1), 1.03 mm3/year (IQR = 7.7), and 1.08 mm3/year (IQR = 10.01), respectively. There was no significant difference in the velocity of growth comparing 0–5, 6–10, 11–15, and 16–20 years of age (P = .68). This analysis was repeated for small lesions (P = .68), resected lesions (P = .62), and indeterminate lesions (P = .18). No significant difference in growth velocities was observed.
Lesions types were compared within each age group. The median velocity of growth can be seen in Tables 1 and 2. Small lesions grew significantly slower than resected lesions during 0–5, 6–10, and 11–15 years of age and significantly slower than indeterminate lesions at 0–5, 6–10, and 16–20 years of age. There was a significantly faster velocity of growth exhibited by resected lesions compared with indeterminate lesions between 6–10 and 11–15 years of age. Comparisons of resected lesions with other subgroups could not be made during the 16–20 years of age period because only 1 resected lesion had preoperative MRI during this time period. A mixed-effects analysis found a significant interaction between age periods and lesion type (P < .001).
Median growth velocitiesa
Growth velocity comparisonsa
The highest percentage of lesions that grew >4.2 mm3/year occurred between 0 and 5 years of age in all lesion categories. All resected lesions grew in all age periods measured (Table 3).
Percentage of lesions with growth rates > 4.2 mm3/yeara
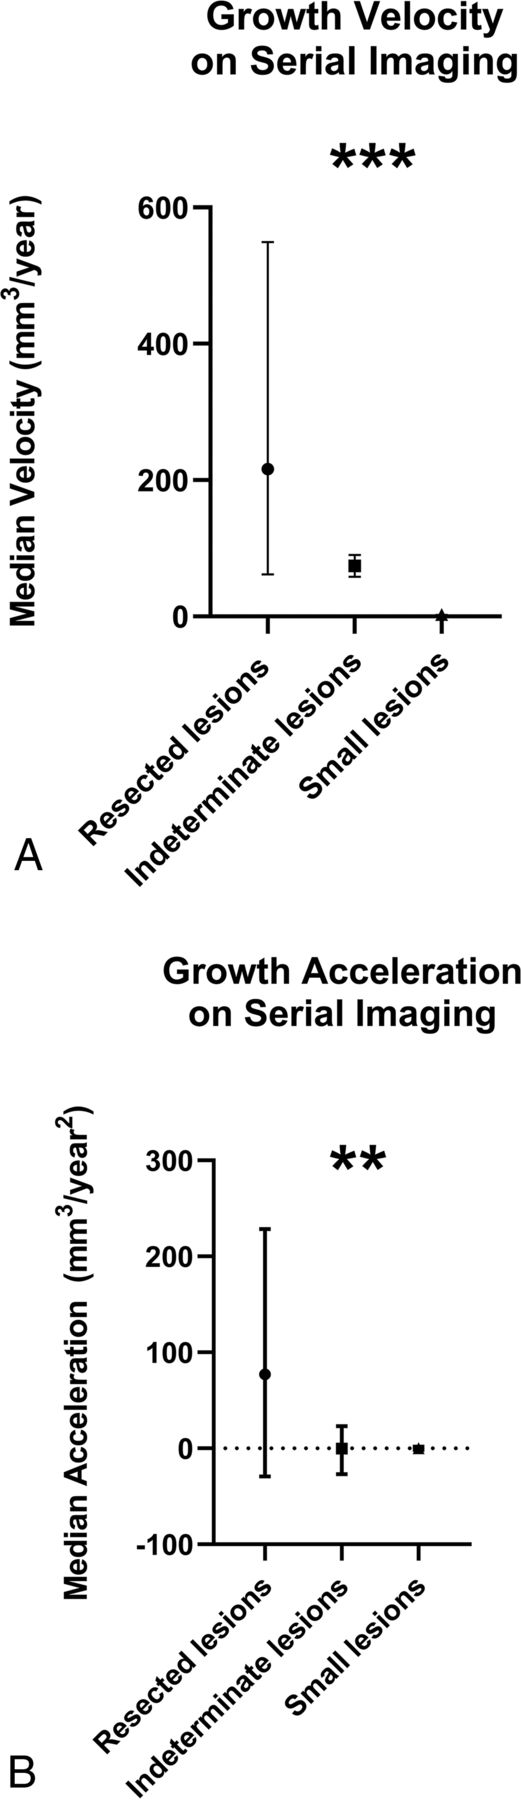
The median and IQR of velocity of growth and acceleration of growth in each measured time point can be seen in Fig 4A, -B, respectively. Resected lesions had a significantly faster growth velocity between MR imaging scans compared with indeterminate lesions (P < .001) and small lesions (P < .001), and indeterminate lesions had significantly faster growth velocities compared with small lesions (P < .001) (Fig 4A). A comparison of growth acceleration showed significantly higher rates of acceleration in resected lesions compared with indeterminate lesions (P = .014) and small lesions (P = .004). There was not a significant difference in the acceleration between indeterminate lesions and small lesions (P = 1.0).

A, Median growth velocity between scans for each lesion type: small lesions, 0.45 mm3/year (IQR = 3.2 mm3/year, n = 789); indeterminate lesions, 21.95 mm3/year (IQR = 71.6 mm3/year; n = 167); resected lesions, 216.1 mm3/year (IQR = 487.7 mm3/year; n = 38). A Mann-Whitney U test with a Bonferroni correction was used to compare the velocity of growth between lesion types. The triple asterisks indicate a significant difference in velocity comparing resected lesions and indeterminate lesions (P <.001), resected lesions and small lesions (P <.001), and indeterminate lesions and small lesions (P <.001). B, Median acceleration of growth of all lesion types: small lesions, 0.00 mm3/year2 (IQR = 3.4 mm3/year2, n = 673); indeterminate lesions, −0.18 mm3/year2 (IQR = 70.63 mm3/year2, n = 141); resected lesions, 77.01 mm3/year2 (IQR = 257.7 mm3/year2; n = 30). A Mann-Whitney U test with a Bonferroni correction was used to compare the acceleration of growth among lesion types. The double asterisks indicate significant differences between resected lesions and indeterminate lesions (P = .01) and resected lesions and small lesions (P = .004). There is not a significant difference in the rate of acceleration between indeterminate lesions and small lesions (P = 1.0).
DISCUSSION
Studies that examine the growth of SGCTs have been limited to case series focused on those that have been surgically resected.3 Estimates of growth of SGCTs have ranged from 1 mm/year to 65.2 mm/year in maximum diameter.3 Our study characterizes growth velocities not only for SGCTs but also for SENs and found, on serial imaging, that there were significant differences in growth among resected lesions, indeterminate lesions, and small lesions. Additionally, resected lesions exhibited growth rates distinct from those of all other nodules at the FOM between 6 and 15 years of age. Therefore, measurement of growth rates from 6 to 15 years of age may help to identify those nodules that will continue to grow to a size that would result in obstructive hydrocephalus.
Prior consensus guidelines have proposed static criteria to identify SGCTs. Jóźwiak et al9 defined SGCTs as tumors of >0.5 cm in maximum diameter, typically localized near the FOM, with documented growth. Roth et al6 defined SGCTs as lesions of >1 cm in maximum diameter at the caudothalamic groove or a lesion in any location that has exhibited growth on serial imaging regardless of size. In our study, indeterminate nodules were quite common and not distinguishable from resected lesions by size criteria at the earliest MR imaging but were distinguishable by growth velocities on serial imaging. Moreover, our data clearly show that a considerable percentage of small lesions and indeterminate nodules grew in each age period studied but never resulted in obstructive hydrocephalus.
Our data suggest that comparison of growth velocities can identify SGCTs and that mild growth alone does not reliably identify those nodules that will result in obstructive hydrocephalus. Other studies have recommended that once any growth is proved on serial imaging, resection should be performed.10,11 However, in our data, enlargement of nonobstructing nodules was frequently observed (Table 3). Hence, a recommendation of resection on the basis of any interval growth may be too nonspecific, but rather, closer monitoring may be indicated.
Prior consensus studies recommend that children with TSC be scanned every 1–3 years.6 In the 0- to 5-year age group, though a study with larger numbers would be required to address this issue more definitively, our data raise the question of whether a child at 1 year of age who has only a small nodule at the FOM has a low risk of progression to obstructive hydrocephalus in the 0- to 5-year age period.
There are several caveats suggested from our study. First, indeterminate, nonobstructing lesions could exhibit high velocity and acceleration of growth (Fig 2A). Second, a growth deceleration did not preclude eventual progression to SGCT when scanning within the recommended consensus guidelines of every 1–3 years (Fig 2B).
This study has several limitations. First the study is limited by sample size: Although all patients with lesions resected between 2002 and 2018 were included, for the small lesions and the indeterminate nodules, all patients who met the inclusion criteria were randomly selected using a random number generator. Second, this was a retrospective study with a small cohort. Third, we evaluated only lesions that were in the region of the FOM. Fourth, we studied only growth curves and did not look at other MR imaging characteristics. Fifth, most patients in our cohort were studied between 0 and 15 years of age. It is generally believed that SGCTs do not develop after the first 20–25 years of life.3 It is possible that growth and development of an SGCT could be seen in the future in those patients who have not reached the age of 20–25 years.3 Finally, our measurement technique of cubic measurements likely overestimates the actual size of lesions.12 However, the method we implemented provides a practical and reproducible approach to the measurement of nodules at the FOM and allows volume comparisons within our study.
Despite the limitations of this study, our results show clear differences in growth rates across lesion types, which may serve to distinguish obstructing lesions from nonobstructing lesions. A larger prospective study that tracks growth rates may be able to refine current diagnostic criteria of SGCTs. Additionally, our data suggest that obstructing lesions tend to be larger than nonobstructing lesions. Therefore, a future study may be able to define a critical volume range at which a lesion is likely to result in hydrocephalus. The distinction between subependymal nodules and SGCTs has important clinical implications because the management of these lesions is influenced by the ability of a lesion to grow and become symptomatic. Appropriate and consistent categorization will lead to better clinical outcomes.
CONCLUSIONS
SGCTs show growth velocities distinct from those of SENs at the FOM. Measurement of growth velocity and acceleration on serial imaging can help differentiate SGCTs from SENs in the first 20 years of life. Additionally, 6–15 years of age may be an important period to monitor SGCTs at the FOM because increased growth in this period may indicate that the lesions will continue to grow and result in obstructive hydrocephalus.
ACKNOWLEDGMENTS
The authors would like to thank the patients and families whose information was used.
Footnotes
Disclosures: Elizabeth A. Thiele—UNRELATED: Employment: Massachusetts General Hospital. Paul Caruso—UNRELATED: Expert Testimony: various law firms on medicolegal cases.
References
- Received March 18, 2021.
- Accepted after revision May 3, 2021.
- © 2021 by American Journal of Neuroradiology


Jump to section
Related Articles
Cited By...
- No citing articles found.