
Abstract
BACKGROUND AND PURPOSE: VBM, DBM, and cortical thickness measurement techniques are commonly used automated methods to detect structural brain changes based on MR imaging. The goal of this study was to demonstrate the pathology detected by the 3 methods and to provide guidance as to which method to choose for specific research questions. This goal was accomplished by 1) identifying structural abnormalities associated with TLE with (TLE-mts) and without (TLE-no) hippocampal sclerosis, which are known to be associated with different types of brain atrophy, by using these 3 methods; and 2) determining the aspect of the disease pathology identified by each method.
MATERIALS AND METHODS: T1-weighted MR images were acquired for 15 TLE-mts patients, 14 TLE-no patients, and 33 controls on a high-field 4T scanner. Optimized VBM was carried out by using SPM software, DBM was performed by using a fluid-flow registration algorithm, and cortical thickness was analyzed by using FS-CT.
RESULTS: In TLE-mts, the most pronounced volume losses were identified in the ipsilateral hippocampus and mesial temporal region, bilateral thalamus, and cerebellum, by using SPM-VBM and DBM. In TLE-no, the most widespread changes were cortical and identified by using FS-CT, affecting the bilateral temporal lobes, insula, and frontal and occipital lobes. DBM revealed 2 clusters of reduced volume complementing FS-CT analysis. SPM-VBM did not show any significant volume losses in TLE-no.
CONCLUSIONS: These results demonstrate that the 3 methods detect different aspects of brain atrophy and that the choice of the method should be guided by the suspected pathology of the disease.
Abbreviations
- DBM
- deformation-based morphometry
- EMS
- expectation maximization segmentation
- FDR
- false discovery rate
- FS
- Freesurfer
- FS-CT
- FS-based cortical thickness
- FSL
- FMRIB Software Library
- FWHM
- full width at half maximum
- GM
- gray matter
- ICV
- intracranial volume
- SPM
- statistical parametric mapping
- TLE
- temporal lobe epilepsy
- TLE-mts
- TLE–mesial temporal sclerosis
- TLE-no
- TLE–normal-appearing hippocampus
- ULD
- unbiased large deformation
- VBM
- voxel-based morphometry
- WM
- white matter
The most commonly used methods for automated whole brain structural analysis are VBM,1,2 DBM,3,4 and cortical thickness methods.5,6 VBM is the most widely used method to date, with more than 22 studies published in the area of TLE alone.7–11 One of the main reasons for its popularity is probably that VBM is relatively easy to perform, with freely available software such as SPM (Wellcome Department of Cognitive Neurology, London, United Kingdom) and FSL (FMRIB Analysis Group, Oxford, United Kingdom). The first step of so-called optimized VBM12 is to generate a probabilistic GM map from the T1 gray-scale images by using a combination of voxel intensity and an a priori knowledge of the spatial distribution of GM. GM maps are then registered to a reference image. Registration to the reference image is based on a low-dimensional spatial transformation that aligns global differences but preserves local differences in GM distribution. GM volume differences between groups are then assessed voxel by voxel by using a general linear model.
DBM differs from VBM in 2 main aspects. First, the DBM image is not segmented, so the information from the full gray- scale brain is used in the analysis. Second, DBM registration is high-dimensional, eliminating individual subject physiologic and pathologic morphology differences. The anatomic differences then lie in the deformation fields that are required to transform the subject's brain. The more precise the registration, the more sensitive the method will be to detect subtle systematic structural differences that may not be possible with VBM.13,14 The downside of this technique, however, is that DBM registration algorithms are not widely available and are not as simple to implement as VBM. This is probably one of the main reasons VBM is generally used over DBM. To our knowledge, there are no whole brain DBM studies reported in TLE.
Cortical thickness is commonly computed by analyzing the 3D reconstruction of the brain's cortical surface from structural MR imaging. The freely available FS software (Martinos Center for Biomedical Imaging, Massachusetts General Hospital, Boston, Massachusetts) is the most commonly used software for that purpose. FS-CT is determined as the distance from the GM/WM surface to the GM/CSF surface. The intersubject registration procedure is then based on alignment of the cortical folding patterns as opposed to the voxel intensities used for VBM and DBM. Although fluid warped images by using the DBM approach also can very precisely match the reference image, matching intensities may be less anatomically meaningful than matching cortical folding patterns. This may lead to a failure to align matching cortical regions across subjects, resulting in a lack of power in localizing subtle cortical differences in the voxel-based approaches.13 The drawback of cortical thickness analysis is that it will not detect subcortical abnormalities.
The overall aim of this study was to compare VBM, DBM, and FS-CT regarding their ability to detect different types of atrophy (subtle or microscopic atrophy versus mass or macroscopic atrophy). TLE is associated with both types of atrophy and thus was chosen as a model to investigate this question. Based on the appearance of the hippocampus, TLE can be divided into 2 subgroups: TLE with MR imaging signs (hippocampal atrophy and increased T2 signal intensity) of mesial temporal sclerosis (TLE-mts) and TLE with normal MR imaging, characterized by a normal-appearing hippocampus (TLE-no). In addition to the hippocampal volume loss, TLE-mts is characterized by ipsilateral mesial and lateral temporal, but also frontal, parietal, occipital, and cerebellar volume loss as well smaller subcortical structures (basal ganglia and thalamus).9,15,16 Structural changes in TLE-no by using both VBM and region of interest approaches however are more subtle and less consistent.17–19,11 Cortical thickness measurements, on the other hand, have shown widespread temporal and extratemporal cortical thinning.16 Due to differences in study design, eg, measurement parameter investigated, study population, field strength, and applied statistical analysis, it is not possible to draw conclusions regarding the sensitivity of the methods used to detect these abnormalities across studies.
The aim of this study was to compare the type of volume loss detected by each method—SPM-VBM, DBM, and FS-CT—and so to provide guidance on which method may be best to adopt in answering specific research questions. We expected that in TLE-mts, where macroscopic volume abnormalities occur, all 3 methods would be sensitive enough to detect these large-scale volume changes (CT on the cortex only). However, it was expected that in TLE-no DBM would be able to detect subtle subcortical changes over VBM due to its superior coregistration. We also hypothesized that FS-CT would detect subtle cortical abnormalities, without macroscopic volume losses, not detected by either voxel-based method.
Materials and Methods
Subjects
Participants in this investigation consisted of 15 patients with unilateral TLE-mts (6 men, 9 women; mean age, 40.1 ± 9.6 years), 14 patients with unilateral TLE-no (6 men, 8 women; mean age, 39.6 ± 8.3 years), and 24 healthy controls (12 men, 12 women; mean age, 37.9 ± 9.4 years). All patients were recruited during presurgical evaluation from the University of California, San Francisco and the Pacific Epilepsy Program, California Pacific Medical Center. A cortical thickness analysis including some of these subjects has previously been published from our laboratory.16 Laterality of seizure onset was made from prolonged ictal and interictal scalp video-electroencephalogram telemetry. Nine TLE-mts patients had a left temporal onset, and 6 TLE-mts patients had a right onset. In TLE-no, 7 patients were diagnosed with left temporal onset, and 7 patients had a right temporal onset. Patients were categorized as TLE-mts or TLE-no based on evidence of hippocampal atrophy and signal intensity changes on their 4T MR imaging that used an epilepsy-specific protocol, and all were reviewed by the same neuroradiologist (J.B.). Hippocampal volumetry was used to confirm the presence (TLE-mts) or absence (TLE-no) of significant hippocampal volume loss. Volumetry was performed on high-resolution T2-weighted hippocampal images by using a method of manual segmentation.20 There was a significant mean difference (P < .001) between the age at which TLE-mts and TLE-no patients developed epilepsy (TLE-mts, 5 ± 6.6 years; TLE-no, 23 ± 11.7 years) and also the duration of years patients have had epilepsy (TLE-mts, 34.6 ± 11.8 years; TLE-no, 17.1 ± 9.8 years).
Data Processing
MR Imaging Acquisition.
All subjects underwent MR imaging with an MedSpec 4T system (Bruker MedSpec, Madison, Wisconsin) controlled by a Trio console (Siemens, Erlangen, Germany) and equipped with an 8-channel array coil (USA Instruments, Aurora, Ohio). A volumetric T1-weighted magnetization-prepared rapid acquisition of gradient echo sequence was acquired with the following imaging parameters: 2300/3/950 ms (TR/TE/TI); flip angle of 7°; and 1 × 1 × 1-mm3 voxel resolution.
Image Processing
To combine left and right temporal onset patients in the analysis, MR imaging data for patients were reassembled according to brain hemisphere of seizure onset. Therefore, images of the subjects with right TLE onset were left-right flipped so that all subject ipsilateral hemispheres were on the left side. Because previous studies have revealed GM asymmetries between the left and right hemispheres in the normal population,21 customized symmetrical templates were generated for each analysis method from the same control subjects as described below.
Voxel-based Morphometry
T1 images were intensity inhomogeneity corrected and segmented into GM, WM, and CSF by using the EMS toolbox22 in SPM2 (http://www.fil.ion.ucl.ac.uk/spm), running in Matlab 6.1 (MathWorks, Natick, Massachusetts). The EMS toolbox was used as opposed to standard SPM2 due to its superior bias field correction algorithm that performs better with the more pronounced bias field of the 4T images. Optimized VBM was then carried out on probabilistic GM maps according to the optimized VBM protocol described in detail previously.12 To summarize, a study-specific symmetrical SPM GM template was first created by averaging 31 normalized (first affine followed by a nonlinear registration) control subjects (flipped and unflipped) and smoothing by using an isotropic 8-mm FWHM Gaussian kernel. All GM maps were then normalized to this symmetrical template first by using a 12-parameter affine transformation, followed by a nonlinear transformation to minimize the residual squared difference between the image and template.23 Voxel intensity values were multiplied (modulated) by the Jacobian determinant (ie, the local expansion/contraction factor) derived from the deformation map produced during spatial normalization, to preserve GM volume. The modulated GM images were smoothed with an isotropic 8-mm FWHM Gaussian kernel and used for statistical analysis.
Deformation-based Morphometry
The T1 images were skull-stripped, and intensity inhomogeneity was corrected by using the bias field generated by EMS. A study-specific symmetrical ULD template was created using the same 31 control subjects as for the VBM template by using a fluid registration algorithm.24 This template creation step is described in full elsewhere.25 To summarize briefly, it incorporates an unbiased approach in which each subject's flipped and nonflipped images are first simultaneously deformed to create a symmetrical subject brain. Symmetrical subject images are then simultaneously deformed iteratively into an average ULD template brain. This technique avoids the bias toward a particular subject's geometry introduced by selecting a single subject template.26 The ULD template also contains sharper features than the multisubject average intensity template as created in SPM.
Each subject's T1 image is first registered to the template with an affine 12-parameter transformation. Subject brains are then nonlinearly deformed to the template by using a fluid-flow warping technique.25 The Jacobian determinants of the deformation fields are used to gauge the local volume differences at each voxel between the individual image and the template. Each subject Jacobian map is smoothed with an isotropic 8-mm FWHM Gaussian kernel.
Cortical Thickness
Analysis of cortical thickness was carried out by using FS, version 3.05 (https://surfer.nmr.mgh.harvard.edu). Detailed descriptions of this method have already been published27,28 but are briefly summarized here. Based on a linear combination of voxel intensities and local geometric constraints, the cerebral WM is first segmented. The WM is divided into 2 hemispheres, and the brain stem and cerebellum are removed. Tessellation is then performed to produce a triangle-based mesh of the WM surface and refined to alleviate the voxel-based nature of the initial curvature. The WM surfaces are deformed outward to generate the pial (GM/CSF intersection) surface. Topologic defects in the surface are corrected by using an automated topology fixer. Visual quality checks are performed and inaccuracies are manually edited and corrected by reprocessing. The cortical surface is spherically inflated so that the entire cortical surface is exposed, including deep tissue inside the sulci. Using combined information from the pial and WM surfaces, cortical thickness is calculated at each vertex.
To perform surface-based analysis of cortical thickness between groups, a custom symmetrical template is constructed by using data from the same 31 control subjects as for VBM and DBM processing. To create a surface template, an average curvature map is created by averaging subject gyral and sulcal curvature patterns. Each study subject's surface is then registered to the template, and the deformation is guided by the cortical features of the template. Thickness data from each subject are then smoothed by using a 20-mm FWHM 2D Gaussian kernel and mapped to an average surface. This average surface is the average of all study subjects for the visualization of results and should not be confused with the template described above.
Statistical Analysis
Linear regression was performed to determine the effect of “group” (patient or control) on the measurement parameter at each voxel/vertex. ICV was entered as a nuisance variable for VBM analysis only because this was already accounted for during the initial affine registration of DBM and cortical thickness is not confounded by ICV.29 Contrasts were defined to detect differences at each voxel/vertex between 1) controls and TLE-mts and 2) controls and TLE-no. Given the large number of voxels/vertices being tested in each analysis, it is necessary to correct for multiple comparisons to reduce the probability of obtaining false-positives (type I errors). The most commonly used methods, such as random-field theory and FDR are dependent on the number of voxels/vertices tested. Given that SPM-VBM and DBM images contain approximately 2 million brain voxels, whereas FS provides cortical thickness information at 320,000 vertices on average, these methods of multiple comparison correction make it difficult to fairly compare results across the morphologic methods used in this study. Permutation analysis is a nonparametric technique that has been demonstrated to be an effective multiple comparison correction technique in neuroimaging30 and is also independent of the number of voxels/vertices tested. A null distribution for the effect of group at each voxel/vertex was constructed by using 10 000 random permutations of the data. For each test, the subject's diagnosis was randomly permuted, and t tests were conducted to identify voxels more significant than P=.05. The group differences more significant than P=.05 were computed for the real experiment and for the random assignments. Finally, a ratio, describing the fraction of the time the suprathreshold group difference was greater in the randomized maps than the real effect (the original labeling), was calculated and a new P value was reported for the significance at that point. Voxelwise analysis was conducted by using FSL's “randomize” tool (FMRIB Software Library, version 4; http://www.fmrib.ox.ac.uk/fsl). FS-CT analysis was conducted with the same parameters at each vertex by using FS's statistical analysis tool.
Results
TLE-mts versus Controls
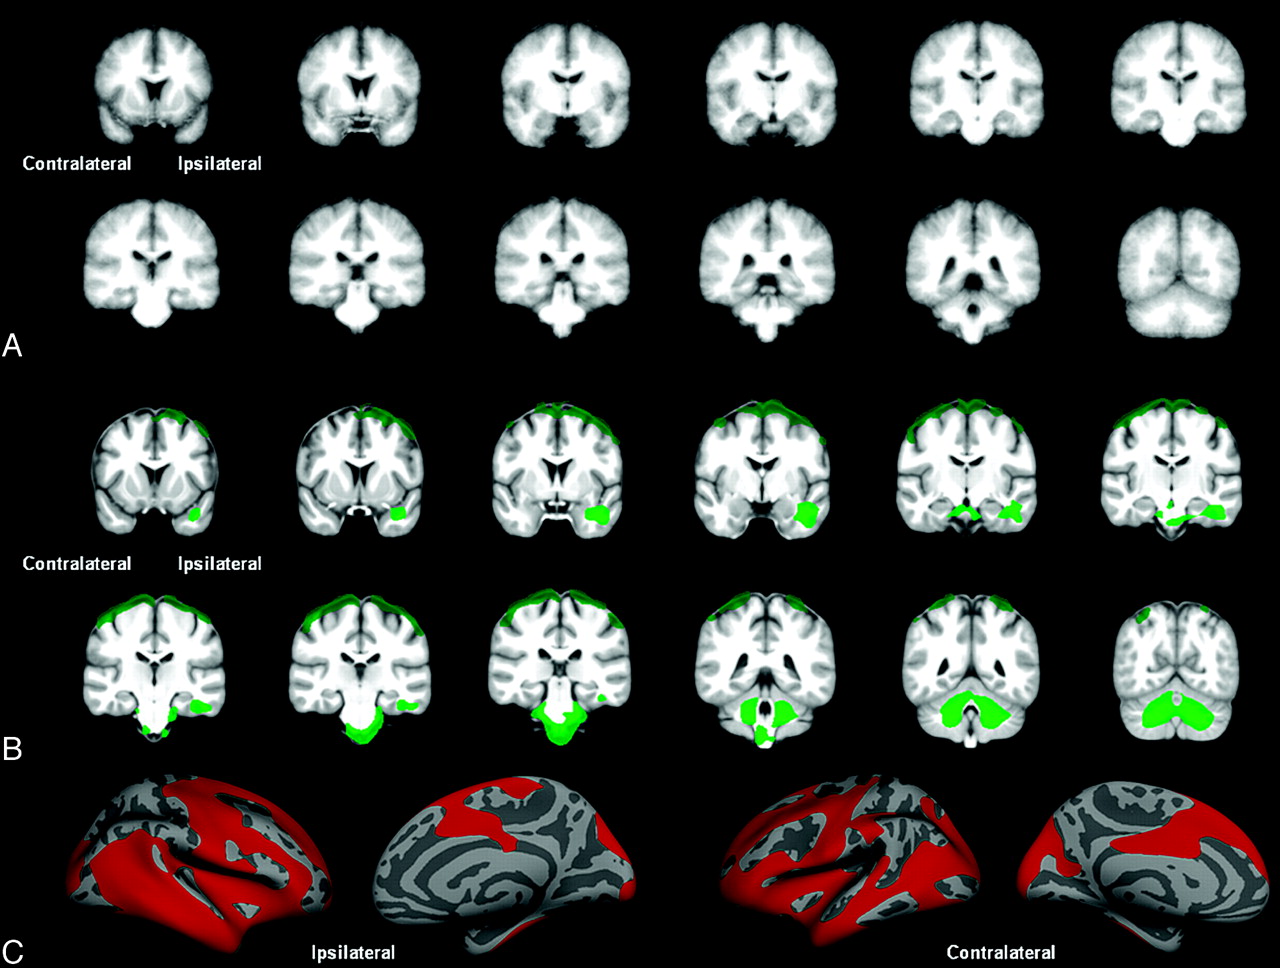
Figure 1 displays GM volume loss (SPM-VBM), volume loss (DBM), and cortical thinning (FS-CT) in TLE-mts compared with controls after permutation correction. Both SPM-VBM and DBM show 1 large cluster of volume losses extending from the ipsilateral hippocampus and mesial temporal lobe to bilateral thalamus, brain stem, and cerebellum. In theSPM-VBM analysis, this cluster extends to the lateral temporo-occipital cortex (ipsilateral > contralateral). FS-CT demonstrates 1 cluster of cortical thinning of the ipsilateral temporo-occipital-parietal region. Table 1 outlines the size of the significant clusters and the maximum t-statistic. The largest cluster was found by using VBM analysis; however, DBM revealed the largest cluster t-statistic.

Controls versus TLE-mts. A, VBM-SPM GM differences. B, DBM Jacobian differences. C, FS-CT differences between groups. All results corrected for multiple comparisons by using permutation analysis (P < .05).
TLE-mts versus controls
TLE-no versus Controls
Figure 2 shows volume loss (DBM) and cortical thinning (FS-CT) in TLE-no compared with controls after permutation correction. SPM-VBM analysis revealed no changes between groups after correction for multiple comparisons. FS-CT showed a large cluster of bilateral cortical thinning in both temporal lobes extending to the frontal, occipital, and parietal lobes bilaterally. DBM demonstrated 2 significant clusters. The first cluster included the ipsilateral temporal lobe, extending to the brain stem and cerebellum. The second cluster included the bilateral superior frontal cortex, pre- and postcentral cortex, and superior parietal cortex. Table 2 outlines the size of the significant clusters and the maximum t-statistic. Figure 3 shows SPM-VBM, DBM, and FS-CT results after FDR correction for both TLE-mts and TLE-no versus controls.

Controls versus TLE-no. A, VBM-SPM GM differences. B, DBM Jacobian differences. C, FS-CT differences between groups. All results corrected for multiple comparisons by using permutation analysis (P < .05).
TLE-no versus controls

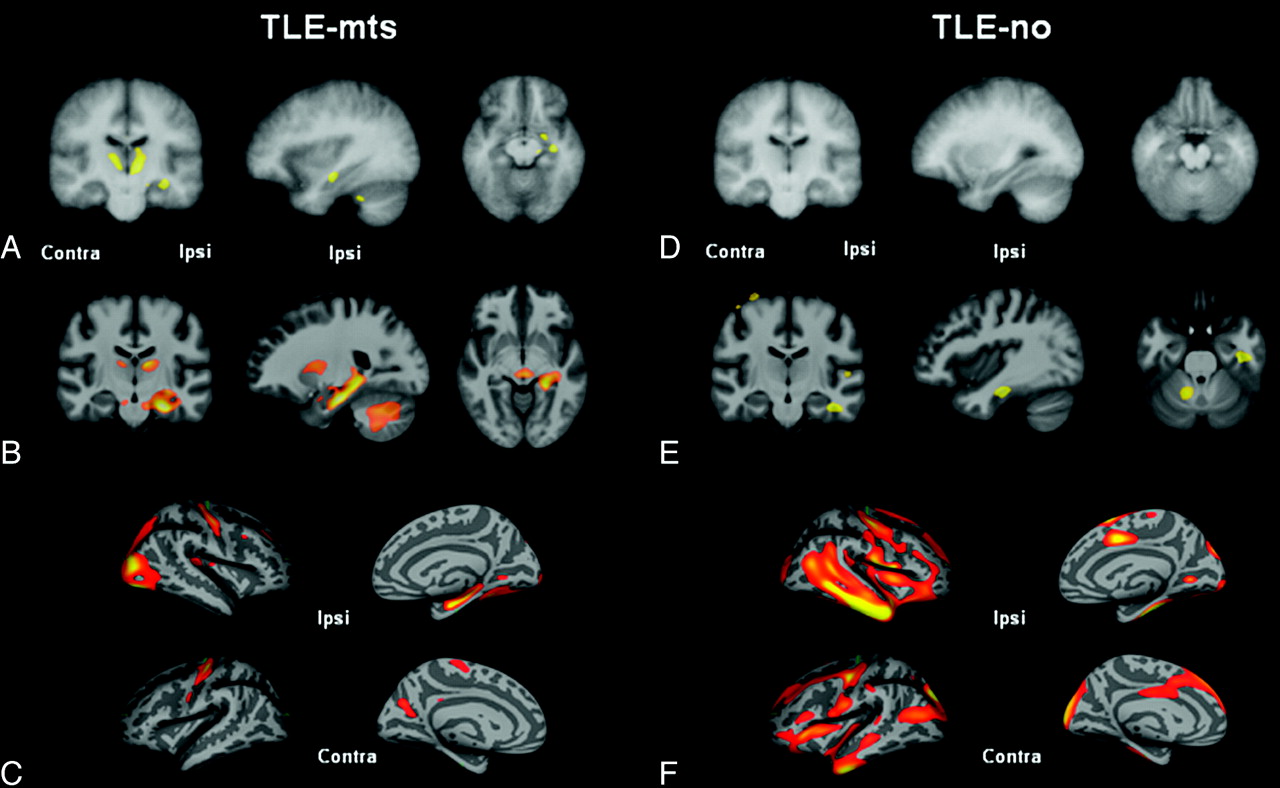
Controls versus TLE-mts and controls versus TLE-no after FDR < .05 correction for multiple comparisons. A, VBM-SPM GM differences. B, DBM Jacobian differences. C, FS-CT differences between controls and TLE-mts. D, VBM-SPM GM differences. E, DBM Jacobian differences. F, FS-CT differences between controls and TLE-no.
Discussion
In this study, we aimed to investigate the aspects of disease atrophy detected by 3 different automated methods of brain morphometry. There were 2 main findings: 1) In TLE-mts, voxel-based methods SPM-VBM and DBM identified the most pronounced volume losses in the ipsilateral hippocampus and mesial temporal region, the ipsi- and contralateral thalamus, and cerebellum. FS-CT showed cortical thinning in the ipsilateral temporo-occipital region. 2) SPM-VBM showed no significant volume loss in TLE-no. In contrast, DBM detected a region of ipsilateral temporal, bilateral superior frontal, and cerebellar volume loss. The most widespread changes covering the bilateral temporal, frontal, occipital, and parietal cortex were identified by using FS-CT. Based on these findings, we conclude that VBM, DBM, and FS-CT detect different types of atrophy and thus that the choice of the volumetry method should be guided by the knowledge about the disease process.
TLE-mts
Significant findings after FDR correction were consistent with previous studies, the clinical implications of which have been demonstrated previously and are not discussed here.9,15,16,18,31,32 The results differ when permutation analysis was used to correct for multiple comparisons instead of the more commonly used FDR approach. These methods of multiple comparison correction are based on different principles (see Statistical Analysis). The permuted results were used to compare between methods because this method is independent of the number of voxels/vertices tested and therefore represents a more unbiased approach.
When comparing across the methodologies, the most prominent volume changes in TLE-mts were demonstrated below the cortex and identified by using both SPM-VBM and DBM. Both methodologies detected the pathology because the observed changes are macroscopic, and the ability of DBM to detect subtle morphologic changes is not essential. In addition, however, the SPM-VBM cluster extended to the ipsilateral temporal-occipital and contralateral occipital cortex that was not detected by DBM or by previous VBM studies. Although this cortical finding may seem counterintuitive when DBM registration is theoretically more accurate than SPM-VBM, there are several possible explanations. 1) An increased intersubject variance in the cortical region by using DBM-SPM-VBM coregistration corrects macroscopic volume effects but maintains most of the individual morphologic differences at the gyral level. DBM, as used in this study, corrects most of the physiologic and disease-related interindividual differences at the gyral level, resulting in a higher between subject variability of the transformation matrix and thus a lower power to detect disease-related differences. 2) Although corrected for head size, the resulting deformation matrix of SPM-VBM contains the affine and the nonlinear transformations, whereas the affine coregistration is not integrated in the DBM transformation matrix. This would suggest that the significant cortical cluster may be a reflection of the volume decrease in the deep WM of the temporal lobe.
FS-CT detected a region of cortical thinning in the temporo-occipital lobe also detected by SPM-VBM. However, volume loss detected by SPM-VBM and DBM mostly affected the hippocampus and subcortical structures that are not part of the FS-CT analysis. These results suggest that TLE-mts is a disease with mostly macroscopic volume loss affecting a large region predominantly including the ipsilateral hippocampus, thalami, and cerebellum, and extending to the lateral temporal cortex, which may be detected best by using VBM analysis. Cortical thinning is present in TLE-mts but, at least in this analysis, is less prominent than the subcortical volume losses that might suggest that the cortical thinning is secondary to the subcortical atrophy.
TLE-no
The 4T VBM findings presented here were in agreement with previous VBM studies at 1.5T, demonstrating no significant findings after FDR correction.11,19 The DBM findings were consistent with some previous region of interest volume analyses that show ipsilateral temporal lobe atrophy.17,18 The FDR corrected cortical thickness results for TLE-no have been reported previously and discussed by our laboratory,16 but they have not been demonstrated elsewhere.
In the permutation analysis of TLE-no patients versus controls, DBM found significant changes affecting the ipsilateral temporal lobe, cerebellum, and brain stem in 1 cluster, and the superior frontal and parietal cortex in a second cluster. No significant volume loss was detected by using SPM-VBM. This suggests that the fluid-registration algorithm used by DBM may be better suited to detect the subtle volumetric abnormalities associated with this disease type than the spatial basis function algorithm implemented in SPM2. A region of interest–based DBM study focused on the thalamus has previously been carried out on the same study subjects in our laboratory.33 This study demonstrated a subtle volume loss in this region. If it is necessary to study subcortical structures in disease types with very subtle volume changes such as TLE-no, it may be beneficial to have an a priori hypothesis to avoid having to correct for multiple comparisons across the whole brain, where such a finding may not survive a stringent correction.
FS-CT analysis revealed the most widespread cortical thinning in TLE-no affecting the bilateral temporal lobes, insula, and frontal and occipital lobes. Only the thinning of the superior frontal cortex also was detected by DBM. The reason for this may be physiologic, methodologic, or a combination: 1) Physiologic: Subtle thinning of the cortex associated with TLE-no is not detected through macroscopic voxel-based volume analysis. The nature of the abnormalities associated with TLE-no may be primarily confined to the thinning of the cerebral cortex, subtle effects of which may be diluted in analysis of volume (a combination of thickness and surface area). In TLE-mts, however, the cortical changes are large and hence can be detected through analysis of either volume or FS-CT. 2) Methodologic: Image registration methods of matching gyral patterns help to precisely colocalize identical cortical regions of subjects without sacrificing the details contained in the underlying measure of interest (ie, FS-CT). Matching intensities, as with SPM-VBM and DBM, is less anatomically meaningful and may lead to a less precise colocalization of subject cortical region and a decrease in the power to detect structural changes in a disease group whose cortical abnormalities are already quite subtle. In addition, the 3D smoothing step used by the voxel-based methods leads to a blurring of tissue across neighboring banks of a sulcus that are not anatomically related and thus could again lead to a reduced ability to detect cortical abnormalities. FS smoothing however is performed across the 2D inflated brain surface, preserving the relationship between neighboring sulcal and gyral structures.
Limitations
There are several methodologic differences between the techniques that have not been controlled: 1) The methods use different segmentation techniques (probabilistic in SPM-VBM versus binary in FS-CT). 2) Each method requires smoothing for statistical analysis, but because of the different smoothing approaches, it is difficult to determine a comparable smoothing kernel size for surface-based and voxel-based methods. Therefore, in this study, recommendations were taken from previous studies for both voxel- and surface-based smoothing kernel sizes. 3) A more recent SPM toolbox, DARTEL (compatible with SPM, versions 5 and higher) includes an improved atlas creation and registration method that adopts a diffeomorphic registration algorithm that is similar to the DBM approach used in this study.34 Theoretically, this would lead to more comparable results between VBM-SPM and DBM and is currently being tested in our laboratory. 4) Effort was made to remove brain dura during the skull stripping process before DBM analysis, particularly at the most superior part of the interhemispheric fissure. However, this was difficult to accomplish in some subjects without the removal of cortical voxels. Although the percentage of subjects with some remaining dura between controls and TLE-no subjects was equal, it cannot be disregarded that the superior frontal cortical cluster may be due to this artifact and should be considered a limitation of this method. 5) None of the 3 methods depicts the “whole truth,” ie, just because a brain region seems normal in a VBM or cortical thickness analysis, it cannot be concluded for sure that this structure is not affected by the disease process but only that it is less likely to be affected by the type of pathologic abnormalities to which the chosen method is particularly sensitive.
Conclusions
The findings of this study show that each of the 3 methods detects different types of structural abnormalities and that the choice of the method has to be guided by the nature of the suspected pathology. Some of the differences are obvious because they are inherent to the method, eg, FS-CT is not suited to detect subcortical abnormalities because these structures are not part of the cortex. However, the results also can differ in structures that are assessed by all 3 methods. Based on the findings in this study, we conclude that SPM-VBM and DBM will detect cortical and subcortical abnormalities in diseases associated by macroscopic volume losses and that FS-CT will detect the cortical component. In diseases without macroscopic volume losses, FS-CT is the optimal method to detect cortical abnormalities. DBM is the optimal method to detect subcortical abnormalities, but DBM also will pick up some of the cortical pathology in these diseases.
Footnotes
-
This work was supported by the National Institutes of Health grant R01NS0311966 to K.D.L.
-
Disclosures: Paul Garcia: Research Support (including provision of equipment or materials): Medtronic, UCB Pharma Details: RCT of thalamic stimulation (Medtronics) and brivaracetam (UCB Pharma). Michael Weiner: Research Support (including provision of equipment or materials): NIH, VA, DOD, Merck, Avid Consultant: Astra Zeneca, Araclon, Medivation, Pfizer, Ipsen, TauRx, Bayer Healthcare, Biogen Idec, Exonhit Therapeutics, Servier, Synarc.
Indicates open access to non-subscribers at www.ajnr.org
References
- Received November 1, 2011.
- Accepted after revision January 25, 2011.
- © 2011 by American Journal of Neuroradiology


